Rubber prices rose again in October driven by weather rather than demand. Heavy rain and flooding in Thailand disrupted tapping until mid-October. Stocks in Qingdao, China’s main rubber storage hub, kept falling. Rubber futures reached their highest level since early 2013 on 9th October. Chinese Natural Rubber RSS3 averaged 6.0% more than in September. India’s Kerala RSS-4 set a new record on 13th October.
Synthetic rubber followed natural rubber rather than its own feedstocks. Butadiene, the main input for butadiene rubber (BR) and styrene butadiene rubber (SBR), fell about 3% in China in October. Even so, BR rose 6.0% and SBR 5.1% in China. With natural rubber at multi-year highs, tire makers used more synthetic rubber in their compounds. That gave synthetic producers room to raise prices. Acrylonitrile butadiene rubber (NBR) used mainly in seals and gloves rather than tires, rose 2.2%.
Access real-time price trends for 200 commodities across key geographies. Explore Grand View Signal with a Free Account.
The rally did not last through the month. Rain in Thailand eased from mid-October, and tapping was expected to recover ahead of the fourth-quarter peak season. Chinese tire demand stayed weak, and some tire makers halted production on poor margins. The sport prices for natural rubber, BR, and SBR all peaked on 9th October and drifted lower afterwards. Outside Asia, prices rose about 2.5–4.5%, as cargoes priced during the earlier Asian rally arrived.
Key Price Developments & Insights
Natural Rubber RSS3 in China reached its highest level in more than a year on 9th October and then fell 2.3% by 26 October as the weather in Thailand improved. The monthly average was still 6.0% above September.
BR rose 6.0% in China, the joint-largest increase among the rubbers we cover, even though butadiene fell. Tire makers switched part of their natural rubber demand to synthetic rubber. The SHFE BR contract traded about 4% below spot in late October.
SBR rose 5.1% in China. The sport prices described the market as rising at first and then moving into a volatile downtrend after 9th October. Higher styrene, up 9.9%, partly offset cheaper butadiene.
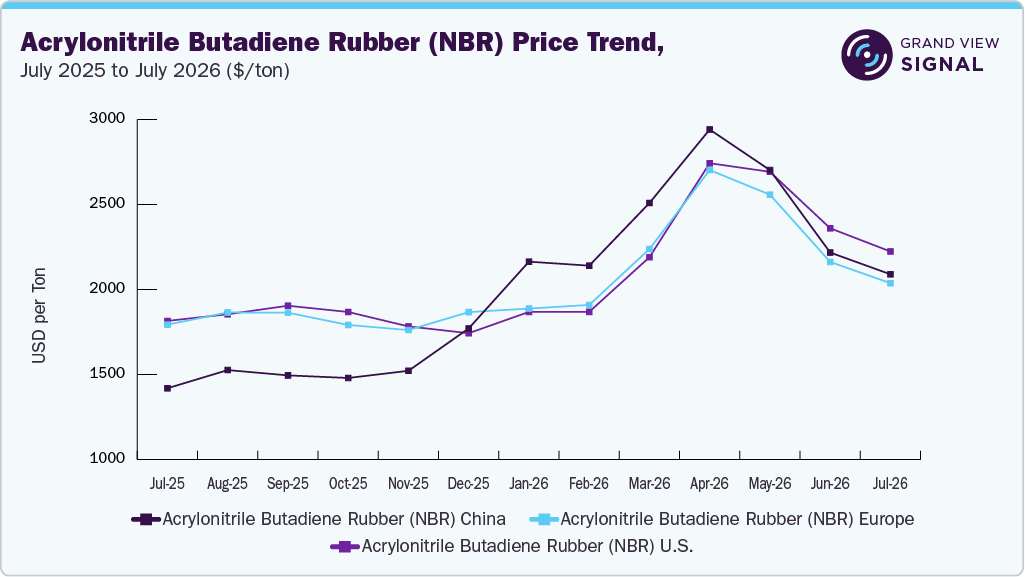
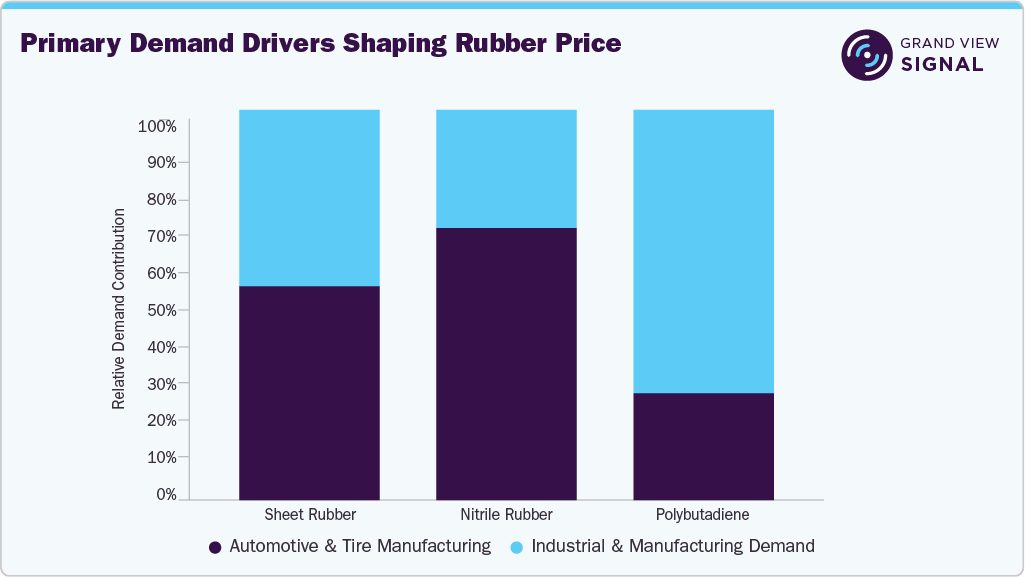
NBR moved less, rising 2.2% in China. Acrylonitrile was nearly flat and butadiene fell. NBR goes mainly into seals, hoses, and gloves, so tire substitution demand did not reach it.
India’s Kerala RSS-4 hit a record on 13th October, edging past its previous record of 1st August, on tight supply and strong tire demand. International RSS-4 was priced less than 1% below domestic rubber, so imports offered little relief.
Top Performing Rubber Commodity
Top Mover: Butadiene Rubber (BR)
Average MoM Growth (top 3 geographies): 6.0%
Volatility Level: Medium
Natural Rubber – Pricing Trends, October 2026
Natural Rubber RSS3 rose 6.0% in China in October, but most of the gain came in the first nine days. Heavy rain and flooding in Thailand interrupted tapping until mid-October. World Meteorological Organization warnings that El Niño could last until February 2027 added to supply concerns. Qingdao stocks kept falling, and all-steel tire stocks were low. Futures rose about 1.9% between 1st and 9th October to their highest level since 2013. Once the rain eased, prices fell back, and futures were about 3.4% lower by 14th October.
India was firm as well. Kerala RSS-4 set a new record on 13th October and natural rubber assessment rose 3.8% on the month. Domestic supply in India is short and imports did not help because international RSS-4 was priced less than 1% below domestic rubber. In Europe and the U.S., natural rubber rose 3.2% and 3.8%, as cargoes priced during the September rally arrived.
Pricing Intelligence Platform
Real-time price trends and movements for 200 commodities
Latest and impact-making market drivers
Geographic coverage across key countries
Impact and Forecasting based on Geopolitical Scenarios
BR and SBR rose because of natural rubber not their own costs. Butadiene fell about 3% in China in October but BR rose 6.0% and SBR 5.1%. Tire makers substituted synthetic rubber for some of the expensive natural rubber in their compounds. Both rubbers peaked on 9th October with natural rubber and then eased. By 26th October, BR was 2.0% and SBR 2.3% below their peaks. The SHFE BR contract was about 4% below spot by late October, which showed that the market expected lower prices.
NBR was more stable. It rose 2.2% in China and stayed within a narrow range all month. Acrylonitrile was nearly flat and butadiene was lower, so NBR producers had no cost reason to raise prices. Since NBR goes mainly into seals, hoses, and disposable gloves rather than tires, the substitution demand that lifted BR and SBR did not apply.
Rubber Price Direction, By Geography And Rubber Group, November 2026
Geography
Natural Rubber
Synthetic Rubber
China
-3.5%
-2.0%
India
France
Germany
UK
Europe
U.S.
Saudi Arabia
UAE
Qatar
Egypt
Morocco
Rubber Pricing - Key Drivers
Flooding in Thailand disrupts tapping and lifts rubber to 2013 highs - Weather was the main driver of rubber prices in October. Heavy rain and flooding in Thailand, the world’s largest producer, interrupted tapping into mid-October and disrupted deliveries to car-parts suppliers. Rubber futures rose about 1.9% between 1st and 9th October, reaching their highest level since early 2013. Supply was already tight with Qingdao stocks falling. Once the rain eased around mid-October, traders expected tapping to recover before the fourth-quarter peak. Futures fell about 3.4% between 9th and 14th October.
Natural rubber strength spills over into synthetic rubber - Synthetic rubber prices usually follow butadiene and styrene. However, in October they followed natural rubber. Chinese butadiene rose early in the month, then fell back to end about 3% lower. Styrene rose 9.9%, however BR rose 6.0% and SBR 5.1%, because natural rubber was at its highest level in years. Tire makers used more synthetic rubber where specifications allowed. That gave synthetic producers room to raise prices even though their costs were not rising. The link worked both ways. Once natural rubber turned down after 9th October, BR and SBR eased with it.
Weak tire demand caps the rally - Tire demand did not support higher rubber prices. Chinese tire makers entered the Golden Week holiday with weak orders and some stopped production because of poor profitability. Car and truck tire output fell sharply during the holiday shutdowns. Michelin’s nine-month results, published on 22nd October, showed passenger-car and light-truck replacement demand down 3% in North America and 1% in Europe. Original equipment demand was weaker in all segments. China was the exception, with replacement demand up 6%. When prices rose, tire makers bought only what they needed leading to a price fall after 9th October.
Get in-depth driver impact analysis on rubber prices. Access Grand View Signal.
NBR stays outside the tire-driven move - NBR behaved differently because it serves different markets. It is used mainly in oil-resistant seals, fuel hoses, gaskets, and disposable gloves, not in tires, so it did not gain from substitution demand. Its feedstocks did not help either. Acrylonitrile was nearly flat in China in October, and butadiene fell about 3%. NBR rose 2.2% in China and stayed in a narrow range all month. Western NBR prices rose 1.1% in Europe and 3.1% in the U.S.
El Niño becomes the main supply risk for 2027 - Looking beyond October, El Niño is the main supply risk. The World Meteorological Organization expects it to strengthen, peak in December and possibly last until February 2027. Dry conditions in Southeast Asia during an El Niño can cut rubber yields, especially as trees enter their normal low-output period in the first quarter. This risk explains why rubber prices stayed close to their highs even after the October rain eased. For now, the market expects more supply as Thai tapping recovers, but buyers are wary of committing to lower prices for the first quarter of 2027.
Rubbers - Commodity Coverage
Natural Rubber
The natural-rubber category covers natural rubber RSS3, a ribbed smoked sheet grade used mainly in tires and other rubber products. In October, flooding in Thailand and falling Qingdao stocks lifted prices to multi-year highs before better weather in mid-month brought them back down.
Natural Rubber Pricing - Key influencers
Weather and tapping conditions in major producing countries
Physical inventories, imports, and raw material availability
Tire production and replacement market demand
Currency, freight, and regional procurement conditions
Get historical, current, and forecast natural rubber price assessments. Access Grand View Signal.
The synthetic-rubber category covers nitrile rubber (NBR), butadiene rubber (BR), and styrene butadiene rubber (SBR). These materials are used in tires, belts, hoses, footwear, seals, gloves, and other industrial rubber products. In October, BR and SBR rose with natural rubber even though butadiene fell. NBR moved in line with its flat to lower feedstock costs.
Synthetic Rubber Pricing - Key influencers
Butadiene, styrene, and acrylonitrile feedstock costs
Producer operating rates, maintenance, and inventories
Tire and automotive-component manufacturing
Industrial-rubber consumption and substitution between rubber grades
Get historical, current, and forecast synthetic rubber price assessments. Access Grand View Signal.
China - China’s rubber prices rose 4.8% on average in October. Most of the gain came in the first week after the Golden Week holiday, when flooding in Thailand and falling Qingdao stocks lifted natural rubber, and BR and SBR followed. All three peaked on 9th October and then fell back as the rain eased. Tire makers bought cautiously because their margins were weak, and the SHFE BR contract ended the month about 4% below spot.
India - India’s rubber prices rose 3.9% on average. Natural rubber set records, with Kerala RSS-4 at a new high on 13th October. Tight domestic supply and strong tire demand drove the move. International RSS-4 was priced less than 1% below domestic rubber, so imports offered Indian tire makers little discount. BR rose 4.9% and SBR 4.3%, following China.
Europe - European rubber prices rose 3.0% on average. SBR rose 4.0%, BR 3.8%, natural rubber 3.2% and NBR 1.1%. Most of the increase reflects cargoes bought during the Asian rally arriving several weeks later. Demand was soft. Michelin reported European passenger-car and light-truck replacement demand down 1% over the first nine months. The weaker euro reduced European prices in dollar terms.
France - French rubber prices rose 3.8% on average, the firmest in Europe. BR rose 6.0% and SBR 5.1%, in line with Asian synthetic prices, while natural rubber rose 3.0% and NBR 1.2%. France’s large tire industry buys natural rubber on longer contracts, so October prices mostly reflect Asian levels from September and early October. Weak original equipment demand limited how much converters could pass on.
Germany - German rubber prices rose 2.5% on average, led by BR (+3.1%) and natural rubber (+3.0%). German demand depends heavily on carmakers, and original-equipment tire demand stayed weak across Europe. Replacement demand was steady but not growing, so German buyers had little reason to build stocks at higher prices. NBR, used in automotive seals and industrial hoses, rose 1.3%.
UK - UK rubber prices rose 3.2% on average. SBR rose 5.1%, natural rubber 3.5%, BR 3.1% and NBR 0.9%. The UK imports all of its rubber, so its prices follow Asian and European prices with a shipping delay. Waste-tire and recycling rules continued to affect industry costs, but they do not set prices for new rubber.
Get region-wise rubber price assessment. Access Grand View Signal.
U.S. - U.S. rubber prices rose 3.2% on average. Natural rubber rose 3.8%, BR 3.2%, NBR 3.1% and SBR 2.8%. U.S. tire demand stayed soft, with North American replacement demand down 3% over the first nine months. Michelin’s truck business improved in the third quarter as Class 8 truck orders recovered. The U.S. imports all of its natural rubber, so October prices reflect the Asian rally of September and early October.
Saudi Arabia - Saudi rubber prices rose 4.4% on average, as BR rose 6.0% and SBR 4.6%. Saudi synthetic rubber prices follow Asia, so the increase in China passed straight through. Renewed Iranian strikes on Hormuz shipping from mid-October kept freight and insurance costs for Gulf cargoes high, which added to delivered prices.
UAE - UAE rubber prices rose 4.2% on average, led by BR (+5.0%) and SBR (+4.6%). Natural rubber rose 4.0% and NBR 3.2%. The UAE imports all of its rubber, so its prices follow Asian prices plus freight. Shipping to the Gulf stayed expensive because of war-risk insurance, which made delivered prices rise faster than Asian export prices.
Egypt - Egyptian rubber prices rose 4.2% on average, with BR up 6.0% and SBR up 5.1%. The Egyptian pound averaged 3.8% weaker against the dollar in October and weakened further late in the month. That raised the local-currency cost of imported rubber. Several Chinese-backed tire projects planned in Egypt will lift future rubber demand, but they are not yet producing.
Morocco - Moroccan rubber prices rose 4.0% on average, with BR up 6.0% and SBR up 5.1%. Morocco imports rubber for its growing automotive parts and tire-related industry, so prices follow European and Asian offers. The dirham weakened 3.7% against the dollar, which raised local-currency costs.
Analyst Commentary
“October’s rubber market was driven by weather. Flooding in Thailand pushed natural rubber futures to their highest level since 2013. BR and SBR followed even though butadiene was cheaper, because tire makers switched part of their demand to synthetic rubber. The rally did not last. Rain eased from mid-October, Chinese tire makers were struggling with poor margins and bought only what they needed, and prices fell back from 9th October. We expect lower prices in November as Thai tapping recovers. El Niño remains a real risk to first-quarter 2027 supply, thus we do not expect a large fall.”
Butadiene rubber (BR) emerged as the top-performing rubber commodity in October 2026. Tire makers used more BR in place of expensive natural rubber, which allowed BR producers to raise prices even though butadiene costs fell.
BR pricing in China was moderately volatile. The BR peaked on 9th October and then fell 2.0% by 26th October, while the SHFE BR contract traded about 4% below spot. We expect BR to ease in November as natural rubber supply recovers.
See how Grand View Signal can support strategy and procurement teams, and why industry leaders rely on Grand View Research. Request a free demo or get your free access and explore our pricing intelligence platform.