- Home
- »
- Biotechnology
- »
-
Biological Data Visualization Market Size Report, 2025-2030GVR Report cover
![Biological Data Visualization Market (2025 - 2030)Report]()
Biological Data Visualization Market (2025 - 2030)
Size, Share & Trends Analysis Report By Technique (Sequencing, MRI), By Application, By Platform (Windows, Mac OS), By End-use, By Region, And Segment Forecasts
Market Size, 2024
$641.9MMarket Estimate, 2026
$735.0MMarket Forecast, 2030
$1,031.2MCAGR, 2025–2030
8.5%Biological Data Visualization Market Trends
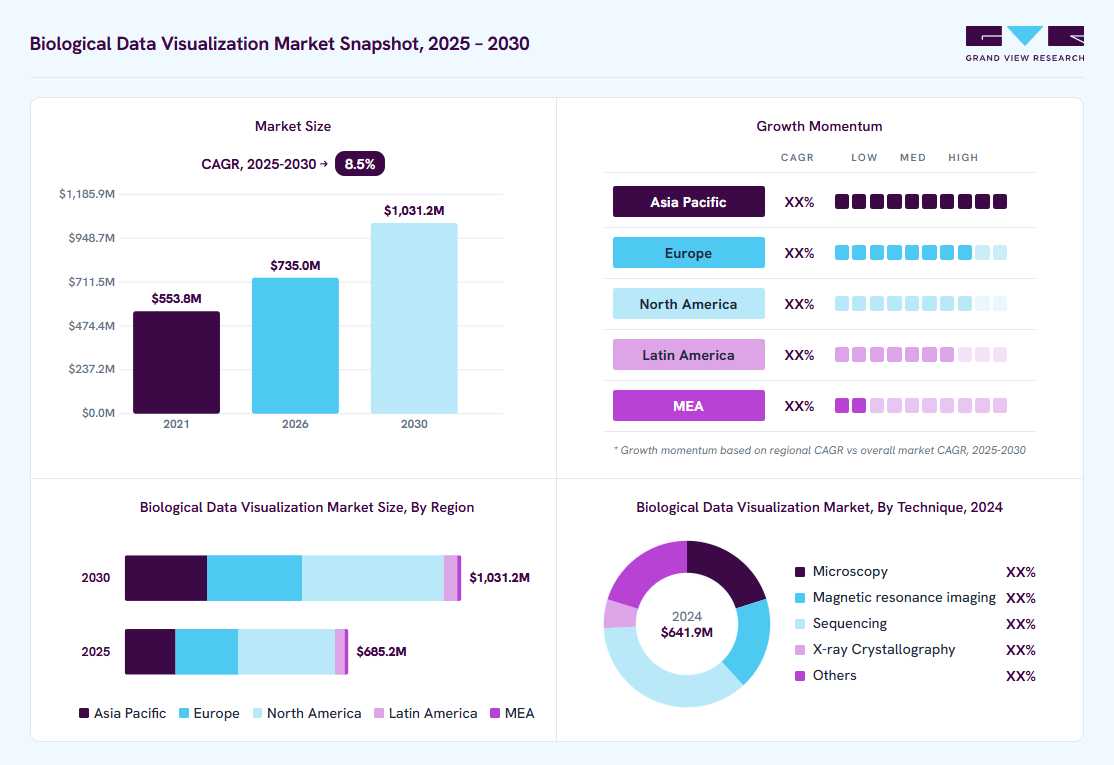
The global biological data visualization market size was valued at USD 641.9 million in 2024 and is projected to grow from USD 735.0 million in 2026 to USD 1,031.2 million by 2030, at a CAGR of 8.5% from 2025 to 2030. North America dominated the market, accounting for a revenue share of 43.4% in 2024. The advent of Artificial Intelligence (AI) in the analysis of biological information and the growing requirement for rapid decision-making through bioinformatics is likely to become a major determinant of market growth.
The COVID-19 pandemic demonstrated the importance of bio-manufacturing and biotechnology in developing and manufacturing vaccines, therapeutics, and diagnostics. The U.S. is one of the countries that identified the need to invest in scientific capabilities. The objective of boosting investments in biotechnology and bio-manufacturing is to establish a strong biological information ecosystem, including biologic data visualization. It is anticipated to advance innovation in biomanufacturing and biotechnology while keeping privacy and security and conducting research in a responsible manner.
")
Furthermore, in September 2022, NVIDIA Corporation is developing a framework that enables researchers in the life sciences and healthcare industry to benefit from rapidly growing chemical and biological datasets. Similarly, researchers from Harvard and the Broad Institute of MIT collaborated with NVIDIA to design and develop next-generation DNA language models through the framework. These models are expected to combine into a cloud platform developed by Microsoft, Verily, and Broad Institute that will allow biomedical researchers to access, share, and analyze information at any scale. Such initiatives is likely to support the growth of the biological data visualization market.
In addition, biological information generation has grown exponentially. This large volume of biological data is known as big data, transforming case-based studies into large-scale, data-driven research experiments. For instance, the European Bioinformatics Institute stated in September 2022 that the volume of data management scaled up from 40 petabytes to 250 petabytes in six years. The rapid enhancement is due to development in various biomedical and biological research areas, such as proteomics, genomics, and transcriptomics. Thereby anticipated propelling the demand for biological data visualization over the forecast period.
Technique Insights
The sequencing technique accounted for the largest revenue share of 41.74% in 2024. This dominance is attributed to the rapid advancements in next-generation sequencing (NGS) technologies, which have significantly increased the volume of biological data. Sequencing techniques are critical in genomics, proteomics, and multiomics research, driving demand for visualization tools to interpret complex datasets. The growing application of sequencing in personalized medicine, drug discovery, and disease diagnostics has further propelled its market share, as researchers and clinicians increasingly rely on visualization solutions to analyze large-scale biological data effectively.
The magnetic resonance imaging (MRI) segment is projected to witness the fastest growth rate of 10.30% over the forecast period. This rapid growth is driven by MRI's increasing use in clinical and research settings for high-resolution, non-invasive imaging of biological structures. As advancements in MRI technology continue, its ability to generate complex, detailed imaging data necessitates sophisticated visualization tools. Thus, propelling the growth of the segment over the forecast period.
Application Insights
Cell & organism imaging dominated the market with a revenue share of 43.12% in 2024, primarily due to its critical role in understanding complex biological processes at both cellular and organism levels. This application is widely used in developmental biology, cancer research, and drug discovery, where visualizing cellular interactions, tissue structures, and organismal responses is essential for scientific advancements. The increasing adoption of advanced imaging techniques, such as fluorescence microscopy and live-cell imaging, is further anticipated to fuel the demand for sophisticated visualization tools, enabling researchers to analyze intricate biological systems in real-time with greater accuracy.
The genomic analysis segment is projected to witness the fastest growth rate from 2025 to 2030. This surge is driven by the rising demand for tools to interpret vast amounts of genomic data generated by techniques such as next-generation sequencing (NGS). As genomic research becomes increasingly integral to areas like personalized medicine, disease prediction, and drug development, the need for efficient visualization solutions to handle complex datasets has grown significantly. Thus, propelling the growth of the segment over the forecast period.
Platform Insights
The windows dominated the market with a revenue share of 69.58% in 2024. This dominance can be attributed to the widespread use of Windows operating systems in academic, research, and commercial settings. Many biological data visualization tools and software are designed to be compatible with Windows due to its extensive user base and familiarity among researchers.
The Mac OS segment is projected to witness the fastest growth rate of 9.42% over the forecast period. This rapid growth is driven by the increasing adoption of Mac OS among researchers and professionals due to its superior graphics capabilities, ease of use, and strong performance in handling high-resolution imaging and large datasets. Additionally, Mac OS is favored for its robust security features and seamless integration with various scientific and creative applications, making it an attractive choice for biological data analysis and visualization, particularly in academic and research institutions where precision and performance are critical. Thus, propelling the segment’s growth over the forecast period.
End-use Insights
The academic research segment dominated the market and accounted for the largest revenue share of 69.45% in 2024. This is attributed to the significant role that academic institutions play in advancing biological research, where data visualization tools are essential for interpreting complex datasets across genomics, proteomics, and cell biology. With the growing focus on multidisciplinary research and the increasing use of high-throughput technologies, academic researchers rely heavily on visualization platforms to analyze and present findings.
")
The pharmaceutical & biotechnology companies segment is expected to witness the fastest growth rate over the forecast period. The increasing use of data visualization tools in drug discovery, development, and personalized medicine is anticipated to boost the segment's growth over the forecast period. Furthermore, pharmaceutical and biotech companies increasingly leverage advanced visualization platforms to analyze complex biological data, such as genomic and proteomic information, to accelerate research and development processes.
Regional Insights
North America biological data visualization market has dominated the global market, with a revenue share of 43.36% in 2024. The region has advanced healthcare infrastructure, robust research and development activities, and the presence of key players in the pharmaceutical, biotechnology, and academic sectors. North America's strong focus on personalized medicine, genomics, and multiomics research has increased the demand for sophisticated data visualization tools to handle large, complex datasets. Thereby propelling the demand for the biological data visualization market in the region over the forecast period.

U.S. Biological Data Visualization Market Trends
The biological data visualization market in U.S. is expected to grow over the forecast period. The increasing demand for advanced visualization tools in various sectors, including healthcare, academic research, and biotechnology fuels this growth.
Europe Biological Data Visualization Market Trends
The European biological data visualization market is experiencing significant growth, driven by increasing investment in life sciences research and development across various countries has led to a higher demand for advanced data visualization tools.
The biological data visualization market in UK is expected to grow over the forecast period. The UK is a global leader in life sciences research and biotechnology, with numerous universities and research institutions actively engaged in cutting-edge studies that generate vast amounts of biological data.
France biological data visualization market is expected to grow over the forecast period. France strongly emphasizes biotechnology and life sciences research, with numerous academic institutions and research centers dedicated to advancing biological studies.
The biological data visualization market in Germany is expected to grow over the forecast period. Germany's commitment to innovation in healthcare and biotechnology, supported by government initiatives and funding, is likely to enhance further the development and adoption of biological data visualization solutions.
Asia Pacific Biological Data Visualization Market Trends
The Asia Pacific biological data visualization market is anticipated to grow at the fastest rate of 10.24% over the forecast period. This growth is primarily attributed to increasing investments in research and development, driven by government initiatives and private funding, which are significantly boosting the demand for advanced biological data visualization tools.
The biological data visualization market in China is expected to grow over the forecast period. The increasing focus on personalized medicine, genomics, and drug discovery in China amplifies the demand for sophisticated data visualization solutions to manage complex datasets and enhance decision-making processes.
Japan biological data visualization market is expected to grow over the forecast period. The increasing focus on personalized medicine and genomics in the country is generating vast amounts of biological data, necessitating the use of sophisticated visualization tools to analyze and interpret this information effectively.
Middle East & Africa Biological Data Visualization Market Trends
The biological data visualization market in the Middle East & Africa is expected to experience substantial growth over the forecast period. Increasing investments in healthcare infrastructure and research initiatives across the region enhance scientific research capabilities, thereby generating a greater need for advanced biological data visualization tools.
Kuwait biological data visualization market is expected to grow over the forecast period. The government initiatives aimed at improving healthcare services and promoting biotechnology research are anticipated to stimulate the market.
Key Biological Data Visualization Company Insights
The market players are adopting product approval to increase the reach of their products in the market and improve the availability of their products in diverse geographical areas, along with expansion as a strategy to enhance production/research activities. In addition, several market players are acquiring smaller players to strengthen their market position. This strategy enables companies to increase their capabilities, expand their product portfolios, and improve their competencies.
Key Biological Data Visualization Companies:
The following are the leading companies in the biological data visualization market. These companies collectively hold the largest market share and dictate industry trends.
- Thermo Fisher Scientific, Inc.
- 3M
- Tableau Software, LLC,
- QIAGEN
- ZEISS International
- Oxford Instruments
- Olympus Corporation
- General Electric Company
- Agilent Technologies Inc.
- Clarivate
Recent Developments
-
In May 2024, Sophia Genetics, a health technology company in the U.S., has teamed up with Microsoft and NVIDIA. Together, they aim to use their technology and genomics knowledge to create a new solution for analyzing whole genome sequencing (WGS).
-
In May 2024, Parse Biosciences, which offers easy and scalable single-cell sequencing solutions, launched Trailmaker, a cloud platform designed for analyzing single-cell data. Trailmaker is fast, scalable, and provides complete analysis, helping users overcome common challenges and quickly turn single-cell data into valuable biological insights.
Biological Data Visualization Market Report Scope
Report Attribute
Details
Market size in 2024
USD 641.9 million
Estimated market size in 2026
USD 735.0 million
Projected market size by 2030
USD 1,031.2 million
Growth rate
CAGR of 8.5% from 2025 to 2030
Actual data
2018 - 2024
Forecast period
2025 - 2030
Quantitative units
Revenue in USD million/billion, and CAGR from 2025 to 2030
Report coverage
Revenue forecast, company ranking, competitive landscape, growth factors, and trends
Segments covered
Technique, application, platform, end-use, region
Regional scope
North America; Europe; Asia Pacific; Latin America; MEA
Country scope
U.S.; Canada; Mexico; Germany; UK; France; Italy; Spain; Denmark; Sweden; Norway; China; Japan; India; South Korea; Australia; Thailand; Brazil; Argentina; South Africa; Saudi Arabia, UAE; Kuwait
Key companies profiled
Thermo Fisher Scientific, Inc.; 3M; Tableau Software, LLC; QIAGEN; ZEISS International; Oxford Instruments; Olympus Corporation; General Electric Company; Agilent Technologies Inc.; Clarivate
Customization scope
Free report customization (equivalent up to 8 analysts working days) with purchase. Addition or alteration to country, regional & segment scope.
Pricing and purchase options
Avail customized purchase options to meet your exact research needs. Explore purchase options
Global Biological Data Visualization Market Report Segmentation
This report forecasts revenue growth at global, regional, and country levels and provides an analysis of the latest industry trends in each of the sub-segments from 2018 to 2030. For this study, Grand View Research has segmented the global biological data visualization market report based on technique, application, platform, end-use, and region.
-
Technique Outlook (Revenue, USD Million, 2018 - 2030)
-
Microscopy
-
Magnetic Resonance Imaging
-
Sequencing
-
X-ray Crystallography
-
Others
-
-
Application Outlook (Revenue, USD Million, 2018 - 2030)
-
Cell and Organism Imaging
-
Structural biology and Molecular Modeling
-
Genomic Analysis
-
Alignments, Phylogeny, and Evolution
-
Systems Biology
-
-
Platform Outlook (Revenue, USD Million, 2018 - 2030)
-
Windows
-
Mac OS
-
Linux
-
Others
-
-
End-use Outlook (Revenue, USD Million, 2018 - 2030)
-
Academic Research
-
Pharmaceutical & Biotechnology Companies
-
Hospitals & Clinics
-
Other users
-
-
Regional Outlook (Revenue, USD Million, 2018 - 2030)
-
North America
-
U.S.
-
Canada
-
Mexico
-
-
Europe
-
Germany
-
UK
-
France
-
Italy
-
Spain
-
Denmark
-
Sweden
-
Norway
-
-
Asia Pacific
-
China
-
Japan
-
India
-
South Korea
-
Australia
-
Thailand
-
-
Latin America
-
Brazil
-
Argentina
-
-
Middle East & Africa
-
South Africa
-
Saudi Arabia
-
UAE
-
Kuwait
-
-
Frequently Asked Questions About This Report
The global biological data visualization market size was valued at USD 641.9 million in 2024 and is estimated at USD 735.0 million for 2026.
The global biological data visualization market is expected to grow at a CAGR of 8.5% from 2025 to 2030, reaching USD 1,031.2 million by 2030.
North America dominated the biological data visualization market with a share of 43.1% in 2025. This is attributable to the growth of capital-intensive biotechnology sectors, such as personalized medicine, and the development of high-throughput sequencing techniques in this region.
Some key players operating in the biological data visualization market include Thermo Fisher Scientific, Inc.; 3M; Tableau Software, LLC,; QIAGEN; ZEISS International; Oxford Instruments; Olympus Corporation; General Electric Company; Agilent Technologies Inc.; Clarivate
Key factors that are driving the market growth include the rapid growth of biological data generation, the incorporation of artificial intelligence in the analysis of biological data, and the growing demand for faster decision-making.
Asia Pacific is the fastest-growing region over the forecast period.
The sequencing segment held the largest revenue share of over 36.0% in 2025.
The windows segment held the largest revenue share of over 60.0% in 2025.
The cell & organism imaging segment held the largest revenue share of over 36.7% in 2025.
About the Author(s)
Biotechnology Research Team
Healthcare · BiotechnologyThis report was authored by the biotechnology research team at Grand View Research - comprising two research analysts, one senior research analyst, and one industry expert - with specialized expertise in the biotechnology segment of the healthcare industry. All findings are based on proprietary healthcare databases, executive interviews, and regulatory analysis, subject to internal peer review prior to publication.
Last Updated:
Speak to Analyst


Need a Tailored Report?
Customize this report to your needs — add regions, segments, or data points, with 20% free customization.
Or view our licence options:

ISO 9001:2015 & 27001:2022 Certified
We are GDPR and CCPA compliant! Your transaction & personal information is safe and secure. For more details, please read our privacy policy.


