- Home
- »
- Advanced Interior Materials
- »
-
Control Valves Market Size, Share & Growth Report, 2030GVR Report cover
![Control Valves Market Size, Share & Trends Report]()
Control Valves Market (2023 - 2030) Size, Share & Trends Analysis Report By Component (Valve Body, Actuators), By Size, By Product, By Application (Oil & Gas, Chemical, Energy & Power, Pharmaceutical, F&B), By Region, And Segment Forecasts
- Report ID: GVR-2-68038-194-8
- Number of Report Pages: 264
- Format: PDF
- Historical Range: 2018 - 2021
- Forecast Period: 2023 - 2030
- Industry: Advanced Materials
- Report Summary
- Table of Contents
- Segmentation
- Methodology
- Download FREE Sample
-
Download Sample Report
Control Valves Market Summary
The global control valves market size was valued at USD 6.34 billion in 2022 and is projected to reach USD 12.40 billion by 2030, growing at a CAGR of 9.4% from 2023 to 2030. The market is driven by rising demand from end-use industries such as water & wastewater treatment, oil & gas, and energy & power industry.
Key Market Trends & Insights
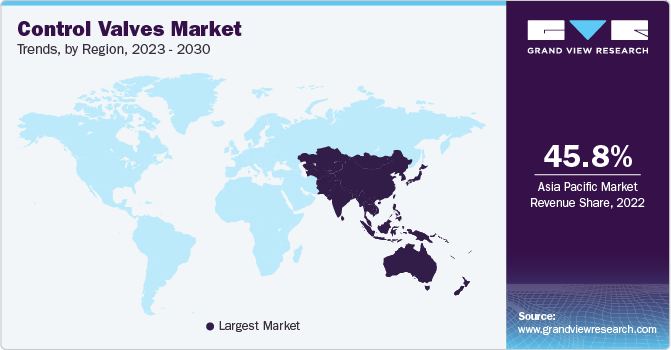
- Asia Pacific dominated the market and accounted for the largest revenue share of 45.8% in 2022.
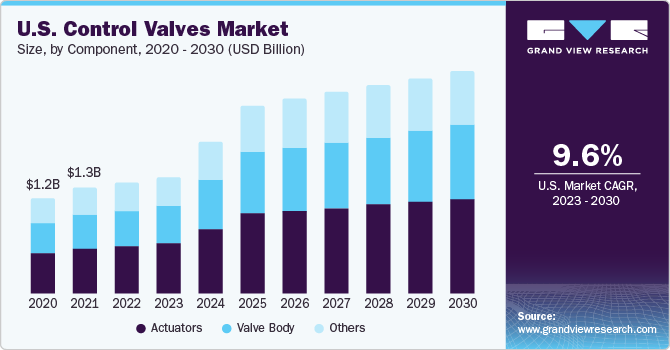
- North America is anticipated to grow at a CAGR of 9.5% during the forecast period.
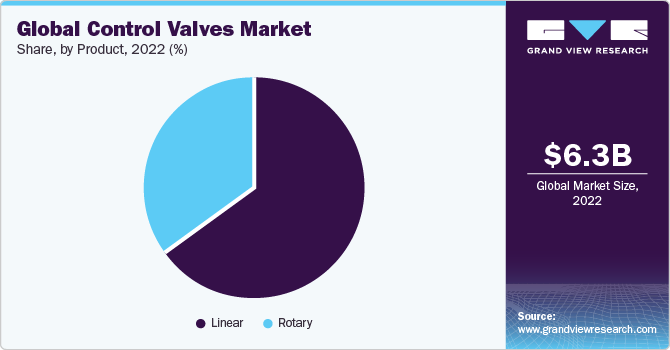
- Based on product, the linear segment accounted for the largest revenue share of 64.8% in 2022.
- By application, the oil & gas segment accounted for the largest revenue share of 23.6% in 2022.
- By component, the actuator segment accounted for the largest revenue share of 43.4% in 2022.
Market Size & Forecast
- 2022 Market Size: USD 6.34 Billion
- 2030 Projected Market Size: USD 12.40 Billion
- CAGR (2023-2030): 9.4%
- Asia Pacific: Largest market in 2022
Additionally, the increasing adoption of industrial automation is boosting the use of smart control valves, which is further expected to boost the market growth over the forecast period. Growing power generation plants across the world and increasing the need for energy and power from developing economies is driving the demand for control valves. These valves are also used in nuclear power plants especially in processes such as chemical treatment, feed water, cooling water, and steam turbine control system.Moreover, high-pressure, high-temperature, and adverse corrosion conditions experienced with production and refinery platforms have also led to a rise in demand for control valves. These platforms are mainly used in offshore and onshore oil & gas activities. These valves are used in most of the essential mechanisms in the oil & gas industries. It not only controls the flow, but also the volume, direction, rate, and pressure of fluids.

Control valves are extensively used in process industries such as food & beverages, oil & gas, water & wastewater, petrochemicals, energy & power, and pharmaceuticalss to reach growing automation needs. They play a vital role in increasing the end-use industry’s profitability, safety, and efficiency for multiple production processes. Furthermore, the adoption of control valves in industries is constantly rising owing to the benefits they offer in temperature or pressure control throughout downstream, midstream, and upstream activities.
A growing number of oil & gas exploration activities in regions such as the Middle East & Africa, China, and North America is estimated to provide an upthrust to the market. The market in the mentioned regions is projected to witness healthy growth over the forecast period. Additionally, stringent regulations pertaining to environmental legislation for end-use industries in Asia Pacific, North America, and Europe are playing an important role in driving the market. For instance, the U.S. Environmental Protection Agency (EPA) has mandated the use of traditional spring diaphragm actuators, which are used to actuate valves at the wellhead, in order to reduce greenhouse gas emissions. The regulatory body suggested replacing it with electric actuators with pneumatic devices, which can help to reduce methane and volatile organic compounds (VOC) emissions.
Several control valve companies are investing in powerful, state-of-the-art control instrumentation as a result of spiraling demand for technologically advanced products from emerging end-use industries. This is poised to result in growing competitive, environmental, and economic pressures to offer high-rated products with a shorter return on investment. Owing to the integration of digital intelligence, these technologically advanced control valves are one of the key elements of an effective plant asset management strategy.
Moreover, the growing trend of digitalization and automation in conventional plants is leading to higher demand for control valves. Therefore, control valve manufacturers are constantly engaging in R&D activities to design and develop their products according to the requirements of the end-use industries.
Size Insights
Some of the commonly available valve sizes are less than 1”, between 1” to 6”, between 6” to 25”, between 25” to 50”, and more than 50”. The between 1" to 6" segment accounted for the largest revenue share of 33.8% in 2022, owing to their extensive application in the chemical, pharmaceutical, and food & beverage industries.
The less than 1"segment is expected to grow at the fastest CAGR of 10.1% during the forecast period. Factors such as technological advancements such as miniaturization and smart valve technology, industry regulations focusing on energy efficiency, safety, and environmental compliance, as well as market trends like industrial automation, process optimization, and the expansion of end-use industries is anticipated to drive the market.
Application Insights
The oil & gas segment accounted for the largest revenue share of 23.6% in 2022 and is expected to grow at the fastest CAGR of 10.1% during the forecast period, owing to a wide application of control valves in natural gas generation, crude oil extraction, and refining processes. Moreover, owing to the increasing stringency of safety standards, around 10.0% of installed valves are replaced on a yearly basis.
The water & wastewater treatment segment is anticipated to grow at a CAGR of 9.5% during the forecast period. The water & wastewater industry encompasses various crucial processes, including the provision of water for industrial purposes and the treatment of wastewater generated by different sectors. Worldwide, there are over 90,000 municipal wastewater plants, where control valves play an indispensable role as vital components.
Component Insights
The actuator segment accounted for the largest revenue share of 43.4% in 2022. This is the most important component in control valve architecture, as it makes valve operation automatic. One of the primary factors hindering the demand for these valves is the lack of common platforms such as Ethernet, Profibus, and Zigbee.
The valve body segment is expected to grow at the fastest CAGR of 9.4% during the forecast period. Stringent environmental regulations and increasing industrial automation in emerging economies are poised to spur the growth of the segment over the forecast period. The primary factors influencing the valve body market is the overall demand for valves in various industries. The demand for valve bodies is directly linked to the demand for valves themselves, as valve bodies are an essential component of valves. Industries such as oil and gas, water and wastewater treatment, power generation, chemical processing, and pharmaceuticals heavily rely on valves for controlling fluid flow. The growth or decline in these industries directly impacts the demand for valve bodies.
Product Insights
Based on product, the market has been bifurcated into linear and rotary. Linear control valves have been further divided into gate, diaphragm, and others; whereas rotary types have been further segmented into ball, butterfly, and plug. The linear segment accounted for the largest revenue share of 64.8% in 2022. The market is dominated by linear control valves, owing to their surging demand from end-use industries such as oil & gas chemicals and energy & power in developing economies.

The rotary segment is expected to grow at the fastest CAGR of 9.5% during the forecast period.The market for control valves is seeing an increase in the use of rotary valves since they can handle corrosive and filthy materials, have higher ratios of compression and rpm, and can aid in reducing emissions. Additionally, rotary valves are mostly used in the food, pharmaceutical, water, and wastewater industries for handling powder, granules, and solid materials.
Regional Insights
Asia Pacific dominated the market and accounted for the largest revenue share of 45.8% in 2022 and is expected to grow at the fastest CAGR of 10.0% during the forecast period, owing to the presence of emerging economies such as China and India. Companies are investing heavily in valve and actuator manufacturing, along with technologies, which need to be associated to convert them into smart valves. This is due to the rising demand for automated valve operations in industries such as water & wastewater, food & beverage, energy & power, and pharmaceutical.

North America is anticipated to grow at a CAGR of 9.5% during the forecast period. The market is fueled by technological advancements and the escalating demand for energy efficiency and sustainable practices. In addition, the widespread adoption of industrial automation across various sectors has contributed significantly to the control valve market's expansion. Automated systems are increasingly being employed by industries to enhance productivity, reduce operational costs, and improve process control. In this context, control valves play a pivotal role in regulating fluid flow, pressure, temperature, and level in these automated systems. As the trend of process automation continues to grow, the demand for control valves is expected to witness substantial growth in North America.
Key Companies & Market Share Insights
The global market for control valves is highly fragmented in nature owing to the presence of a large number of small- and medium-scale manufacturers offering control valve products tailor-made to the requirements of end-use industries. In order to retain their market share in such a competitive market, companies are continually undertaking strategic initiatives such as mergers and acquisitions, joint ventures, product launches, and partnerships. This is aimed at expanding their presence globally as well as regionally and offering an enhanced product portfolio to their customer base.
Key Control Valves Companies:
- Emerson Electric Co.
- Flowserve Corporation
- IMI plc
- Alfa Laval AB
- AVK Holding A/S
- Eaton
- Honeywell International, Inc.
- Velan Inc.
- Burkert Fluid Control System
- Valvitalia SpA
Recent Developments
-
In June 2023, Aquana announced the launch of the Actuator Valve Serial (AVS), a new remote cutoff valve that is part of the Water IoT platform. The valve, manufactured and designed in the U.S., serves as a remote disconnect ball valve with an IP68 rating and can be integrated with any current Advanced Metering Infrastructure (AMI) platform.
-
In June 2023, Honeywell International, Inc. and Fokker Services entered into a memorandum of understanding in which Honeywell authorized Fokker to fulfil its requirements as a channel partner and service center for their pre-cooler control valve (PCCV) repair & reworking services. This partnership is anticipated to offer airline operators with more options for services of component repair.
-
In July 2022, Honeywell International, Inc. and Archer Aviation Inc. joined forces in a strategic alliance. Archer Aviation chose Honeywell as the supplier for their actuator, a critical component within Archer's 12 tilt 6 layout, which relies on Honeywell's cutting-edge actuation technology.
-
In January 2022, CIRCOR International, Inc. launched the CIR 3100 Control Valve, featuring a cost-effective valve body with multiple internal options suitable for a diverse range of applications across various industries.
-
In December 2022, Emerson unveiled the ASCO Series 209 proportional flow control valves that offer the highest levels of flow characteristics, pressure ratings, precision, and energy efficiency attainable in a purpose-built, compact construction.
Control Valves Market Report Scope
Report Attribute
Details
Market size value in 2023
USD 6.63 billion
Revenue forecast in 2030
USD 12.40 billion
Growth rate
CAGR of 9.4% from 2023 to 2030
Base year for estimation
2022
Historical data
2018 - 2021
Forecast period
2023 - 2030
Report updated
November 2023
Quantitative units
Revenue in USD million/billion, and CAGR from 2023 to 2030
Report coverage
Revenue forecast, company ranking, competitive landscape, growth factors, and trends
Segments covered
Component, size, product, application, region
Regional scope
North America; Europe; Asia Pacific; Central & South America; MEA
Country scope
U.S.; Canada; Mexico; Germany; France; Italy; UK; Spain; Russia; China; India; Japan; South Korea; Singapore; Australia; Brazil; Argentina; Saudi Arabia; UAE; South Africa
Key companies profiled
Emerson Electric Co.; Flowserve Corporation; IMI ; Alfa Laval AB; AVK Holding A/S; Eaton; Honeywell International, Inc.; Velan Inc.; Burkert Fluid Control System; Valvitalia SpA
Customization scope
Free report customization (equivalent up to 8 analyst’s working days) with purchase. Addition or alteration to country, regional & segment scope
Pricing and purchase options
Avail customized purchase options to meet your exact research needs. Explore purchase options
Global Control Valves Market Report Segmentation
This report forecasts revenue growth at global, regional, and country levels and provides an analysis of the latest industry trends in each of the sub-segments from 2018 to 2030. For this study, Grand View Research has segmented the global control valves market report based on component, size, product, application, and region:
-
Component Outlook (Revenue, USD Million, 2018 - 2030)
-
Valve Body
-
Actuators
-
Others
-
-
Size Outlook (Revenue in USD Million, 2018 - 2030)
-
Less than 1"
-
Between 1" to 6"
-
Between 6" to 25"
-
Between 25" to 50"
-
More than 50"
-
-
Product Outlook (Revenue in USD Million, 2018 - 2030)
-
Linear
-
Gate
-
Diaphragm
-
Others
-
-
Rotary
-
Ball
-
Butterfly
-
Plug
-
-
-
Application Outlook (Revenue in USD Million, 2018 - 2030)
-
Oil & Gas
-
Chemicals
-
Energy & Power
-
Water & Wastewater Treatment
-
Food & Beverages
-
Pharmaceuticals
-
Others
-
-
Regional Outlook (Revenue in USD Million, 2018 - 2030)
-
North America
-
U.S.
-
Canada
-
Mexico
-
-
Europe
-
Germany
-
France
-
Italy
-
UK
-
Spain
-
Russia
-
-
Asia Pacific
-
China
-
India
-
Japan
-
South Korea
-
Singapore
-
Australia
-
-
Central & South America
-
Brazil
-
Argentina
-
-
Middle East & Africa
-
Saudi Arabia
-
UAE
-
South Africa
-
-
Frequently Asked Questions About This Report
b. The global control valves market size was estimated at USD 6.34 billion in 2022 and is expected to reach USD 6.63 billion in 2023.
b. The global control valves market is expected to grow at a compound annual growth rate of 9.4% from 2023 to 2030 to reach USD 12.40 billion by 2030.
b. Linear control valves dominated the control valves market with a share of 64.8% in 2022 owing to its growing demand from several end-use industries including oil & gas, chemicals and energy & power in developing countries
b. Some of the key players operating in the control valves market include Emerson Electric Co.; Flowserve Corporation; IMI plc; Alfa Laval AB; AVK Holding A/S; Eaton; Honeywell International, Inc.; Velan; Inc., Burkert Fluid Control System; and Valvitalia SpA.
b. The key factors that are driving the control valves market include growing transportation sector and rapid industrialization in developing countries
Share this report with your colleague or friend.
Need a Tailored Report?
Customize this report to your needs — add regions, segments, or data points, with 20% free customization.

ISO 9001:2015 & 27001:2022 Certified
We are GDPR and CCPA compliant! Your transaction & personal information is safe and secure. For more details, please read our privacy policy.
Trusted market insights - try a free sample
See how our reports are structured and why industry leaders rely on Grand View Research. Get a free sample or ask us to tailor this report to your needs.


