- Home
- »
- Biotechnology
- »
-
High-performance Liquid Chromatography Market Report, 2030GVR Report cover
![High-performance Liquid Chromatography Market Size, Share & Trends Report]()
High-performance Liquid Chromatography Market Size, Share & Trends Analysis Report By Product (Instruments, Consumables & Accessories, Software), By Application, By End-user, By Region, And Segment Forecasts, 2022 - 2030
- Report ID: GVR-4-68039-962-3
- Number of Report Pages: 160
- Format: PDF, Horizon Databook
- Historical Range: 2018 - 2020
- Forecast Period: 2022 - 2030
- Industry: Healthcare
Report Overview
The global high-performance liquid chromatography market size was valued at USD 4.20 billion in 2021 and is anticipated to expand at a compound annual growth rate (CAGR) of 5.9% from 2022 to 2030. The market is expected to grow due to technological advancements in high-performance liquid chromatography (HPLC) techniques that have increased the reliability and robustness of liquid chromatography operations. For instance, the latest HPLC systems offer dual-injection systems, multidimensional capabilities, and intermediate pressure alternatives that are increasing the utility of the technique for a variety of research applications.

In addition, the COVID-19 pandemic has accelerated the adoption of HPLC systems for the development of new therapeutics, vaccines, and reliable diagnostic methods for the disease. For instance, a study published in the Microchemical Journal in October 2021 demonstrated a novel HPLC-based method for the determination of favipiravir, an emerging antiviral COVID-19 treatment option. Furthermore, with the increasing concerns regarding SARS-CoV-2 mutations, epidemiological applications of the technique for the characterization of viral proteins corresponding to emerging viral serotypes are expected to gain traction. These factors are anticipated to positively affect the market growth.
The market is also driven by key HPLC manufacturers that are expanding their offerings for specific applications such as preparative purification, amino acid analysis, two-dimensional liquid chromatography, method development, and clinical diagnostics. For instance, in October 2021, Novasep launched its Hipersep Process M HPLC system intended for commercial-scale purification of oligonucleotides, peptides, insulin, and other pharmaceutically relevant molecules. In addition, with the rising adoption of protein-based therapeutics, such as bispecificantibodies and antibody-drug conjugates, the applications of HPLC in the biopharmaceutical domain are expected to witness growth.
Launch of several liquid chromatography method development systems and support software in recent years is expected to simplify the usage and increase the productivity of HPLC systems. For instance, in August 2021, Thermo Fisher Scientific, Inc. collaborated with ChromSword to launch the Thermo Fisher Vanquish HPLC and UHPLC method development system. Similarly, in April 2022, Shimadzu Corporation launched its LabSolutions MD software for HPLC platforms to support analytical method development. Launch of such products is likely to increase the market penetration of HPLC systems and fuel the market growth.
Analytical use of the technique for forensics, medical research, or other field applications has created market opportunities for the development of portable HPLC systems. Hand-carried and fully portable systems have been developed by companies such as Axcend, under the Axcend Focus LC brand. Such developments represent breakthrough opportunities for product development to increase the adoption of the technique.
The market is expected to witness significant challenges with the rising involvement of chiral-compounds in pharmaceuticals. These compounds can have multiple chiral centers and may lead to the generation of over 50 different peaks in HPLC impurity profiles. As a result, higher separation power from HPLC columns and development of new methods is required to handle such complex drugs. However, with over 50% of the newly developed pharmaceuticals involving chiral-compounds, development of new assays can be laborious and time-consuming, thus representing an emerging challenge for the market growth.
Product Insights
The instruments segment held the largest revenue share of over 45.0% in 2021 due to the increasing dominance of integrated HPLC systems and the availability of advanced detectors. Manufacturers in this domain are focusing on the production of systems that can offer higher productivity and specificity of applications, as evident by the launch of the new i-Series LC-2050/LC-2060 integrated HPLC systems by Shimadzu Corporation in February 2021. These systems offer high-speed sampling capacities, along with a low carryover, for quality control applications. Furthermore, detectors such as Activated Research Company’s Solvere carbon selective detector, which can use both aqueous and organic solvents, are broadening the applicability of HPLC techniques for a variety of sample types.
Consumables and accessories such as columns and filters are expected to gain traction due to improvements in column chemistries and packing materials and increasing significance of filtration techniques for the protection of HPLC columns from any particulate contaminants. Increasing demand for chromatography operations with high sensitivity has led to an emphasis on the reduction of analyte–metal interactions that can interfere with the results. This can be accomplished with the help of advanced metal passivation or the use of PEEK (polyetheretherketone)-lined stainless steel columns. For instance, Agilent Technologies, Inc. provides AdvanceBio SEC PEEK-lined stainless-steel columns. Such columns are expected to witness a high growth potential and are likely to boost the market growth.
Application Insights
Clinical research applications accounted for the largest revenue share of over 35.0% in 2021 and are projected to expand at the fastest rate over the forecast period. This can be attributed to the expanding landscape of clinical trial activities, a surge in biopharmaceutical research and development, and rise in demand for high throughput analytical techniques. Furthermore, advantages offered by the technique for clinical research such as high analytical specificity and short runtimes, capability to run multi- and mega-parametric tests, and applicability to thermolabile, polar, and high molecular weight compounds make it a prominent alternative over other analytical methods. These factors are anticipated to boost the clinical research applications of HPLC.
Diagnostic applications are driven by the use of the technique for identification and quantification of biomarkers essential in the earlier diagnosis of chronic diseases. The technique also aids in increasing the accuracy of diagnosis by distinguishing between similar diseases. In addition, HPLC offers a superior option for analysis of metabolites and is used in the analysis of vitamin D and HbA1c hemoglobin due to its reproducibility and low coefficient of variation. With the rising prevalence of chronic diseases and the increasing need for robust diagnostic techniques, diagnostic applications of HPLC are expected to rapidly expand over the forecast period.
End-user Insights
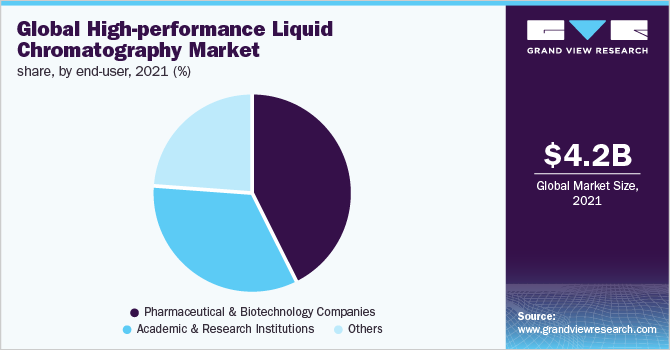
Pharmaceutical and biotechnology companies dominated the market in 2021 and accounted for over 40.0% share. Applications of HPLC methods in these companies include quality control, determination of drug purity, characterization of drug candidates, evaluation of the stability of active ingredients in pharmaceuticals, and several others. The segment is expected to witness growth due to the compatibility of HPLC with mass spectrometry, which enhances the detection capacities and selectivity of the technique. This increases the growth prospects of the technique for biopharmaceutical applications and is likely to boost the market growth.

Academic and research institutions are expected to grow at the fastest rate of 7.2% over the forecast period due to the rising government funding for academic research, increasing involvement of analytical instrumentation in academic teaching, and a significant role played by academic institutions in research and development activities. For instance, in the U.S., around 50% of all the basic research and about 10% to 15% of overall research and development is conducted at academic institutions. Furthermore, research and development spending by such institutions in the U.S. amounted to over USD 86.4 billion in the financial year 2020. Hence, the segment holds a high potential for the adoption of HPLC infrastructure and is likely to fuel the market growth in the near future.
Regional Insights
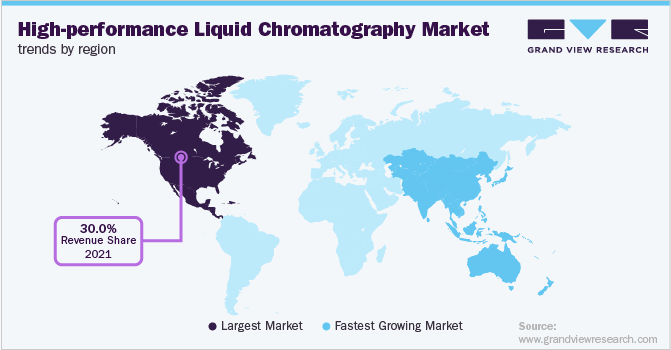
North America accounted for the largest share of over 30.0% in 2021. This can be attributed to rapid growth in the pharmaceutical industry, high research and development spending, increasing demand for clinical diagnostic applications, and the presence of key players such as Thermo Fisher Scientific, Inc.; Agilent Technologies, Inc.; and Bio-Rad Laboratories, Inc. in the region. Furthermore, the region is favored by a high extent of scientific awareness and the availability of skilled professionals, which further fuel the growth of HPLC applications.

Asia Pacific is projected to grow at the fastest rate over the forecast period due to a high potential for clinical research in the region because of the availability of a large patient pool. Furthermore, large-scale production of generics and biosimilars in countries such as China and India represents promising growth opportunities for the adoption of the technique for quality control and testing. In addition, research applications of HPLC for the analysis of traditional medication options, such as traditional Chinese medicines, are anticipated to open new growth avenues for the market.
Key Companies & Market Share Insights
Key players involved in the market are undertaking strategic initiatives for strengthening their portfolios and expanding their reach in key regions. For instance, in March 2021, PerkinElmer, Inc. acquired ES Industries to add liquid chromatography columns to its consumable portfolio. Some prominent players in the global high-performance liquid chromatography market include:
-
Waters Corporation
-
Thermo Fisher Scientific, Inc.
-
Agilent Technologies, Inc.
-
Shimadzu Corporation
-
Sartorius AG
-
PerkinElmer, Inc.
-
Bio-Rad Laboratories, Inc.
-
Merck KGaA
-
Tosoh Bioscience GmbH
-
Gilson, Inc.
-
Danaher Corporation
High-performance Liquid Chromatography Market Report Scope
Report Attribute
Details
Market size value in 2022
USD 4.44 billion
Revenue forecast in 2030
USD 7.03 billion
Growth rate
CAGR of 5.9% from 2022 to 2030
Base year for estimation
2021
Historical data
2018 - 2020
Forecast period
2022 - 2030
Quantitative units
Revenue in USD million/billion and CAGR from 2022 to 2030
Report coverage
Revenue forecast, company ranking, competitive landscape, growth factors, and trends
Segments covered
Product, application, end-user, region
Regional scope
North America; Europe; Asia Pacific; Latin America; MEA
Country scope
U.S.; Canada; U.K.; Germany; France; Italy; Spain; Japan; China; India; Australia; South Korea; Brazil; Mexico; South Africa; Saudi Arabia; UAE
Key companies profiled
Waters Corporation; Thermo Fisher Scientific, Inc.; Agilent Technologies, Inc.; Shimadzu Corporation; Sartorius AG; PerkinElmer, Inc.; Bio-Rad Laboratories, Inc.; Merck KGaA; Tosoh Bioscience GmbH; Gilson, Inc.; Danaher Corporation
Customization scope
Free report customization (equivalent up to 8 analyst’s working days) with purchase. Addition or alteration to country, regional & segment scope.
Pricing and purchase options
Avail customized purchase options to meet your exact research needs. Explore purchase options
Global High-performance Liquid Chromatography Market Segmentation
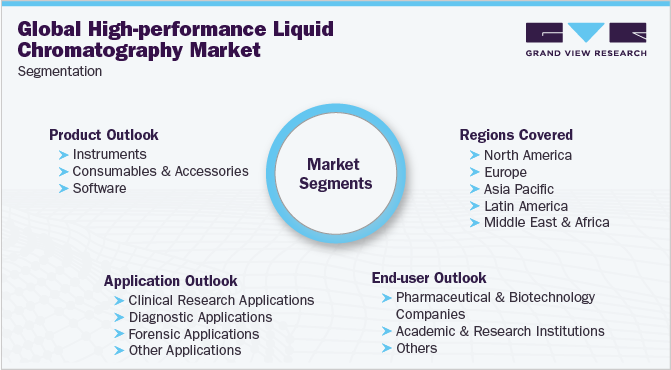
This report forecasts revenue growth at the global, regional, and country levels and provides an analysis of the latest industry trends and opportunities in each of the sub-segments from 2018 to 2030. For the purpose of this report, Grand View Research has segmented the global high-performance liquid chromatography market report on the basis of product, application, end-user, and region:

-
Product Outlook (Revenue, USD Million, 2018 - 2030)
-
Instruments
-
HPLC Systems
-
Pumps
-
Detectors
-
Others
-
-
Consumables& Accessories
-
Columns
-
Reverse-phase HPLC Columns
-
Normal-phase HPLC Columns
-
Ion Exchange HPLC Columns
-
Size Exclusion HPLC Columns
-
Other HPLC Columns
-
-
Filters
-
Vials
-
Tubes
-
Others
-
-
Software
-
-
Application Outlook (Revenue, USD Million, 2018 - 2030)
-
Clinical Research Applications
-
Diagnostic Applications
-
Forensic Applications
-
Other Applications
-
-
End-user Outlook (Revenue, USD Million, 2018 - 2030)
-
Pharmaceutical & Biotechnology Companies
-
Academic & Research Institutions
-
Others
-
-
Regional Outlook (Revenue, USD Million, 2018 - 2030)
-
North America
-
U.S.
-
Canada
-
-
Europe
-
U.K.
-
Germany
-
France
-
Italy
-
Spain
-
-
Asia Pacific
-
Japan
-
China
-
India
-
Australia
-
South Korea
-
-
Latin America
-
Brazil
-
Mexico
-
-
Middle East and Africa (MEA)
-
South Africa
-
Saudi Arabia
-
UAE
-
-
Frequently Asked Questions About This Report
b. The global high-performance liquid chromatography market size was estimated at USD 4.20 billion in 2021 and is expected to reach USD 4.44 billion in 2022.
b. The global high-performance liquid chromatography market is expected to grow at a compound annual growth rate of 5.9% from 2022 to 2030 to reach USD 7.03 billion by 2030.
b. North America dominated the HPLC market with a share of 32.7% in 2021. This is attributable to the rapid growth in the pharmaceutical industry, high research and development spending, increasing demand for clinical diagnostic applications, and the presence of key players such as Thermo Fisher Scientific, Inc., Agilent Technologies, Inc., Bio-Rad Laboratories, Inc., and others in the region.
b. Some key players operating in the HPLC market include Waters Corporation; Thermo Fisher Scientific, Inc.; Agilent Technologies, Inc.; Shimadzu Corporation; Sartorius AG; PerkinElmer, Inc.; Bio-Rad Laboratories, Inc.; Merck KGaA; Tosoh Bioscience GmbH; Gilson, Inc. and Danaher Corporation.
b. Key factors that are driving the high-performance liquid chromatography market growth include rapid growth in pharmaceuticals production, stringent regulatory norms for drug purity, increasing adoption of HPLC techniques for diagnostics and research purposes, and technological advancements in HPLC systems that are expanding its scope of applications.
Share this report with your colleague or friend.
![gvr icn]()
NEED A CUSTOM REPORT?
We can customize every report - free of charge - including purchasing stand-alone sections or country-level reports, as well as offer affordable discounts for start-ups & universities. Contact us now
![Certified Icon]()
We are GDPR and CCPA compliant! Your transaction & personal information is safe and secure. For more details, please read our privacy policy.
We are committed towards customer satisfaction, and quality service.
"The quality of research they have done for us has been excellent."


