- Home
- »
- Display Technologies
- »
-
Interactive Display Market Size, Share & Growth Report 2030GVR Report cover
![Interactive Display Market Size, Share & Trends Report]()
Interactive Display Market (2023 - 2030) Size, Share & Trends Analysis Report By Display Type (Interactive Kiosk, Interactive Video Wall), By Application (BFSI, Healthcare, Retail), By Region, And Segment Forecasts
Market Size, 2022
$41.5BMarket Estimate, 2026
$44.3BMarket Forecast, 2030
$75.1BCAGR, 2023–2030
7.8%Interactive Display Market Summary
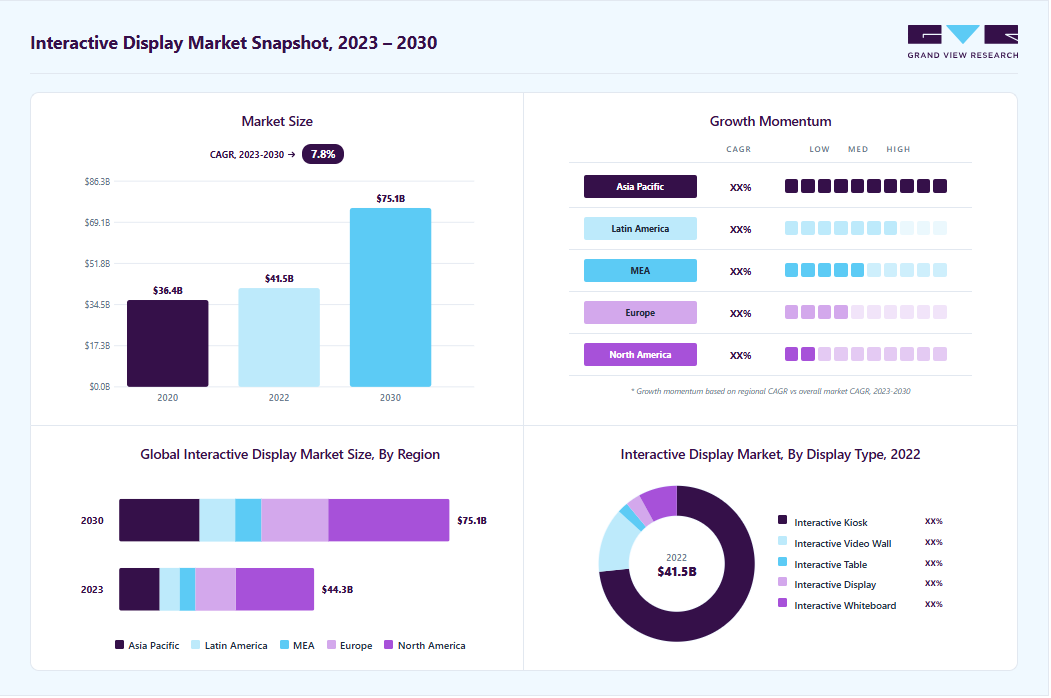
The global interactive display market size was estimated at USD 41.45 billion in 2022 and is projected to reach USD 75.06 billion by 2030, growing at a CAGR of 7.8% from 2023 to 2030. The study comprises an interactive kiosk, video walls, a table, monitors, and a whiteboard.
Key Market Trends & Insights
- The North America region led the overall market in 2022, with a market share of 40.8%.
- Asia Pacific is anticipated to witness the fastest growth, growing at a CAGR of 10.2% throughout the forecast period.
- Based on display type, the kiosk segment dominated the overall market, gaining a market share of 73.4% in 2022 and witnessing a CAGR of 7.2% during the forecast period.
- In terms of application, the BFSI segment is expected to dominate in 2022, gaining a market share of 25.8% and witnessing a CAGR of 8.3% during the forecast period.
- On the basis of application, the retail segment is anticipated to observe the fastest growth, growing at a CAGR of 9.1% throughout the forecast period.
Market Size & Forecast
- 2022 Market Size: USD 41.45 billion
- 2030 Projected Market Size: USD 75.06 billion
- CAGR (2023-2030): 7.8%
- North America: Largest market in 2022
The interactive or touchscreen display is a display unit that accepts user commands with the help of a finger or stylus in place of peripheral devices, such as a mouse or keyboard. Additionally, these displays include screens that project information, such as texts, images, and videos. These display screens are used in various industries, such as retail, healthcare, hospitality, and education. The market is expected to witness significant growth in the coming years, primarily owing to increasing demand for digital classrooms as well as growing adoption of these displays, such as video walls and tables. These video walls and tables are used at transit spaces/public transportation, such as railway stations and airports.

Rapidly increasing adoption of touchscreen tables as well as video walls in the hospitality and corporate sectors is expected to drive the market during the forecast period. The touchscreen table acts as a menu board to indicate the waiting time of the orders taken from the customer, along with prices and ingredients. Furthermore, the use of touchscreen tables in corporate meetings has been observed to provide a better experience for the clients as well as employees. The use of such technology in offices allows better engagement between employees, management, and clients.
Digitalization in the education sector involving the use of new technologies, such as smartphones, tablets, laptops, and touchscreen whiteboards and tables, projectors, and kiosks in classrooms, increases student engagement and makes the learning process more reciprocal, resulting in increased learning retention levels. Moreover, these displays help in maintaining a convenient communication environment that encourages group learning, participation, and creativity in the classroom, along with feedback not only between teachers and students but also among the students themselves. Besides, these display technologies permit teachers to include media, games, audio clips, and video clips in their lessons. In the past few years, student preferences have been witnessing a paradigm shift towards digital learning as it allows them to learn through relevant digital content.
Furthermore, factors such as internet penetration and changing preferences towards technology have positively influenced the adoption of touch display technologies. Additionally, the rising emphasis on gamification in the education system has boosted market growth. Gamification is considered to be an influential tool, which improves the medium of delivering lectures by incorporating lessons in the form of games and helps to develop cognitive skills and effective interaction in classrooms. Moreover, it enables the integration of 3D characters and game mechanics into effective courseware to make the learning process more reciprocal for students.
COVID-19 Impact on the Interactive display market
The COVID-19 pandemic has had a significant impact on the interactive display industry, both in the short and long term. With the shift to remote work, remote learning, and virtual meetings, the demand for interactive displays has increased as they offer an immersive and engaging way to communicate and collaborate from a distance. In the short term, the pandemic caused significant disruptions in the supply chain, which in turn led to production delays and increased costs for interactive display manufacturers. With the global spread of the pandemic, many countries implemented lockdowns and restrictions on movement, which had a significant impact on global trade and transportation. This, coupled with the closure of factories and warehouses, led to supply chain disruptions, causing delays in the delivery of raw materials and components necessary for the production of interactive displays. As a result, manufacturers were forced to either delay production or source materials at a higher cost, which ultimately increased the cost of these displays for consumers.
Furthermore, the closure of schools and offices, which are major consumers of interactive displays, led to a decline in demand for these products in those sectors. With students and workers forced to work from home, there was less need for interactive displays in classrooms and conference rooms, and more demand for personal devices such as laptops and tablets. However, the pandemic also led to an increase in demand for interactive displays in the healthcare sector. With many hospitals and clinics overwhelmed by the surge of COVID-19 patients, healthcare providers turned to telemedicine and remote patient monitoring to reduce the risk of infection and minimize in-person contact. Interactive displays have played a crucial role in enabling remote consultations, allowing doctors to assess patients from a distance and provide necessary medical care.
In the long term, the pandemic is expected to drive the adoption of interactive displays across various industries as companies and organizations adapt to a hybrid work and learning model. The education sector, in particular, is expected to see significant growth in demand for interactive displays as schools and universities invest in technology to support distance learning and hybrid learning models. Moreover, the pandemic has accelerated the trend of digitization, and interactive displays are increasingly being used for digital signage, advertising, and other applications in various industries. The rise in demand for touchless interactive displays is also expected to drive market growth as people become more conscious of hygiene and safety.
Display Type Insights
In terms of display type, the market is classified into interactive kiosk, video wall, table, display, and whiteboard. The kiosk segment dominated the overall market, gaining a market share of 73.4% in 2022 and witnessing a CAGR of 7.2% during the forecast period. An interactive kiosk is a self-contained electronic device that allows people to interact with it by using a touch screen or other input device. These kiosks can be used for a variety of purposes, such as providing information, selling products, processing transactions, or conducting surveys. The growth of this segment can be attributed to the increasing demand for reciprocal self-services in the retail, transportation, and healthcare sectors. Smart vending machines, Automated Teller Machine (ATMs), and other touch-enabled self-service solutions offer a potential way for companies to deliver good consumer service even during rush business hours. Furthermore, the increasing use of interactive kiosks in the product/service delivery business has allowed companies to deliver tailored plans at low delivery costs to their clients.
The video wall segment is anticipated to observe the fastest growth, growing at a CAGR of 11.2% throughout the forecast period. An interactive video wall typically refers to a large display, consisting of multiple screens or projectors tiled together to form a single large visual display. The display can be used to showcase various types of media, including videos, images, and animations. The segment is driven by increasing emphasis on the application of touchscreen video walls at healthcare facilities. For instance, touchscreen video walls and monitors are used to deliver key information regarding healthcare facilities and physicians to improve patient experience and service delivery. Furthermore, escalating consumer demand for enhanced resolution in such video walls, supported by pro-technology lifestyles, is driving product penetration among end users.
Application Insights
In terms of application, the market is classified into retail, hospitality, healthcare, transportation, BFSI, corporate, entertainment, education, and others. Among these, the BFSI segment is expected to dominate in 2022, gaining a market share of 25.8% and witnessing a CAGR of 8.3% during the forecast period. The BFSI industry has seen rapid growth in the adoption of interactive displays in recent years. Interactive displays are becoming more popular in the BFSI industry due to their ability to improve customer engagement, enhance the customer experience, and increase the efficiency of business operations. One of the main reasons for the growth of interactive displays in BFSI is the increasing demand for digital transformation. With the rise of digital banking and online transactions, customers are looking for more convenient and user-friendly ways to interact with their financial institutions. Interactive displays provide an intuitive and engaging interface for customers to navigate through banking services and products, making the customer experience more enjoyable and personalized.

The retail segment is anticipated to observe the fastest growth, growing at a CAGR of 9.1% throughout the forecast period. Demand for touch-enabled displays is anticipated to increase in the retail sector over the coming years owing to the growing trend of touch-based devices and increased usage of the interactive kiosk and table. For instance, several big retail store chains, such as Walmart, have started to use kiosks to display products, along with their pricing and specifications, thereby easing the in-store experience of the customers. The retail segment is expected to offer strong growth opportunities for all market players, supported by an increasing number of commercial spaces, such as shopping complexes and malls, across the globe. At retail stores, interactive video walls allow users to verify the availability of stock at a specific location and browse through the store’s inventory. Other than retail, these walls also offer an improved museum experience by covering numerous walls of a museum room with several video wall screens. This helps the conversion of museum rooms into immersive virtual spaces, thereby enhancing the viewer’s experience.
Regional Insights
The North America region led the overall market in 2022, with a market share of 40.8% Interactive displays have gained significant popularity in North America over the last decade, thanks to the growing demand for immersive and engaging technologies in various industries. The rise of interactive displays has been fueled by advancements in touch technology, which has enabled users to interact with displays more intuitively and efficiently. The market for interactive displays has been growing rapidly in North America, with many businesses, educational institutions, and government agencies adopting the technology to enhance their communication and collaboration capabilities. One of the primary drivers of the growth of interactive displays in North America is the education sector. Many schools and universities in the region have been adopting interactive displays to enhance classroom engagement and improve learning outcomes. Interactive displays enable teachers to deliver more engaging lessons, facilitate collaborative learning, and provide more effective feedback to students. They also enable students to participate more actively in the learning process, encouraging higher levels of engagement and retention.

Asia Pacific is anticipated to witness the fastest growth, growing at a CAGR of 10.2% throughout the forecast period. Interactive displays have seen tremendous growth in Asia Pacific in recent years, driven by increasing demand from various sectors such as education, corporate, and healthcare. The Asia Pacific region is home to some of the fastest-growing economies in the world, and the adoption of interactive displays is driven by factors such as technological advancements, increasing investments in education, and growing demand for interactive communication tools. The adoption of interactive displays has been particularly strong in countries such as China, Japan, and South Korea, which are home to some of the world's largest technology companies. These countries have been at the forefront of technological innovation, and their investments in research and development have resulted in the development of some of the most advanced interactive display technologies in the world. As a result, these countries have emerged as major exporters of interactive display technology, catering to the growing demand from other countries in the region and beyond.
Key Companies & Market Share Insights
The interactive display market is fragmented and is anticipated to witness competition due to several players' presence. Major service providers in the market are constantly upgrading their technologies to stay ahead of the competition and to ensure efficiency, integrity, and safety. These players focus on partnership, product upgrades, and collaboration to gain a competitive edge over their peers and capture a significant market share. In February 2023, SMART Technologies unveiled its latest interactive displays designed for educational purposes at the TCEA Convention & Exposition held in San Antonio, Texas in 2023. The newest release comprises the SMART Board GX (V2) series and the SMART Board MX (V4) series. With this launch, these new displays are part of the SMART Board 6000S as the first interactive displays that enable multiple users to write, erase, and gesture simultaneously, on any platform and application. Some of the prominent players in the global interactive display market include:
-
Box Light corporation
-
eyefactive GmbH
-
HORIZON DISPLAY INC.
-
IDEUM
-
LG Display Co.
-
Marvel Technology (China) Co.,Ltd
-
MMT GmbH & Co. KG.
-
Panasonic Corporation
-
SHARP CORPORATION
-
TableConnect
Interactive Display Market Report Scope
Report Attribute
Details
Market size value in 2023
USD 44.33 billion
Revenue forecast in 2030
USD 75.06 billion
Growth Rate
CAGR of 7.8% from 2023 to 2030
Historic year
2017 - 2021
Base year for estimation
2022
Forecast period
2023 - 2030
Report updated
May 2023
Quantitative units
Revenue in USD Billion and CAGR from 2023 to 2030
Report coverage
Revenue forecast, company ranking, competitive landscape, growth factors, and trends
Segments covered
Display type, application, region
Regional scope
North America; Europe; Asia-Pacific; Latin America; Middle East & Africa
Country scope
U.S.; Canada; Germany; UK; France; China; India; Japan; Mexico; Brazil
Key companies profiled
Box Light corporation; eyefactive GmbH; HORIZON DISPLAY INC.; IDEUM; LG Display Co.; Marvel Technology (China) Co.,Ltd; MMT GmbH & Co. KG.; Panasonic Corporation; SHARP CORPORATION; TableConnect
Customization scope
Free report customization (equivalent up to 8 analysts working days) with purchase. Addition or alteration to country, regional & segment scope.
Pricing and purchase options
Avail customized purchase options to meet your exact research needs. Explore purchase options
Global Interactive Display Market Report Segmentation
This report forecasts revenue growths at global, regional, and country levels and provides an analysis of the industry trends in each of the sub-segments from 2017 to 2030. For this study, Grand View Research has segmented the global Interactive display market based on display type, application, and region.

-
Display Type Outlook (Revenue, USD Billion, 2017 - 2030)
-
Interactive Kiosk
-
Interactive Video Wall
-
Interactive Table
-
Interactive Monitor
-
Interactive Whiteboard
-
-
Application Outlook (Revenue, USD Billion, 2017 - 2030)
-
Retail
-
Hospitality
-
Healthcare
-
Transportation
-
BFSI
-
Corporate
-
Entertainment
-
Education
-
Others
-
-
Regional Outlook (Revenue, USD Billion, 2017 - 2030)
-
North America
-
U.S.
-
Canada
-
-
Europe
-
U.K.
-
Germany
-
France
-
-
Asia Pacific
-
China
-
India
-
Japan
-
-
Latin America
-
Brazil
-
Mexico
-
-
Middle East & Africa
-
Frequently Asked Questions About This Report
The global interactive display market size was estimated at USD 41.45 billion in 2022 and is expected to reach USD 44.33 billion in 2023.
The global interactive display market is expected to grow at a compound annual growth rate of 7.8% from 2023 to 2030 to reach USD 75.06 billion by 2030.
North America dominated the interactive display market with a share of 40.8% in 2022. This is attributable to the presence of large number of touch table solution providers and increasing adoption of interactive technologies among restaurants in countries including Canada & the U.S.
Some key players operating in the interactive display market include Panasonic Corporation; HORIZON DISPLAY LLC; LG Display Co.; IDEUM; MARVEL TECHNOLOGY (CHINA) CO., LTD; SHARP CORPORATION; Box Light corporation; eyefactive GmbH; and TableConnect.
Key factors that are driving the market growth include the increasing demand for digital classrooms as well as the growing adoption of interactive displays such as video walls and tables.
About the Author(s)
Display Technologies Research Team
Semiconductors & Electronics · Display TechnologiesThis report was authored by the display technologies research team at Grand View Research - comprising two research analysts, one senior research analyst, and one industry expert - with specialized expertise in the display technologies segment of the semiconductors & electronics industry. All findings are based on proprietary semiconductors & electronics databases, executive interviews, and regulatory analysis, subject to internal peer review prior to publication.
Last Updated:
Speak to Analyst


Need a Tailored Report?
Customize this report to your needs — add regions, segments, or data points, with 20% free customization.
Or view our licence options:

ISO 9001:2015 & 27001:2022 Certified
We are GDPR and CCPA compliant! Your transaction & personal information is safe and secure. For more details, please read our privacy policy.


