- Home
- »
- Next Generation Technologies
- »
-
Spatial Computing Market Size, Share & Trends Report, 2030GVR Report cover
![Spatial Computing Market Size, Share & Trends Report]()
Spatial Computing Market (2023 - 2030) Size, Share & Trends Analysis Report By Solution (Hardware Devices, Software, Services), By Technology, By End-Use, By Region, And Segment Forecasts
- Report ID: GVR-4-68040-118-7
- Number of Report Pages: 145
- Format: PDF
- Historical Range: 2018 - 2021
- Forecast Period: 2023 - 2030
- Industry: Technology
- Report Summary
- Table of Contents
- Interactive Charts
- Methodology
- Download FREE Sample
-
Download Sample Report
Spatial Computing Market Summary
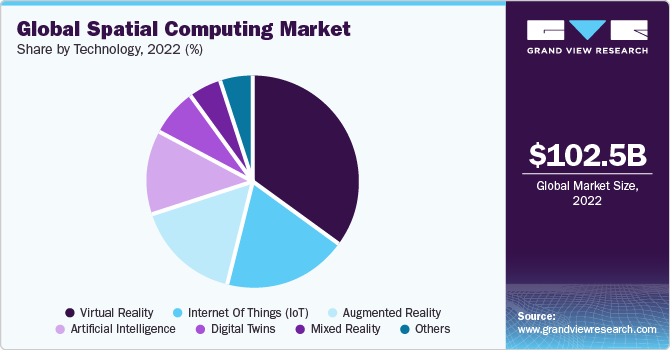
The global spatial computing market size was estimated at USD 102.5 billion in 2022 and is projected to reach USD 469.8 billion by 2030, growing at a CAGR of 20.4% from 2023 to 2030. The market has witnessed significant growth, driven by increasing demand for immersive experiences, technological advancements, growing adoption across industries, advancement in hardware and software infrastructure, and investment and funding in technology startups.
Key Market Trends & Insights
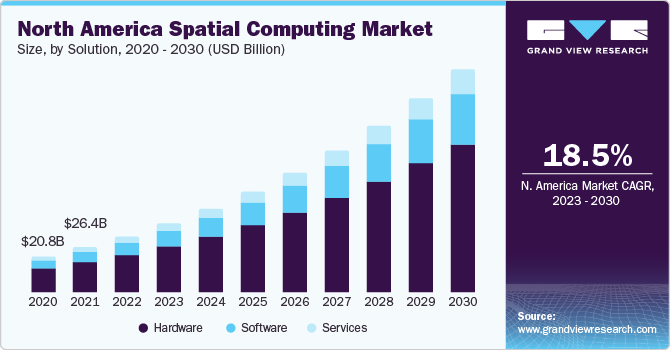
- North America accounted for the highest market share of over 30.0% in 2022.
- Asia Pacific is anticipated to record a significant CAGR of around 22.0% from 2023 to 2030.
- By solution, the hardware devices solution segment accounted for the largest market share of over 65.0% in 2022.
- By technology, the augmented reality technology segment accounted for a substantial market share of over 20.5% in 2022.
- By end use, the healthcare end-use segment accounted for a significant market share of over 10.0% in 2022.
Market Size & Forecast
- 2022 Market Size: USD 102.5 Billion
- 2030 Projected Market Size: USD 469.8 Billion
- CAGR (2023-2030): 20.4%
- North America: Largest market in 2022
The market has applications in various industries, including gaming, entertainment, healthcare, education, retail, and more. Industries are leveraging computing to enhance customer experiences, improve training and simulation, streamline design and prototyping processes, enable remote collaboration, and unlock new business opportunities.Technology is transforming how we interact with digital content and the physical world, combining augmented, virtual, and mixed reality. This technology enables users to seamlessly blend the digital and physical realms, enhancing human-computer interaction and creating immersive experiences. Immersive experiences are the core of the technology, it enable users to engage with digital content more naturally and intuitively, fostering a sense of presence and immersion. It is exploring virtual worlds, interacting with virtual objects, or visualizing data in 3D space; it provides a level of immersion unparalleled by traditional computing interfaces.

The trend towards more immersive experiences drives the development of advanced tracking technologies, improved display, resolutions, and realistic rendering techniques. The technology brings together the capabilities of AR, VR, and MR, blurring the lines between these technologies. AR overlays digital information onto the real world, enhancing the user's perception of reality. VR creates fully immersive virtual environments that transport users to different realms. MR combines virtual objects with the real world, allowing for interactive and contextual experiences. The convergence of these technologies enables seamless transitions between virtual and real-world elements, creating a spectrum of experiences and expanding the possibilities for spatial computing applications.
Solution Insights
The hardware devices solution segment accounted for the largest market share of over 65.0% in 2022. The market has experienced significant growth during the forecast period, and hardware devices have played a crucial role in driving this growth. It refers to technologies enabling the interaction between the physical and digital worlds in real time, creating immersive user experiences. Head-mounted displays such as virtual reality headsets and augmented reality glasses have been instrumental in the market's growth.
These devices provide users with immersive visual experiences by overlaying digital content in the real world or creating an entirely virtual environment. Beyond HMDs and motion controllers, wearable devices like smartwatches, fitness trackers, and even clothing embedded with sensors can contribute to the spatial computing ecosystem. These devices can capture users' biometric data, such as heart rate and body movements, providing additional inputs for computing applications and enabling personalized experiences.
The software solution segment is expected to grow at a significant CAGR of over 20.0% over the forecast period. In addition to hardware devices, software solutions play a crucial role in the market's growth as these software solutions enable the development and deployment of immersive and interactive experiences in virtual reality, augmented reality, and mixed reality. Content creation tools are software applications that allow developers, designers, and artists to create these experiences.
These tools include 3D modeling and animation software, game engines, and authoring platforms designed to create VR, AR, and MR content. Examples include Unity, Unreal Engine, Blender, and Adobe Creative Studio. Development frameworks and software development kits provide developers with the tools and libraries to build technological applications. These frameworks and SDKs often include 3D rendering, physical simulation, input management, and spatial tracking features. Popular examples include ARCore and ARKit for AR development, OpenVR and SteamVR for VR development, and Microsoft Mixed Reality Toolkit for MR development.
Technology Insights
The augmented reality technology segment accounted for a substantial market share of over 20.5% in 2022. AR enhances the real-world environment by overlaying digital information, such as 3D objects, images, video, or textual data, onto the user's view, typically through mobile devices or AR glasses. The widespread adoption of smartphones and tablets with advanced cameras and sensors has made AR accessible to a broad user base.

Mobile AR applications, such as games, social media filters, and utility apps, have gained significant popularity, driving the growth of the AR market. Dedicated AR glasses offer a hands-free and immersive AR experience, enabling users to overlay digital content seamlessly onto their field of view. Technologies and miniaturization have led to the development of lightweight and more visually appealing AR glasses. Industries players like Microsoft (HoloLens), Google (Google Glass), and Apple (VisionPro) are investing in AR glasses, further propelling the growth of the market.
The mixed reality segment is expected to grow at a significant CAGR of over 23.0% over the forecast period. Mixed reality combines virtual and augmented reality elements to create immersive and interactive experiences that seamlessly blend virtual content with the real world. MR technology offers a high level of immersion by overlaying visual objects onto the real world in a realistic and interactive way.
This creates a sense of presence and allows users to interact with virtual content more naturally and intuitively. Anchoring virtual objects to the physical environment and maintaining spatial consistency contributes to a more convincing and immersive experience. MR technology finds applications across various industries, driving its growth in the market.
End-Use Insights
The healthcare end-use segment accounted for a significant market share of over 10.0% in 2022. The healthcare segment is experiencing significant growth in adopting spatial computing technologies. Spatial computing, including virtual, augmented, and mixed reality, offers various applications and benefits in healthcare, as it provides an immersive and realistic training environment for healthcare professionals, enabling them to practice complex procedures and scenarios in a safe and controlled virtual environment.
VR and MR simulations offer hands-on experiences for surgical training, patient examination, and medical interventions, allowing healthcare practitioners to enhance their skills and knowledge without risking patient safety. This technology assists in surgical planning and guidance by allowing surgeons to visualize patient-specific anatomical data in a 3D virtual environment; by utilizing AR or MR headsets, surgeons can overlay medical imaging data, such as CR scans or MRI images, onto the patient's body during the procedure. This helps improve precision reduce risks, and enhance surgical outcomes.
AEC end-use segment is anticipated to grow with a significant CAGR of around 21.0% during the forecast period of 2023-2030. This technology provides immersive and interactive visualization capabilities that enhance the design review process. VR and MR allow architects, engineers, and stakeholders to experience 3D models and walkthroughs of buildings and structures before construction. This immersive visualization helps identify design issues, evaluate spatial relationships, and make informed decisions early in the design process, reducing errors and costly revisions.
Regional Insights
North America accounted for the highest market share of over 30.0% in 2022. The region is a key hub for technological innovation, research and development, and market adoption of spatial computing technologies. The region is home to many leading companies and research institutions that drive advancements in the market. Companies like Microsoft, Google, Apple, Facebook, and Magic Leap have been at the forefront of developing spatial computing hardware devices, software solutions, and platforms.

These advancements have fueled the market's growth by offering cutting-edge products and experiences. The region has a robust startup ecosystem, particularly in technology hubs like Silicon Valley, Seattle, and Greater Boston. Startups focused on technology have emerged and gained traction, bringing fresh ideas, innovations, and competition to the market. These startups often push the boundaries of these technological applications, creating new use cases and driving market growth.
Asia Pacific is anticipated to record a significant CAGR of around 22.0% from 2023 to 2030. Asia Pacific is a diverse and rapidly expanding market with a large population, strong technological advancement, and increasing adoption of digital technologies. The region has rapidly adopted smart devices, including smartphones, tablets, and wearable devices. These devices serve as the primary platforms for accessing spatial computing experiences. The growing penetration of smart devices in countries like China, India, Japan, and South Korea has created a significant user base for computing devices.
Key Spatial Computing Company Insights
The key players in the spatial computing market have seen significant growth and transformation in recent years. The rapidly growing market encompasses technologies such as augmented reality, virtual reality, mixed reality, and other related areas. The market is still evolving; several key companies, such as Apple Inc. Microsoft Corporation, Google LLC, and Magic Leap, among others, play a significant role in driving innovation and shaping its development. These companies represent a range of key players in the market, each contributing to the advancement and growth of the industry through their technologies, products, and partnerships.
In June 2023, Apple Inc. launched Vision Pro, a spatial computing device that uses the M2 and R2 chipset for streaming images to the display within 12 milliseconds for a virtual, lag-free, real-time view of the world. Its unique dual‑chip design enables the spatial experiences on Vision Pro. The powerful M2 chip simultaneously runs visionOS, executes advanced computer vision algorithms, and delivers stunning graphics, all with incredible efficiency.
Key Spatial Computing Companies:
The following are the leading companies in the spatial computing market. These companies collectively hold the largest market share and dictate industry trends. Financials, strategy maps & products of these spatial computing companies are analyzed to map the supply network.
- Apple Inc.
- Avegant Corporation
- Blippar
- DAQRI
- Google LLC
- HTC Corporation
- Lenovo Group Limited
- Magic Leap Inc.
- Marxent
- Microsoft Corporation
- NVIDIA Corporation
- Oculus (Face Reality Labs_
- PTC
- Qualcomm Technologies Inc.
- Seiko Epson Corporation
- Sony Group Corporation
- Unity Software Inc.
- Vuzix
- Zappar Ltd.
Spatial Computing Market Report Scope
Report Attribute
Details
Market size value in 2023
USD 128.2 billion
Revenue forecast in 2030
USD 469.8 billion
Growth rate
CAGR of 20.4% from 2023 to 2030
The base year for estimation
2022
Historical data
2018 - 2021
Forecast period
2023 - 2030
Quantitative units
Revenue in USD Billion and CAGR from 2023 to 2030
Report Coverage
Revenue forecast, company ranking, competitive landscape, growth factors, and trends
Segments Covered
Solution, technology, end-use, region
Regional Scope
North America; Europe; Asia Pacific; Latin America; Middle East & Africa
Country scope
U.S.; Canada; Germany; U.K.; France; Italy; Spain; Benelux; Nordic Countries; China; Japan; India; South Korea; Australia; Brazil; Mexico; UAE; Saudi Arabia; South Africa
Key companies profiled
Apple Inc.; Avegant Corporation; Blippar; DAQRI; Google LLC; HTC Corporation; Lenovo Group Limited; Magic Leap Inc.; Marxent; Microsoft Corporation; NVIDIA Corporation; Oculus (Facebook Reality Labs); PTC; Qualcomm Technologies Inc.; Seiko Epson Corporation; Sony Group Corporation; Unity Software Inc.; Vuzix; Zappar Ltd.
Customization scope
Free report customization (equivalent to 8 analysts working days) with purchase. Addition or alteration to country, regional & segment scope.
Pricing and purchase options
Avail customized purchase options to meet your exact research needs. Explore purchase options
Global Spatial Computing Market Report Segmentation
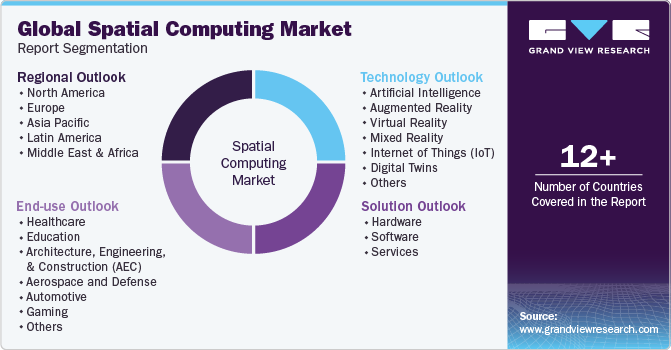
This report forecasts revenue growth at regional levels and analyzes the latest industry trends in each sub-segment from 2018 to 2030. For this study, Grand View Research has segmented the spatial computing market report based on solution, technology, end-use, and region:

-
Solution Outlook (Revenue, USD Billion, 2018 - 2030)
-
Hardware Devices
-
Software
-
Services
-
-
Technology Outlook (Revenue, USD Billion, 2018 - 2030)
-
Artificial Intelligence
-
Augmented Reality
-
Virtual Reality
-
Mixed Reality
-
Internet of Things (IoT)
-
Digital Twins
-
Others
-
-
End-Use Outlook (Revenue, USD Billion, 2018 - 2030)
-
Healthcare
-
Education
-
Architecture, Engineering, and Construction (AEC)
-
Aerospace and Defense
-
Automotive
-
Gaming
-
Consumer Electronics
-
Government and Public Sector
-
Information Technology
-
Energy and Utilities
-
Others
-
-
Region Outlook (Revenue, USD Billion, 2018 - 2030)
-
North America
-
U.S.
-
Canada
-
-
Europe
-
Germany
-
UK
-
France
-
Italy
-
Spain
-
Benelux
-
Nordic Countries
-
-
Asia Pacific
-
China
-
India
-
Japan
-
South Korea
-
Australia
-
-
Latin America
-
Brazil
-
Mexico
-
-
Middle East and Africa
-
UAE
-
Saudi Arabia
-
South Africa
-
-
Frequently Asked Questions About This Report
b. The global spatial computing market size was estimated at USD 102.5 billion in 2022 and is expected to reach USD 128.2 billion in 2023.
b. The global spatial computing market is expected to grow at a compound annual growth rate of 20.4% from 2023 to 2030 to reach USD 469.8 billion by 2030.
b. Asia Pacific captured the revenue share of nearly 33% in 2022 owing to growing adoption of augmented reality and virtual reality coupled with increased investments in metaverse in the region.
b. The key players in this spatial computing market include Apple Inc., HTC Corporation, Lenovo Group Limited, Magic Leap Inc., Microsoft Corporation, NVIDIA Corporation, Oculus (Facebook Reality Labs), PTC, Qualcomm Technologies Inc., Seiko Epson Corporation, Sony Group Corporation, Unity Software Inc., and Vuzix, among others.
b. Key factors boosting the growth of the spatial computing market include increasing demand for immersive experiences, advancements in AR and VR technology in addition to widespread adoption of AR and VR across various industries, advancement in hardware and software infrastructure, and investment and funding in technology startups among others.
Share this report with your colleague or friend.
Need a Tailored Report?
Customize this report to your needs — add regions, segments, or data points, with 20% free customization.

ISO 9001:2015 & 27001:2022 Certified
We are GDPR and CCPA compliant! Your transaction & personal information is safe and secure. For more details, please read our privacy policy.
Trusted market insights - try a free sample
See how our reports are structured and why industry leaders rely on Grand View Research. Get a free sample or ask us to tailor this report to your needs.


