GVR Report cover Augmented Reality Market Size, Share & Trends Report

Augmented Reality Market Size, Share & Trends Analysis Report By Component (Hardware, Software), By Display (Head-Mounted Display, Smart Glass), By Application (Aerospace & Defense, Gaming & Entertainment), By Region, And Segment Forecasts, 2025 - 2030

  • Report ID: 978-1-68038-820-6
  • Number of Report Pages: 150
  • Format: PDF, Horizon Databook
  • Historical Range: 2018 - 2023
  • Forecast Period: 2025 - 2030 
  • Industry: Technology

Augmented Reality Market Size & Trends

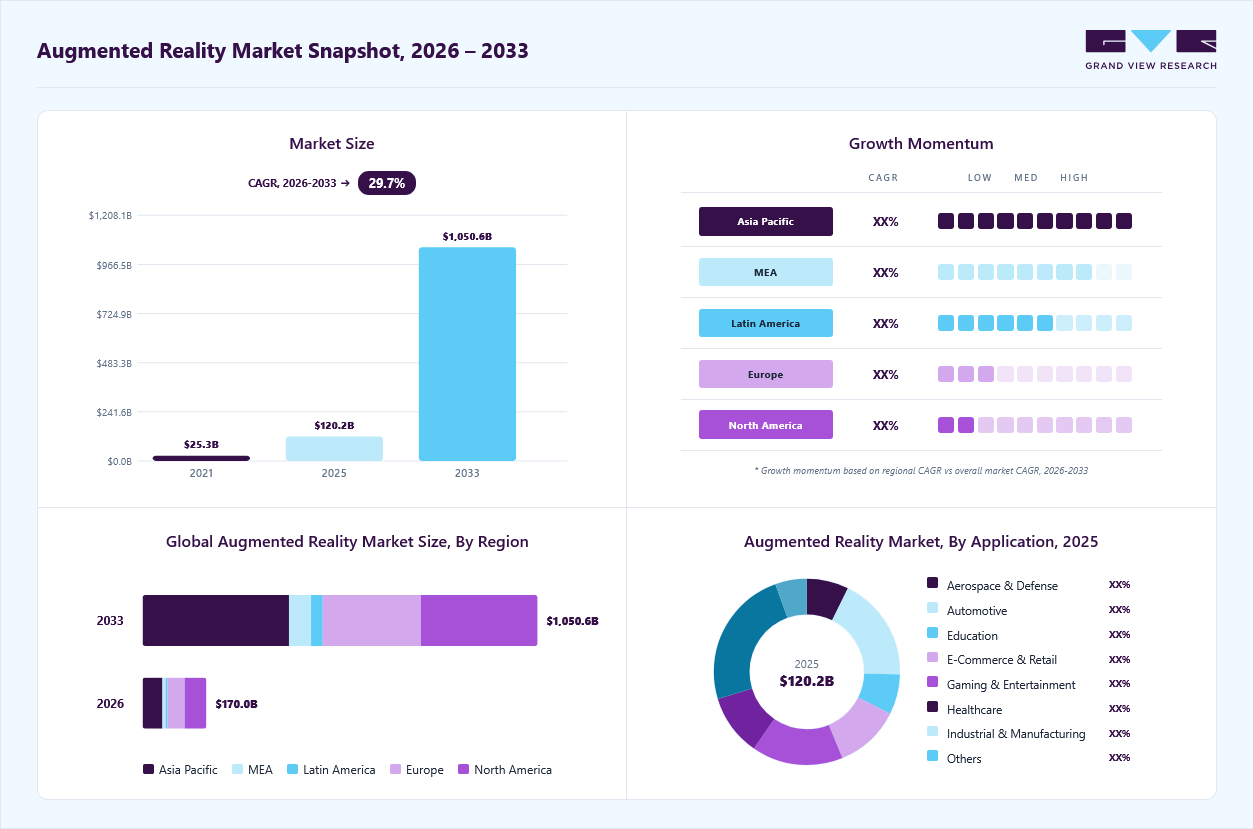
The global augmented reality market size was estimated at USD 83.65 billion in 2024 and is expected to grow at a CAGR of 37.9% from 2025 to 2030. The market growth is primarily driven by the growing technological advancements in augmented reality (AR) hardware and software. Enhanced processing power, better graphics, and the integration of artificial intelligence (AI) have enabled more realistic and immersive AR experiences, thereby driving innovation and popularity of augmented reality experiences across various industries. Furthermore, companies are leveraging AR for applications such as virtual try-ons, 3D mapping, and interactive gaming, driving increased adoption across industries, which is expected to further fuel the market growth in the coming years.

Augmented Reality Market Size, By Component, 2020 - 2030 (USD Billion)

The retail and e-commerce industry are increasingly adopting AR to enhance customer experiences. The growing popularity of virtually trying on products through AR, previewing furniture in their homes, or visualizing how items will look in real-world settings before purchasing. This immersive shopping experience helps increase consumer engagement and boosts sales, propelling the AR market growth.

In addition, the expansion of AR being utilized for medical training, surgical visualization, and patient care, is enhancing the precision and effectiveness of medical procedures. Companies are actively developing AR tools to assist in complex surgeries and to train medical professionals, which significantly boosts the demand for AR solutions in this field, which is further driving the market growth.

Furthermore, the growing prevalence of mobile devices equipped with AR capabilities has transformed how consumers interact with digital content. Mobile AR applications allow users to engage with products and services in real time, creating personalized experiences that enhance consumer satisfaction. This trend is expected to grow in the coming years, further accelerating the market expansion.

Moreover, the increasing collaborations between technology providers and various industries are fostering innovation in AR applications. These partnerships enable companies to leverage each other's strengths to develop unique solutions tailored to specific market needs. For instance, collaborations between AR firms and educational institutions are enhancing learning experiences through immersive technologies, while partnerships in retail are revolutionizing customer engagement strategies.

Component Insights

The hardware segment accounted for the largest market share of over 58% in 2024, owing to the rising adoption of AR headsets, smart glasses, and displays across industries such as education, gaming & entertainment, and manufacturing. These devices are critical for delivering immersive experiences in areas like remote assistance, real-time training, and virtual simulations. The surge in demand for high-quality AR hardware in gaming & entertainment and aerospace & defense is also contributing significantly to the segmental growth. Additionally, advancements in hardware technologies, such as improved optics, processors, and sensors, are driving the adoption of AR devices across professional and consumer applications. 

The software segment is expected to witness the fastest CAGR from 2025 to 2030, driven by the growing need for AR applications that enhance user experience across various sectors, such as retail, and education. Cloud-based AR solutions, coupled with the increasing demand for AR app development platforms, are further driving the software segment. Moreover, the growing interest in AR for enterprise applications, including workflow optimization and remote collaboration, is fueling the expansion of AR software offerings.

Display Insights

The head mounted segment dominated the market in 2024, owing to its widespread adoption across industries such as Education, defense, and manufacturing. Head-mounted displays (HMDs) are integral for immersive training, simulations, and real-time problem-solving, making them essential in sectors where hands-free operation and enhanced situational awareness are crucial. The surge in demand for AR-based Gaming & Entertainment, Aerospace & Defense, and the growing use of HMDs in remote assistance and maintenance further propelled the market. Technological advancements in optics, lightweight designs, and improved comfort also made HMDs more appealing for long-duration use, contributing to their segmental growth.

Augmented Reality Market Share, By Display, 2024 (%)

The smart glasses segment is expected to witness the fastest CAGR from 2025 to 2030, driven by the increasing adoption in enterprise applications, particularly in logistics, manufacturing, and education, where real-time data overlay and hands-free navigation improve efficiency. Smart glasses are increasingly used for remote collaboration, enabling experts to guide field technicians without being on-site. Consumer demand is also rising, with smart glasses offering augmented navigation, fitness tracking, and virtual assistants. Additionally, advancements in miniaturization, improved battery life, and integration with AI and IoT systems have made smart glasses more practical and versatile, driving their adoption across various sectors, and thereby driving the segmental growth.

Application Insights

The industrial & manufacturing segment in the market dominated the market in 2024. This growth can be attributed to the growing use of AR for enhancing productivity, training, and operational efficiency. AR applications in this sector, such as real-time equipment maintenance, remote assistance, and assembly line monitoring, have been proven to reduce downtime and improve worker performance. The ability to overlay digital information on physical environments allows manufacturers to optimize workflows, minimize errors, and improve safety. With Industry 4.0 initiatives and smart factory adoption rising, AR has become a critical tool in modern manufacturing, further solidifying its dominance in this segment.

The healthcare segment is anticipated to record the fastest growth from 2025 to 2030, driven by the increasing integration of AR in medical training, diagnostics, and surgery. AR is being used for advanced visualization in complex surgeries, helping surgeons perform minimally invasive procedures with greater precision. In medical education, AR offers immersive training solutions, allowing students to interact with 3D models of human anatomy. Additionally, the rise of AR-based telemedicine and remote assistance tools for diagnostics and patient care is fueling growth. The ongoing innovations in AR applications for rehabilitation, mental health, and patient engagement are also key factors driving this rapid expansion.

Regional Insights

The augmented reality market in North America accounted for the highest revenue share of over 33% in 2024, driven by technological advancements, the strong presence of AR startups, and major investments in research and development. The rise of industries such as Gaming & Entertainment, retail, and Education utilizing AR to enhance customer experience and improve training and diagnostics has led to increasing demand.

Augmented Reality Market Trends, by Region, 2025 - 2030

U.S. Augmented Reality Market Trends

The augmented reality market in the U.S. held a dominant position in 2024, fueled by the growing integration of AR in mobile applications, gaming & entertainment, and aerospace & defense, led by companies such as Apple, Inc. and Google LLC. The demand for AR in Education for enhanced medical training and remote assistance is also on the rise. The U.S. Department of Defense’s increasing use of AR for training and simulations contributes significantly to market expansion. Additionally, the rapid growth of AR in e-commerce and retail, where virtual try-on solutions are becoming mainstream, further propels the market. Consumer demand for immersive experiences continues to shape innovation in this space.

Europe Augmented Reality Market Trends

The European augmented reality market was identified as a lucrative region in 2024. The market growth is primarily driven by the strong demand from industries such as gaming & entertainment, education, and manufacturing. Companies in Germany, France, and the UK are leveraging AR to enhance operational efficiency and product design. Additionally, Europe's burgeoning focus on the metaverse and immersive technologies accelerates growth in the aerospace & defense and media sectors.

The UK augmented reality market is expected to grow rapidly in the coming years. The UK has a vibrant ecosystem of startups focusing on AR applications in gaming, retail, and education. This entrepreneurial environment fosters creativity and technological advancements, further driving the market growth in the country.

The augmented reality market in Germany held a substantial revenue share in 2024. In Germany, AR technology is increasingly adopted across various sectors, including manufacturing, automotive, and healthcare. The focus is on enhancing productivity and training through immersive experiences, which is expected to drive market growth in the coming years.

Asia Pacific Augmented Reality Market Trends

The augmented reality market in the Asia Pacific region is expected to grow at the highest CAGR of over 41% from 2025 to 2030. In Asia Pacific, the AR market is fueled by rapid digital transformation. The region is a manufacturing hub where AR is used to streamline production processes and train workers more efficiently. The widespread use of smartphones and government initiatives promoting AR in education, and retail are key growth drivers in the region. Moreover, Asia Pacific's robust gaming & entertainment culture, along with rising demand for AR-based mobile gaming & entertainment and virtual social platforms, continues to stimulate market growth.

The Japan augmented reality market is expected to grow rapidly in the coming years, driven by the growing focus on enhancing user experiences through immersive technologies across various industries, including gaming, retail, and education. Furthermore, Japan's emphasis on advanced manufacturing and robotics complements the development of AR technologies, driving innovation and adoption

The augmented reality market in China held a substantial market share in 2024, driven by rapid technological advancements and strong government support. The rise of affordable and innovative AR devices, such as smart glasses from companies, has significantly contributed to this growth, alongside increasing applications in sectors like healthcare and entertainment.

Key Augmented Reality Company Insights

Some of the key players operating in the market include Apple, Inc. and Microsoft Corporation, among others.

  • Apple, Inc. is one of the key players in the augmented reality (AR) market, leveraging its extensive ecosystem of hardware, software, and services. The company’s AR capabilities are embedded within its devices, including iPhones, iPads, and the newly launched Vision Pro headset, through its ARKit platform. The company has been heavily investing in AR technologies, focusing on creating seamless, user-friendly AR experiences that integrate with its broader product ecosystem. Apple's vision of AR is geared towards enhancing user experiences through intuitive interaction and real-world applications.

  • Google LLC is a technology company that plays a significant role in the augmented reality (AR) market through its innovative AR platform, ARCore, which utilizes advanced technologies such as environmental understanding, motion tracking, and light estimation to seamlessly blend digital content with the real world. The company has also been involved in various partnerships and initiatives aimed at enhancing user engagement through AR applications across different sectors, including retail and education.

Lenovo Group and Snap, Inc. are some of the emerging market participants in the market.

  • Lenovo Group is an emerging player in the augmented reality (AR) market, with a focus on developing AR solutions for both consumer and enterprise applications. The company offers its AR devices through the ThinkReality platform, which includes the ThinkReality A3 smart glasses designed for productivity, remote collaboration, and real-time data access. Lenovo’s AR products are particularly aimed at enhancing workforce efficiency in industries such as manufacturing, logistics, and Education by providing hands-free, immersive experiences.

  • Snap, Inc., known for its popular social media platform Snapchat, is a prominent emerging player in the augmented reality market, focusing on consumer-driven AR experiences. The company pioneered AR filters and lenses on Snapchat, allowing users to interact with digital elements overlaid on real-world environments. Snap has expanded its AR capabilities with the launch of Spectacles, smart glasses designed to deliver immersive AR experiences. The company is heavily investing in AR for advertising and e-commerce, offering AR tools to brands for creating engaging, interactive campaigns. Snap’s AR strategy is centered on enhancing user engagement and making AR accessible to the broader consumer market.

Key Augmented Reality Companies:

The following are the leading companies in the augmented reality market. These companies collectively hold the largest market share and dictate industry trends.

  • Apple, Inc.
  • Blippar Limited
  • Google LLC
  • Lenovo Group
  • Magic Leap, Incorporated
  • Meta Platforms, Inc.
  • PTC Inc.
  • Snap, Inc.
  • Sony Corporation
  • TeamViewer AG
  • Vuzix Corporation
  • Wikitude GmbH
  • Xiaomi Corporation
  • Zappar Limited

Recent Developments

  • In September 2024, Meta Platforms, Inc. introduced Orion, its first true augmented reality glasses, which are designed to blend digital content seamlessly with the real world. These lightweight glasses come equipped with high-resolution displays and advanced sensors that allow users to interact with virtual elements in their environment. Orion aims to enhance various everyday experiences, including navigation, communication, and gaming, showcasing Meta's dedication to creating immersive technologies that connect the physical and digital worlds.

  • In May 2024, Google LLC announced exciting advancements in augmented reality (AR) at its I/O event, highlighting new geospatial AR features that enhance user interaction and content discovery. The company introduced a pilot program that allows users to access AR content directly through Google Maps, where over a billion users can explore immersive experiences by searching for locations and activating AR features using their mobile devices.

  • In January 2024, Sony Corporation announced the development of an immersive spatial content creation system that includes an XR head-mounted display featuring high-quality 4K OLED Microdisplays and a video see-through function, along with specialized controllers for intuitive interaction with 3D objects.

Augmented Reality Market Report Scope

Report Attribute

Details

Market size value in 2025

USD 120.29 billion

Revenue forecast in 2030

USD 599.59 billion

Growth rate

CAGR of 37.9% from 2025 to 2030

Base year for estimation

2024

Historical data

2018 - 2023

Forecast period

2025 - 2030

Quantitative units

Revenue in USD million/billion and CAGR from 2025 to 2030

Report Coverage

Revenue forecast, company ranking, competitive landscape, growth factors, and trends

Segments covered

Component, display, application, regional

Regional scope

North America; Europe; Asia Pacific; Latin America; Middle East & Africa

Country scope

U.S.; Canada; Mexico; UK; Germany; France; China; Australia; Japan; India; South Korea; Brazil; South Africa; Saudi Arabia; UAE

Key companies profiled

Apple, Inc.; Blippar Limited; Google LLC; Lenovo Group; Magic Leap; Incorporated; Meta Platforms, Inc.; PTC Inc.; Snap, Inc.; Sony Corporation; TeamViewer AG; Vuzix Corporation; Wikitude GmbH; Xiaomi Corporation; Zappar Limited

Customization scope

Free report customization (equivalent to up to 8 analyst’s working days) with purchase. Addition or alteration to country, regional & segment scope.

Pricing and purchase options

Avail customized purchase options to meet your exact research needs. Explore purchase options

Global Augmented Reality Market Report Segmentation

This report forecasts revenue growth at global, regional, and country levels and provides an analysis of the latest industry trends in each of the sub-segments from 2018 to 2030. For this study, Grand View Research has segmented the global augmented reality market report based on component, display, application, and region:

Global Augmented Reality Market Report Segmentation

  • Component Outlook (Revenue, USD Million, 2018 - 2030)

    • Hardware

    • Software

  • Display Outlook (Revenue, USD Million, 2018 - 2030)

    • HMD (Head-Mounted Display)

    • Smart Glass

      • Cinema Display Glasses

      • XR Glasses

    • Head-up Display (HUD)

    • Handheld Devices

  • Application Outlook (Revenue, USD Million, 2018 - 2030)

    • Aerospace & Defense

    • Gaming & Entertainment

    • Education

    • E-Commerce & Retail

    • Gaming & Entertainment

    • Education

    • Industrial & Manufacturing

    • Others

  • Regional Outlook (Revenue, USD Million, 2018 - 2030)

    • North America

      • U.S.

      • Canada

      • Mexico

    • Europe

      • UK

      • Germany

      • France

    • Asia Pacific

      • China

      • Australia

      • Japan

      • India

      • South Korea

    • Latin America

      • Brazil

    • Middle East & Africa

      • South Africa

      • Saudi Arabia

      • UAE

Frequently Asked Questions About This Report

Table of Contents

Chapter 1. Methodology and Scope
                    1.1. Market Segmentation and Scope
                    1.2. Market Definitions
                        1.2.1. Information analysis
                        1.2.2. Market formulation & data visualization
                        1.2.3. Data validation & publishing
                    1.3. Research Scope and Assumptions
                        1.3.1. List of Data Sources
Chapter 2. Executive Summary
                    2.1. Market Outlook
                    2.2. Segment Outlook
                    2.3. Competitive Insights
Chapter 3. Augmented Reality Market Variables, Trends, & Scope
                    3.1. Market Lineage Outlook
                    3.2. Market Dynamics
                        3.2.1. Market Driver Analysis
                        3.2.2. Market Restraint Analysis
                        3.2.3. Industry Challenge
                    3.3. Augmented Reality Market Analysis Tools
                        3.3.1. Industry Analysis - Porter’s
                            3.3.1.1. Bargaining power of the suppliers
                            3.3.1.2. Bargaining power of the buyers
                            3.3.1.3. Threats of substitution
                            3.3.1.4. Threats from new entrants
                            3.3.1.5. Competitive rivalry
                        3.3.2. PESTEL Analysis
                            3.3.2.1. Political landscape
                            3.3.2.2. Economic and social landscape
                            3.3.2.3. Technological landscape
Chapter 4. Augmented Reality Market: Component Estimates & Trend Analysis
                    4.1. Segment Dashboard
                    4.2. Augmented Reality Market: Component Movement Analysis, 2024 & 2030 (USD Million)
                    4.3. Hardware
                        4.3.1. Hardware Market Revenue Estimates and Forecasts, 2018 - 2030 (USD Million)
                    4.4. Software
                        4.4.1. Software Market Revenue Estimates and Forecasts, 2018 - 2030 (USD Million)
Chapter 5. Augmented Reality Market: Display Estimates & Trend Analysis
                    5.1. Segment Dashboard
                    5.2. Augmented Reality Market: Display Movement Analysis, 2024 & 2030 (USD Million)
                    5.3. HMD (Head-Mounted Display)
                        5.3.1. HMD (Head-Mounted Display) Market Revenue Estimates and Forecasts, 2018 - 2030 (USD Million)
                    5.4. Smart Glass
                        5.4.1. Smart Glass Market Revenue Estimates and Forecasts, 2018 - 2030 (USD Million)
                        5.4.2. Cinema Display Glasses
                            5.4.2.1. Cinema Display Glasses Market Revenue Estimates and Forecasts, 2018 - 2030 (USD Million)
                        5.4.3. XR Glasses
                            5.4.3.1. XR Glasses Market Revenue Estimates and Forecasts, 2018 - 2030 (USD Million)
                    5.5. Head-up Display (HUD)
                        5.5.1. Head-up Display (HUD) Market Revenue Estimates and Forecasts, 2018 - 2030 (USD Million)
                    5.6. Handheld Devices
                        5.6.1. Handheld Devices Market Revenue Estimates and Forecasts, 2018 - 2030 (USD Million)
Chapter 6. Augmented Reality Market: Application Estimates & Trend Analysis
                    6.1. Segment Dashboard
                    6.2. Augmented Reality Market: Application Movement Analysis, 2024 & 2030 (USD Million)
                    6.3. Aerospace & Defense
                        6.3.1. Aerospace & Defense Market Revenue Estimates and Forecasts, 2018 - 2030 (USD Million)
                    6.4. Automotive
                        6.4.1. Automotive Market Revenue Estimates and Forecasts, 2018 - 2030 (USD Million)
                    6.5. Education
                        6.5.1. Education Market Revenue Estimates and Forecasts, 2018 - 2030 (USD Million)
                    6.6. E-commerce & Retail
                        6.6.1. E-commerce & Retail Market Revenue Estimates and Forecasts, 2018 - 2030 (USD Million)
                    6.7. Gaming & Entertainment
                        6.7.1. Gaming & Entertainment Market Revenue Estimates and Forecasts, 2018 - 2030 (USD Million)
                    6.8. Healthcare
                        6.8.1. Healthcare Market Revenue Estimates and Forecasts, 2018 - 2030 (USD Million)
                    6.9. Industrial and Manufacturing
                        6.9.1. Industrial and Manufacturing Market Revenue Estimates and Forecasts, 2018 - 2030 (USD Million)
                    6.10. Others
                        6.10.1. Others Market Revenue Estimates and Forecasts, 2018 - 2030 (USD Million)
Chapter 7. Augmented Reality Market: Regional Estimates & Trend Analysis
                    7.1. Augmented Reality Market Share, By Region, 2024 & 2030 (USD Million)
                    7.2. North America
                        7.2.1. North America Augmented Reality Market Estimates and Forecasts, 2018 - 2030 (USD Million)
                        7.2.2. U.S.
                            7.2.2.1. U.S. Augmented Reality Market Estimates and Forecasts, 2018 - 2030 (USD Million)
                        7.2.3. Canada
                            7.2.3.1. Canada Augmented Reality Market Estimates and Forecasts, 2018 - 2030 (USD Million)
                        7.2.4. Mexico
                            7.2.4.1. Mexico Augmented Reality Market Estimates and Forecasts, 2018 - 2030 (USD Million)
                    7.3. Europe
                        7.3.1. Europe Augmented Reality Market Estimates and Forecasts, 2018 - 2030 (USD Million)
                        7.3.2. UK
                            7.3.2.1. UK Augmented Reality Market Estimates and Forecasts, 2018 - 2030 (USD Million)
                        7.3.3. Germany
                            7.3.3.1. Germany Augmented Reality Market Estimates and Forecasts, 2018 - 2030 (USD Million)
                        7.3.4. France
                            7.3.4.1. France Augmented Reality Market Estimates and Forecasts, 2018 - 2030 (USD Million)
                    7.4. Asia Pacific
                        7.4.1. Asia Pacific Augmented Reality Market Estimates and Forecasts, 2018 - 2030 (USD Million)
                        7.4.2. China
                            7.4.2.1. China Augmented Reality Market Estimates and Forecasts, 2018 - 2030 (USD Million)
                        7.4.3. Japan
                            7.4.3.1. Japan Augmented Reality Market Estimates and Forecasts, 2018 - 2030 (USD Million)
                        7.4.4. India
                            7.4.4.1. India Augmented Reality Market Estimates and Forecasts, 2018 - 2030 (USD Million)
                        7.4.5. South Korea
                            7.4.5.1. South Korea Augmented Reality Market Estimates and Forecasts, 2018 - 2030 (USD Million)
                        7.4.6. Australia
                            7.4.6.1. Australia Augmented Reality Market Estimates and Forecasts, 2018 - 2030 (USD Million)
                    7.5. Latin America
                        7.5.1. Latin America Augmented Reality Market Estimates and Forecasts, 2018 - 2030 (USD Million)
                        7.5.2. Brazil
                            7.5.2.1. Brazil Augmented Reality Market Estimates and Forecasts, 2018 - 2030 (USD Million)
                    7.6. Middle East and Africa
                        7.6.1. Middle East and Africa Augmented Reality Market Estimates and Forecasts, 2018 - 2030 (USD Million)
                        7.6.2. UAE
                            7.6.2.1. UAE Augmented Reality Market Estimates and Forecasts, 2018 - 2030 (USD Million)
                        7.6.3. Saudi Arabia
                            7.6.3.1. Saudi Arabia Augmented Reality Market Estimates and Forecasts, 2018 - 2030 (USD Million)
                        7.6.4. South Africa
                            7.6.4.1. South Africa Augmented Reality Market Estimates and Forecasts, 2018 - 2030 (USD Million)
Chapter 8. Competitive Landscape
                    8.1. Company Categorization
                    8.2. Company Market Positioning
                    8.3. Company Heat Map Analysis
                    8.4. Company Profiles/Listing
                        8.4.1. Apple, Inc.
                            8.4.1.1. Participant’s Overview
                            8.4.1.2. Financial Performance
                            8.4.1.3. Product Benchmarking
                            8.4.1.4. Strategic Initiatives
                        8.4.2. Blippar Limited
                            8.4.2.1. Participant’s Overview
                            8.4.2.2. Financial Performance
                            8.4.2.3. Product Benchmarking
                            8.4.2.4. Strategic Initiatives
                        8.4.3. Google LLC
                            8.4.3.1. Participant’s Overview
                            8.4.3.2. Financial Performance
                            8.4.3.3. Product Benchmarking
                            8.4.3.4. Strategic Initiatives
                        8.4.4. Lenovo Group
                            8.4.4.1. Participant’s Overview
                            8.4.4.2. Financial Performance
                            8.4.4.3. Product Benchmarking
                            8.4.4.4. Strategic Initiatives
                        8.4.5. Magic Leap, Incorporated
                            8.4.5.1. Participant’s Overview
                            8.4.5.2. Financial Performance
                            8.4.5.3. Product Benchmarking
                            8.4.5.4. Strategic Initiatives
                        8.4.6. Meta Platforms, Inc.
                            8.4.6.1. Participant’s Overview
                            8.4.6.2. Financial Performance
                            8.4.6.3. Product Benchmarking
                            8.4.6.4. Strategic Initiatives
                        8.4.7. PTC Inc.
                            8.4.7.1. Participant’s Overview
                            8.4.7.2. Financial Performance
                            8.4.7.3. Product Benchmarking
                            8.4.7.4. Strategic Initiatives
                        8.4.8. Snap, Inc
                            8.4.8.1. Participant’s Overview
                            8.4.8.2. Financial Performance
                            8.4.8.3. Product Benchmarking
                            8.4.8.4. Strategic Initiatives
                        8.4.9. Sony Corporation
                            8.4.9.1. Participant’s Overview
                            8.4.9.2. Financial Performance
                            8.4.9.3. Product Benchmarking
                            8.4.9.4. Strategic Initiatives
                        8.4.10. TeamViewer AG
                            8.4.10.1. Participant’s Overview
                            8.4.10.2. Financial Performance
                            8.4.10.3. Product Benchmarking
                            8.4.10.4. Strategic Initiatives
                        8.4.11. Vuzix Corporation
                            8.4.11.1. Participant’s Overview
                            8.4.11.2. Financial Performance
                            8.4.11.3. Product Benchmarking
                            8.4.11.4. Strategic Initiatives
                        8.4.12. Wikitude GmbH
                            8.4.12.1. Participant’s Overview
                            8.4.12.2. Financial Performance
                            8.4.12.3. Product Benchmarking
                            8.4.12.4. Recent Developments
                        8.4.13. Xiaomi Corporation
                            8.4.13.1. Participant’s Overview
                            8.4.13.2. Financial Performance
                            8.4.13.3. Product Benchmarking
                            8.4.13.4. Recent Developments
                        8.4.14. Zappar Limited
                            8.4.14.1. Participant’s Overview
                            8.4.14.2. Financial Performance
                            8.4.14.3. Product Benchmarking
                            8.4.14.4. Recent Developments 


List of Tables

Table 1 Global Augmented Reality Market size estimates & forecasts 2018 - 2030 (USD Million)
Table 2 Global Augmented Reality Market, by region 2018 - 2030 (USD Million)
Table 3 Global Augmented Reality Market, by component 2018 - 2030 (USD Million)
Table 4 Global Augmented Reality Market, by display 2018 - 2030 (USD Million)
Table 5 Global Augmented Reality Market, by application 2018 - 2030 (USD Million)
Table 6 Hardware Augmented Reality Market, by region 2018 - 2030 (USD Million)
Table 7 Software Augmented Reality Market, by region 2018 - 2030 (USD Million)
Table 8 HMD (Head-Mounted Display) Augmented Reality Market, by region 2018 - 2030 (USD Million)
Table 9 Smart Glass Augmented Reality Market, by region 2018 - 2030 (USD Million)
Table 10 Cinema Display Glasses Augmented Reality Market, by region 2018 - 2030 (USD Million)
Table 11 XR Glasses Augmented Reality Market, by region 2018 - 2030 (USD Million)
Table 12 Head-up Display (HUD) Augmented Reality Market, by region 2018 - 2030 (USD Million)
Table 13 Handheld Devices Augmented Reality Market, by region 2018 - 2030 (USD Million)
Table 14 Aerospace & Defense Augmented Reality Market, by region 2018 - 2030 (USD Million)
Table 15 Automotive Augmented Reality Market, by region 2018 - 2030 (USD Million)
Table 16 Education Augmented Reality Market, by region 2018 - 2030 (USD Million)
Table 17 E-commerce & Retail Augmented Reality Market, by region 2018 - 2030 (USD Million)
Table 18 Gaming & Entertainment Augmented Reality Market, by region 2018 - 2030 (USD Million)
Table 19 Healthcare Augmented Reality Market, by region 2018 - 2030 (USD Million)
Table 20 Industrial and Manufacturing Augmented Reality Market, by region 2018 - 2030 (USD Million)
Table 21 Others Augmented Reality Market, by region 2018 - 2030 (USD Million)
Table 22 North America Augmented Reality Market, by component 2018 - 2030 (USD Million)
Table 23 North America Augmented Reality Market, by display 2018 - 2030 (USD Million)
Table 24 North America Augmented Reality Market, by application 2018 - 2030 (USD Million)
Table 25 U.S. Augmented Reality Market, by component 2018 - 2030 (USD Million)
Table 26 U.S. Augmented Reality Market, by display 2018 - 2030 (USD Million)
Table 27 U.S. Augmented Reality Market, by application 2018 - 2030 (USD Million)
Table 28 Canada Augmented Reality Market, by component 2018 - 2030 (USD Million)
Table 29 Canada Augmented Reality Market, by display 2018 - 2030 (USD Million)
Table 30 Canada Augmented Reality Market, by application 2018 - 2030 (USD Million)
Table 31 Mexico Augmented Reality Market, by component 2018 - 2030 (USD Million)
Table 32 Mexico Augmented Reality Market, by display 2018 - 2030 (USD Million)
Table 33 Mexico Augmented Reality Market, by application 2018 - 2030 (USD Million)
Table 34 Europe Augmented Reality Market, by component 2018 - 2030 (USD Million)
Table 35 Europe Augmented Reality Market, by display 2018 - 2030 (USD Million)
Table 36 Europe Augmented Reality Market, by application 2018 - 2030 (USD Million)
Table 37 UK Augmented Reality Market, by component 2018 - 2030 (USD Million)
Table 38 UK Augmented Reality Market, by display 2018 - 2030 (USD Million)
Table 39 UK Augmented Reality Market, by application 2018 - 2030 (USD Million)
Table 40 Germany Augmented Reality Market, by component 2018 - 2030 (USD Million)
Table 41 Germany Augmented Reality Market, by display 2018 - 2030 (USD Million)
Table 42 Germany Augmented Reality Market, by application 2018 - 2030 (USD Million)
Table 43 France Augmented Reality Market, by component 2018 - 2030 (USD Million)
Table 44 France Augmented Reality Market, by display 2018 - 2030 (USD Million)
Table 45 France Augmented Reality Market, by application 2018 - 2030 (USD Million)
Table 46 Asia Pacific Augmented Reality Market, by component 2018 - 2030 (USD Million)
Table 47 Asia Pacific Augmented Reality Market, by display 2018 - 2030 (USD Million)
Table 48 Asia Pacific Augmented Reality Market, by application 2018 - 2030 (USD Million)
Table 49 China Augmented Reality Market, by component 2018 - 2030 (USD Million)
Table 50 China Augmented Reality Market, by display 2018 - 2030 (USD Million)
Table 51 China Augmented Reality Market, by application 2018 - 2030 (USD Million)
Table 52 Japan Augmented Reality Market, by component 2018 - 2030 (USD Million)
Table 53 Japan Augmented Reality Market, by display 2018 - 2030 (USD Million)
Table 54 Japan Augmented Reality Market, by application 2018 - 2030 (USD Million)
Table 55 India Augmented Reality Market, by component 2018 - 2030 (USD Million)
Table 56 India Augmented Reality Market, by display 2018 - 2030 (USD Million)
Table 57 India Augmented Reality Market, by application 2018 - 2030 (USD Million)
Table 58 South Korea Augmented Reality Market, by component 2018 - 2030 (USD Million)
Table 59 South Korea Augmented Reality Market, by display 2018 - 2030 (USD Million)
Table 60 South Korea Augmented Reality Market, by application 2018 - 2030 (USD Million)
Table 61 Australia Augmented Reality Market, by component 2018 - 2030 (USD Million)
Table 62 Australia Augmented Reality Market, by display 2018 - 2030 (USD Million)
Table 63 Australia Augmented Reality Market, by application 2018 - 2030 (USD Million)
Table 64 Latin America Augmented Reality Market, by component 2018 - 2030 (USD Million)
Table 65 Latin America Augmented Reality Market, by display 2018 - 2030 (USD Million)
Table 66 Latin America Augmented Reality Market, by application 2018 - 2030 (USD Million)
Table 67 Brazil Augmented Reality Market, by component 2018 - 2030 (USD Million)
Table 68 Brazil Augmented Reality Market, by display 2018 - 2030 (USD Million)
Table 69 Brazil Augmented Reality Market, by application 2018 - 2030 (USD Million)
Table 70 Middle East & Africa Augmented Reality Market, by component 2018 - 2030 (USD Million)
Table 71 Middle East & Africa Augmented Reality Market, by display 2018 - 2030 (USD Million)
Table 72 Middle East & Africa Augmented Reality Market, by application 2018 - 2030 (USD Million)
Table 73 UAE Augmented Reality Market, by component 2018 - 2030 (USD Million)
Table 74 UAE Augmented Reality Market, by display 2018 - 2030 (USD Million)
Table 75 UAE Augmented Reality Market, by application 2018 - 2030 (USD Million)
Table 76 UAE Augmented Reality Market, by component 2018 - 2030 (USD Million)
Table 77 UAE Augmented Reality Market, by display 2018 - 2030 (USD Million)
Table 78 UAE Augmented Reality Market, by application 2018 - 2030 (USD Million)
Table 79 Saudi Arabia Augmented Reality Market, by component 2018 - 2030 (USD Million)
Table 80 Saudi Arabia Augmented Reality Market, by display 2018 - 2030 (USD Million)
Table 81 Saudi Arabia Augmented Reality Market, by range 2018 - 2030 (USD Million)
Table 82 South Africa Augmented Reality Market, by component 2018 - 2030 (USD Million)
Table 83 South Africa Augmented Reality Market, by display 2018 - 2030 (USD Million)
Table 84 South Africa Augmented Reality Market, by range 2018 - 2030 (USD Million)


List of Figures

Fig. 1 Augmented Reality Market segmentation
Fig. 2 Information procurement
Fig. 3 Data analysis models
Fig. 4 Market formulation and validation
Fig. 5 Data validating & publishing
Fig. 6 Augmented Reality Market snapshot
Fig. 7 Augmented Reality Market segment snapshot
Fig. 8 Augmented Reality Market competitive landscape snapshot
Fig. 9 Market research process
Fig. 10 Market driver relevance analysis (Current & future impact)
Fig. 11 Market restraint relevance analysis (Current & future impact)
Fig. 12 Augmented Reality Market, By Component, Key Takeaways
Fig. 13 Augmented Reality Market, By Component, Market Share, 2024 & 2030
Fig. 14 Hardware Market Estimates & Forecasts, 2018 - 2030 (USD Million)
Fig. 15 Software Market Estimates & Forecasts, 2018 - 2030 (USD Million)
Fig. 16 Augmented Reality Market, By Display, Key Takeaways
Fig. 17 Augmented Reality Market, By Display, Market Share, 2024 & 2030
Fig. 18 HMD (Head-Mounted Display) Market Estimates & Forecasts, 2018 - 2030 (USD Million)
Fig. 19 Smart Glass Market Estimates & Forecasts, 2018 - 2030 (USD Million)
Fig. 20 Cinema Display Glasses Market Estimates & Forecasts, 2018 - 2030 (USD Million)
Fig. 21 XR Glasses Market Estimates & Forecasts, 2018 - 2030 (USD Million)
Fig. 22 Head-up Display (HUD) Market Estimates & Forecasts, 2018 - 2030 (USD Million)
Fig. 23 Handheld Devices Market Estimates & Forecasts, 2018 - 2030 (USD Million)
Fig. 24 Augmented Reality Market, By Application, Key Takeaways
Fig. 25 Augmented Reality Market, By Application, Market Share, 2024 & 2030
Fig. 26 Aerospace & Defense Market Estimates & Forecasts, 2018 - 2030 (USD Million)
Fig. 27 Automotive Market Estimates & Forecasts, 2018 - 2030 (USD Million)
Fig. 28 Education Market Estimates & Forecasts, 2018 - 2030 (USD Million)
Fig. 29 E-commerce & Retail Market Estimates & Forecasts, 2018 - 2030 (USD Million)
Fig. 30 Gaming & Entertainment Market Estimates & Forecasts, 2018 - 2030 (USD Million)
Fig. 31 Healthcare Market Estimates & Forecasts, 2018 - 2030 (USD Million)
Fig. 32 Industrial and Manufacturing Market Estimates & Forecasts, 2018 - 2030 (USD Million)
Fig. 33 Others Market Estimates & Forecasts, 2018 - 2030 (USD Million)
Fig. 34 Augmented Reality Market Revenue, By Region, 2024 & 2030 (USD Million)
Fig. 35 North America Augmented Reality Market Estimates & Forecast, 2018 - 2030 (USD Million)
Fig. 36 U.S. Augmented Reality Market Estimates & Forecast, 2018 - 2030 (USD Million)
Fig. 37 Canada Augmented Reality Market Estimates & Forecast, 2018 - 2030 (USD Million)
Fig. 38 Mexico Augmented Reality Market Estimates & Forecast, 2018 - 2030 (USD Million)
Fig. 39 Europe Augmented Reality Market Estimates & Forecast, 2018 - 2030 (USD Million)
Fig. 40 UK Augmented Reality Market Estimates & Forecast, 2018 - 2030 (USD Million)
Fig. 41 Germany Augmented Reality Market Estimates & Forecast, 2018 - 2030 (USD Million)
Fig. 42 France Augmented Reality Market Estimates & Forecast, 2018 - 2030 (USD Million)
Fig. 43 Asia Pacific Augmented Reality Market Estimates & Forecast, 2018 - 2030 (USD Million)
Fig. 44 China Augmented Reality Market Estimates & Forecast, 2018 - 2030 (USD Million)
Fig. 45 Japan Augmented Reality Market Estimates & Forecast, 2018 - 2030 (USD Million)
Fig. 46 South Korea Augmented Reality Market Estimates & Forecast, 2018 - 2030 (USD Million)
Fig. 47 India Augmented Reality Market Estimates & Forecast, 2018 - 2030 (USD Million)
Fig. 48 Australia Augmented Reality Market Estimates & Forecast, 2018 - 2030 (USD Million)
Fig. 49 Latin America Augmented Reality Market Estimates & Forecast, 2018 - 2030 (USD Million)
Fig. 50 Brazil Augmented Reality Market Estimates & Forecast, 2018 - 2030 (USD Million)
Fig. 51 MEA Augmented Reality Market Estimates & Forecast, 2018 - 2030 (USD Million)
Fig. 52 Saudi Arabia Augmented Reality Market Estimates & Forecast, 2018 - 2030 (USD Million)
Fig. 53 UAE Augmented Reality Market Estimates & Forecast, 2018 - 2030 (USD Million)
Fig. 54 South Africa Augmented Reality Market Estimates & Forecast, 2018 - 2030 (USD Million)
Fig. 55 Strategic Framework

What questions do you have? Get quick response from our industry experts. Request a Free Consultation

Market Segmentation

  • Augmented Reality Component Outlook (Revenue, USD Million, 2018 - 2030)
    • Hardware
    • Software
  • Augmented Reality Display Outlook (Revenue, USD Million, 2018 - 2030)
    • HMD (Head-Mounted Display)
    • Smart Glass
      • Cinema Display Glasses
      • XR Glasses
    • Head-up Display (HUD)
    • Handheld Devices
  • Augmented Reality Application Outlook (Revenue, USD Million, 2018 - 2030)
    • Aerospace & Defense
    • Gaming & Entertainment
    • Education
    • E-Commerce & Retail
    • Gaming & Entertainment
    • Education
    • Industrial & Manufacturing
    • Others
  • Augmented Reality Regional Outlook (Revenue, USD Million, 2018 - 2030)
    • North America
      • North America Augmented Reality Market, by Component
        • Hardware
        • Software
      • North America Augmented Reality Market, by Display
        • HMD (Head-Mounted Display)
        • Smart Glass
          • Cinema Display Glasses
          • XR Glasses
        • Head-up Display (HUD)
        • Handheld Devices
      • North America Augmented Reality Market, by Application
        • Aerospace & Defense
        • Automotive
        • Education
        • E-Commerce & Retail
        • Gaming & Entertainment
        • Healthcare
        • Industrial & Manufacturing
        • Others
      • U.S.
        • U.S. Augmented Reality Market, by Component
          • Hardware
          • Software
        • U.S. Augmented Reality Market, by Display
          • HMD (Head-Mounted Display)
          • Smart Glass
            • Cinema Display Glasses
            • XR Glasses
          • Head-up Display (HUD)
          • Handheld Devices
        • U.S. Augmented Reality Market, by Application
          • Aerospace & Defense
          • Automotive
          • Education
          • E-Commerce & Retail
          • Gaming & Entertainment
          • Healthcare
          • Industrial & Manufacturing
          • Others
      • Canada
        • Canada Augmented Reality Market, by Component
          • Hardware
          • Software
        • Canada Augmented Reality Market, by Display
          • HMD (Head-Mounted Display)
          • Smart Glass
            • Cinema Display Glasses
            • XR Glasses
          • Head-up Display (HUD)
          • Handheld Devices
        • Canada Augmented Reality Market, by Application
          • Aerospace & Defense
          • Automotive
          • Education
          • E-Commerce & Retail
          • Gaming & Entertainment
          • Healthcare
          • Industrial & Manufacturing
          • Others
      • Mexico
        • Mexico Augmented Reality Market, by Component
          • Hardware
          • Software
        • Mexico Augmented Reality Market, by Display
          • HMD (Head-Mounted Display)
          • Smart Glass
            • Cinema Display Glasses
            • XR Glasses
          • Head-up Display (HUD)
          • Handheld Devices
        • Mexico Augmented Reality Market, by Application
          • Aerospace & Defense
          • Automotive
          • Education
          • E-Commerce & Retail
          • Gaming & Entertainment
          • Healthcare
          • Industrial & Manufacturing
          • Others
    • Europe
      • Europe Augmented Reality Market, by Component
        • Hardware
        • Software
      • Europe Augmented Reality Market, by Display
        • HMD (Head-Mounted Display)
        • Smart Glass
          • Cinema Display Glasses
          • XR Glasses
        • Head-up Display (HUD)
        • Handheld Devices
      • Europe Augmented Reality Market, by Application
        • Aerospace & Defense
        • Automotive
        • Education
        • E-Commerce & Retail
        • Gaming & Entertainment
        • Healthcare
        • Industrial & Manufacturing
        • Others
      • UK
        • UK Augmented Reality Market, by Component
          • Hardware
          • Software
        • UK Augmented Reality Market, by Display
          • HMD (Head-Mounted Display)
          • Smart Glass
            • Cinema Display Glasses
            • XR Glasses
          • Head-up Display (HUD)
          • Handheld Devices
        • UK Augmented Reality Market, by Application
          • Aerospace & Defense
          • Automotive
          • Education
          • E-Commerce & Retail
          • Gaming & Entertainment
          • Healthcare
          • Industrial & Manufacturing
          • Others
      • Germany
        • Germany Augmented Reality Market, by Component
          • Hardware
          • Software
        • Germany Augmented Reality Market, by Display
          • HMD (Head-Mounted Display)
          • Smart Glass
            • Cinema Display Glasses
            • XR Glasses
          • Head-up Display (HUD)
          • Handheld Devices
        • Germany Augmented Reality Market, by Application
          • Aerospace & Defense
          • Automotive
          • Education
          • E-Commerce & Retail
          • Gaming & Entertainment
          • Healthcare
          • Industrial & Manufacturing
          • Others
      • France
        • France Augmented Reality Market, by Component
          • Hardware
          • Software
        • France Augmented Reality Market, by Display
          • HMD (Head-Mounted Display)
          • Smart Glass
            • Cinema Display Glasses
            • XR Glasses
          • Head-up Display (HUD)
          • Handheld Devices
        • France Augmented Reality Market, by Application
          • Aerospace & Defense
          • Automotive
          • Education
          • E-Commerce & Retail
          • Gaming & Entertainment
          • Healthcare
          • Industrial & Manufacturing
          • Others
    • Asia Pacific
      • Asia Pacific Augmented Reality Market, by Component
        • Hardware
        • Software
      • Asia Pacific Augmented Reality Market, by Display
        • HMD (Head-Mounted Display)
        • Smart Glass
          • Cinema Display Glasses
          • XR Glasses
        • Head-up Display (HUD)
        • Handheld Devices
      • Asia Pacific Augmented Reality Market, by Application
        • Aerospace & Defense
        • Automotive
        • Education
        • E-Commerce & Retail
        • Gaming & Entertainment
        • Healthcare
        • Industrial & Manufacturing
        • Others
      • China
        • China Augmented Reality Market, by Component
          • Hardware
          • Software
        • China Augmented Reality Market, by Display
          • HMD (Head-Mounted Display)
          • Smart Glass
            • Cinema Display Glasses
            • XR Glasses
          • Head-up Display (HUD)
          • Handheld Devices
        • China Augmented Reality Market, by Application
          • Aerospace & Defense
          • Automotive
          • Education
          • E-Commerce & Retail
          • Gaming & Entertainment
          • Healthcare
          • Industrial & Manufacturing
          • Others
      • Australia
        • Australia Augmented Reality Market, by Component
          • Hardware
          • Software
        • Australia Augmented Reality Market, by Display
          • HMD (Head-Mounted Display)
          • Smart Glass
            • Cinema Display Glasses
            • XR Glasses
          • Head-up Display (HUD)
          • Handheld Devices
        • Australia Augmented Reality Market, by Application
          • Aerospace & Defense
          • Automotive
          • Education
          • E-Commerce & Retail
          • Gaming & Entertainment
          • Healthcare
          • Industrial & Manufacturing
          • Others
      • Japan
        • Japan Augmented Reality Market, by Component
          • Hardware
          • Software
        • Japan Augmented Reality Market, by Display
          • HMD (Head-Mounted Display)
          • Smart Glass
            • Cinema Display Glasses
            • XR Glasses
          • Head-up Display (HUD)
          • Handheld Devices
        • Japan Augmented Reality Market, by Application
          • Aerospace & Defense
          • Automotive
          • Education
          • E-Commerce & Retail
          • Gaming & Entertainment
          • Healthcare
          • Industrial & Manufacturing
          • Others
      • India
        • India Augmented Reality Market, by Component
          • Hardware
          • Software
        • India Augmented Reality Market, by Display
          • HMD (Head-Mounted Display)
          • Smart Glass
            • Cinema Display Glasses
            • XR Glasses
          • Head-up Display (HUD)
          • Handheld Devices
        • India Augmented Reality Market, by Application
          • Aerospace & Defense
          • Automotive
          • Education
          • E-Commerce & Retail
          • Gaming & Entertainment
          • Healthcare
          • Industrial & Manufacturing
          • Others
      • South Korea
        • South Korea Augmented Reality Market, by Component
          • Hardware
          • Software
        • South Korea Augmented Reality Market, by Display
          • HMD (Head-Mounted Display)
          • Smart Glass
            • Cinema Display Glasses
            • XR Glasses
          • Head-up Display (HUD)
          • Handheld Devices
        • South Korea Augmented Reality Market, by Application
          • Aerospace & Defense
          • Automotive
          • Education
          • E-Commerce & Retail
          • Gaming & Entertainment
          • Healthcare
          • Industrial & Manufacturing
          • Others
    • Latin America
      • Latin America Augmented Reality Market, by Component
        • Hardware
        • Software
      • Latin America Augmented Reality Market, by Display
        • HMD (Head-Mounted Display)
        • Smart Glass
          • Cinema Display Glasses
          • XR Glasses
        • Head-up Display (HUD)
        • Handheld Devices
      • Latin America Augmented Reality Market, by Application
        • Aerospace & Defense
        • Automotive
        • Education
        • E-Commerce & Retail
        • Gaming & Entertainment
        • Healthcare
        • Industrial & Manufacturing
        • Others
      • Brazil
        • Brazil Augmented Reality Market, by Component
          • Hardware
          • Software
        • Brazil Augmented Reality Market, by Display
          • HMD (Head-Mounted Display)
          • Smart Glass
            • Cinema Display Glasses
            • XR Glasses
          • Head-up Display (HUD)
          • Handheld Devices
        • Brazil Augmented Reality Market, by Application
          • Aerospace & Defense
          • Automotive
          • Education
          • E-Commerce & Retail
          • Gaming & Entertainment
          • Healthcare
          • Industrial & Manufacturing
          • Others
    • Middle East & Africa
      • Middle East & Africa Augmented Reality Market, by Component
        • Hardware
        • Software
      • Middle East & Africa Augmented Reality Market, by Display
        • HMD (Head-Mounted Display)
        • Smart Glass
          • Cinema Display Glasses
          • XR Glasses
        • Head-up Display (HUD)
        • Handheld Devices
      • Middle East & Africa Augmented Reality Market, by Application
        • Aerospace & Defense
        • Automotive
        • Education
        • E-Commerce & Retail
        • Gaming & Entertainment
        • Healthcare
        • Industrial & Manufacturing
        • Others
      • South Africa
        • South Africa Augmented Reality Market, by Component
          • Hardware
          • Software
        • South Africa Augmented Reality Market, by Display
          • HMD (Head-Mounted Display)
          • Smart Glass
            • Cinema Display Glasses
            • XR Glasses
          • Head-up Display (HUD)
          • Handheld Devices
        • South Africa Augmented Reality Market, by Application
          • Aerospace & Defense
          • Automotive
          • Education
          • E-Commerce & Retail
          • Gaming & Entertainment
          • Healthcare
          • Industrial & Manufacturing
          • Others
      • Saudi Arabia
        • Saudi Arabia Augmented Reality Market, by Component
          • Hardware
          • Software
        • Saudi Arabia Augmented Reality Market, by Display
          • HMD (Head-Mounted Display)
          • Smart Glass
            • Cinema Display Glasses
            • XR Glasses
          • Head-up Display (HUD)
          • Handheld Devices
        • Saudi Arabia Augmented Reality Market, by Application
          • Aerospace & Defense
          • Automotive
          • Education
          • E-Commerce & Retail
          • Gaming & Entertainment
          • Healthcare
          • Industrial & Manufacturing
          • Others
      • UAE
        • UAE Augmented Reality Market, by Component
          • Hardware
          • Software
        • UAE Augmented Reality Market, by Display
          • HMD (Head-Mounted Display)
          • Smart Glass
            • Cinema Display Glasses
            • XR Glasses
          • Head-up Display (HUD)
          • Handheld Devices
        • UAE Augmented Reality Market, by Application
          • Aerospace & Defense
          • Automotive
          • Education
          • E-Commerce & Retail
          • Gaming & Entertainment
          • Healthcare
          • Industrial & Manufacturing
          • Others

Report content

Qualitative Analysis

  • Industry overview
  • Industry trends
  • Market drivers and restraints
  • Market size
  • Growth prospects
  • Porter’s analysis
  • PESTEL analysis
  • Key market opportunities prioritized
  • Competitive landscape
    • Company overview
    • Financial performance
    • Product benchmarking
    • Latest strategic developments

Quantitative Analysis

  • Market size, estimates, and forecast from 2018 to 2030
  • Market estimates and forecast for product segments up to 2030
  • Regional market size and forecast for product segments up to 2030
  • Market estimates and forecast for application segments up to 2030
  • Regional market size and forecast for application segments up to 2030
  • Company financial performance
What questions do you have? Get quick response from our industry experts. Request a Free Consultation

Research Methodology

Grand View Research employs comprehensive and iterative research methodology focused on minimizing deviance in order to provide the most accurate estimates and forecast possible. The company utilizes a combination of bottom-up and top-down approaches for segmenting and estimating quantitative aspects of the market. In Addition, a recurring theme prevalent across all our research reports is data triangulation that looks market from three different perspectives. Critical elements of methodology employed for all our studies include:

Preliminary data mining

Raw market data is obtained and collated on a broad front. Data is continuously filtered to ensure that only validated and authenticated sources are considered. In addition, data is also mined from a host of reports in our repository, as well as a number of reputed paid databases. For comprehensive understanding of the market, it is essential to understand the complete value chain and in order to facilitate this; we collect data from raw material suppliers, distributors as well as buyers.

Technical issues and trends are obtained from surveys, technical symposia and trade journals. Technical data is also gathered from intellectual property perspective, focusing on white space and freedom of movement. Industry dynamics with respect to drivers, restraints, pricing trends are also gathered. As a result, the material developed contains a wide range of original data that is then further cross-validated and authenticated with published sources.

Statistical model

Our market estimates and forecasts are derived through simulation models. A unique model is created customized for each study. Gathered information for market dynamics, technology landscape, application development and pricing trends is fed into the model and analyzed simultaneously. These factors are studied on a comparative basis, and their impact over the forecast period is quantified with the help of correlation, regression and time series analysis. Market forecasting is performed via a combination of economic tools, technological analysis, and industry experience and domain expertise.

Econometric models are generally used for short-term forecasting, while technological market models are used for long-term forecasting. These are based on an amalgamation of technology landscape, regulatory frameworks, economic outlook and business principles. A bottom-up approach to market estimation is preferred, with key regional markets analyzed as separate entities and integration of data to obtain global estimates. This is critical for a deep understanding of the industry as well as ensuring minimal errors. Some of the parameters considered for forecasting include:

    • Market drivers and restrains, along with their current and expected impact
    • Raw material scenario and supply v/s price trends
    • Regulatory scenario and expected developments
    • Current capacity and expected capacity additions up to 2030

We assign weights to these parameters and quantify their market impact using weighted average analysis, to derive an expected market growth rate.

Primary validation

This is the final step in estimating and forecasting for our reports. Exhaustive primary interviews are conducted, on face to face as well as over the phone to validate our findings and assumptions used to obtain them. Interviewees are approached from leading companies across the value chain including suppliers, technology providers, domain experts and buyers so as to ensure a holistic and unbiased picture of the market. These interviews are conducted across the globe, with language barriers overcome with the aid of local staff and interpreters. Primary interviews not only help in data validation, but also provide critical insights into the market, current business scenario and future expectations and enhance the quality of our reports. All our estimates and forecast are verified through exhaustive primary research with Key Industry Participants (KIPs) which typically include:

    • Market leading companies
    • Raw material suppliers
    • Product distributors
    • Buyers

The key objectives of primary research are as follows:

    • To validate our data in terms of accuracy and acceptability
    • To gain an insight in to the current market and future expectations

Data Collection Matrix

Perspective

Primary research

Secondary research

Supply side

  • Manufacturers
  • Technology distributors and wholesalers
  • Company reports and publications
  • Government publications
  • Independent investigations
  • Economic and demographic data

Demand side

  • End-user surveys
  • Consumer surveys
  • Mystery shopping
  • Case studies
  • Reference customers


Industry Analysis Matrix

Qualitative analysis

Quantitative analysis

  • Industry landscape and trends
  • Market dynamics and key issues
  • Technology landscape
  • Market opportunities
  • Porter’s analysis and PESTEL analysis
  • Competitive landscape and component benchmarking
  • Policy and regulatory scenario
  • Market revenue estimates and forecast up to 2030
  • Market revenue estimates and forecasts up to 2030, by technology
  • Market revenue estimates and forecasts up to 2030, by application
  • Market revenue estimates and forecasts up to 2030, by type
  • Market revenue estimates and forecasts up to 2030, by component
  • Regional market revenue forecasts, by technology
  • Regional market revenue forecasts, by application
  • Regional market revenue forecasts, by type
  • Regional market revenue forecasts, by component


What questions do you have? Get quick response from our industry experts. Request a Free Consultation
pdf icn

GET A FREE SAMPLE

arrow icn

This FREE sample includes data points, ranging from trend analyses to estimates and forecasts. See for yourself.

gvr icn

NEED A CUSTOM REPORT?

We can customize every report - free of charge - including purchasing stand-alone sections or country-level reports, as well as offer affordable discounts for start-ups & universities. Contact us now

Certified Icon

We are GDPR and CCPA compliant! Your transaction & personal information is safe and secure. For more details, please read our privacy policy.