
- Home
- »
- Medical Devices
- »
-
U.S. Child Care Market Size And Share Report, 2026-2033GVR Report cover

U.S. Child Care Market (2026 - 2033)
Size, Share & Trends Analysis Report By Type (Early Care, Early Education & Daycare, Backup Care), By Delivery Type, By Age Group, By States, By Region, And Segment Forecasts
Market Size, 2025
$86.2MMarket Estimate, 2026
$91.9MMarket Forecast, 2033
$147.2MCAGR, 2026–2033
7.0%U.S. Child Care Market Summary
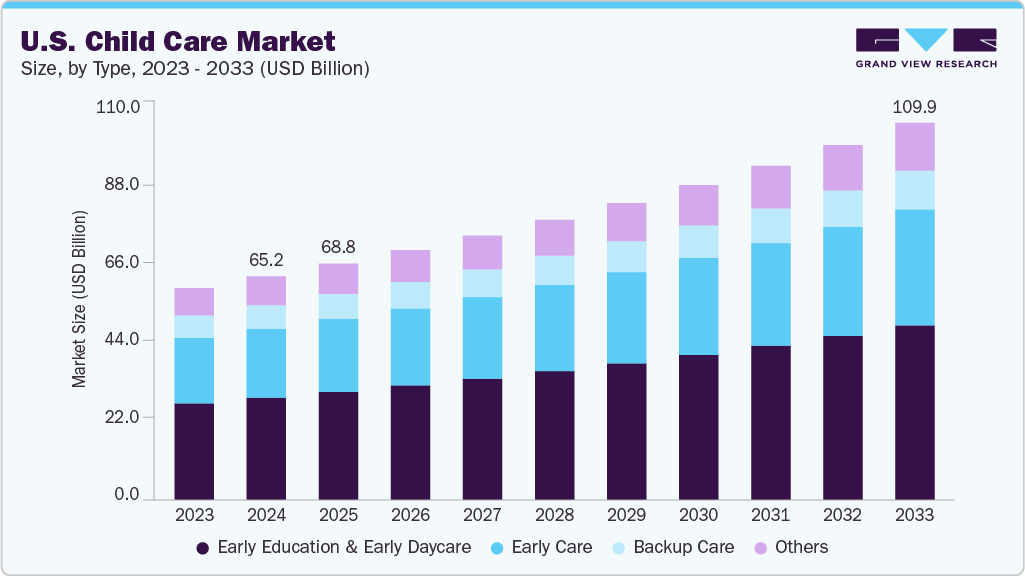
The U.S. child care market size was valued at USD 86.2 million in 2025 and is expected to grow from USD 91.9 million in 2026 to USD 147.2 million by 2033, at a CAGR of 7.0% from 2026 to 2033. This growth is driven by the increased demand due to more parents returning to offices, advancements in learning technologies, and government funding, specifically for single and working mothers. In addition, the shift in family structures, such as single-parent households, and the growing recognition of early childhood education’s role in cognitive and social development are further propelling market growth.
Key Market Trends & Insights
- By age group: The school aged children segment held the largest revenue share of 41.2% in 2025.
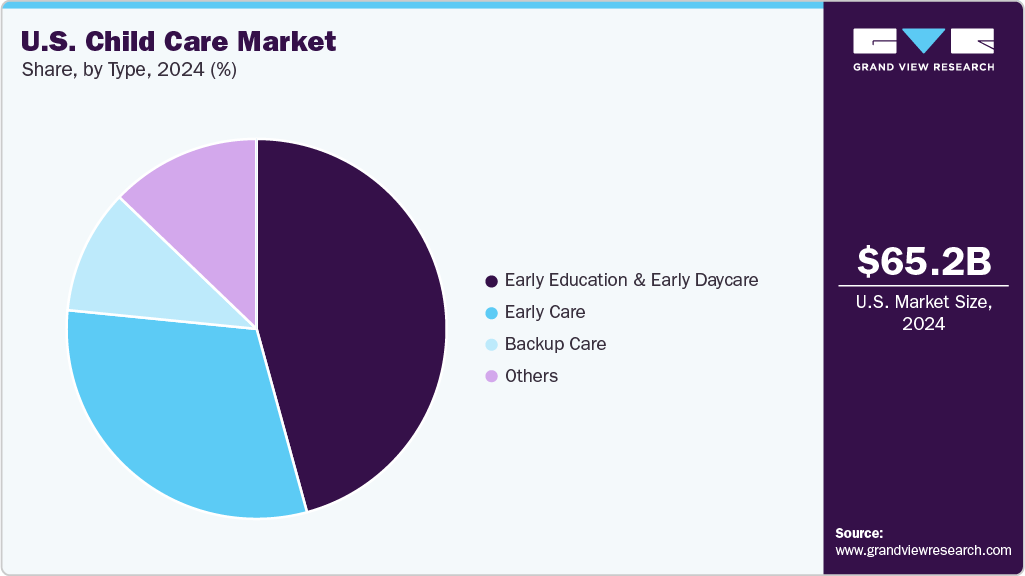
- By type: the early education & early daycare segment held a significant share of 45.8% in 2025.
- By delivery type: The organized care facilities segment held the largest share in 2025.
Market Size & Forecast
- Market size in 2025: USD 86.2 Million
- Estimated market size in 2026: USD 91.9 Million
- Projected market size by 2033: USD 147.2 Million
- CAGR (2026-2033): 7.0%
Three ways to get this report
Buy it, customize it, or ask a question.Ask an Analyst
A direct answer, usually in 1 working day
- AccessReport author, directly
- Reply timeWithin 1 working day
- No sales callDirect answer only
- FormatEmail reply
- CostFree, no cost
Get the Full Report
What the study covers
- FormatsPDF · Excel · Dashboard
- Timeline2026–2033 annual, 2025 base
- Coverage20+ countries, 5 regions
- Companies10+ key players profiled
Customize the Report
20% free customization
- IncludeCountries, segments, points
- TailorTo your product definition
- ExtendDeeper competitor detail
- OrA fully bespoke study
- Turnaround5–10 working days
 Source: Grand View Research, IR Documents, Primary Interviews, Paid DatabasesTo learn more about this report,
 Download Free Sample Report
 Market Dynamics
The U.S. child care market is influenced by rising demand for reliable and affordable care, changes in parental employment, and growing awareness of early childhood development. Increasing participation of both parents in the workforce supports demand for full-day and flexible child care services. At the same time, high operating costs, shortages of qualified child care workers, and limited availability of licensed child care spaces continue to affect market supply and affordability. Government subsidies, employer-supported child care programs, and investments in early childhood services are also shaping market development. Overall, the market is characterized by strong underlying demand but supply and affordability constraints, creating opportunities for providers that can offer accessible, flexible, and cost-effective child care solutions.
The demand for early care and education in states is increasing due to the growth in skilled service areas, such as business & health, indicating the need for quality and accessible childcare & early education. Therefore, ensuring that skilled workers with young children can continue participating in the labor force is important. In addition, it facilitates parents to pursue higher education degrees and specialized training, which is essential to maintain a competitive employment market. A strong childcare and early education infrastructure is crucial for Massachusetts to remain an attractive place to live and work for a skilled workforce.
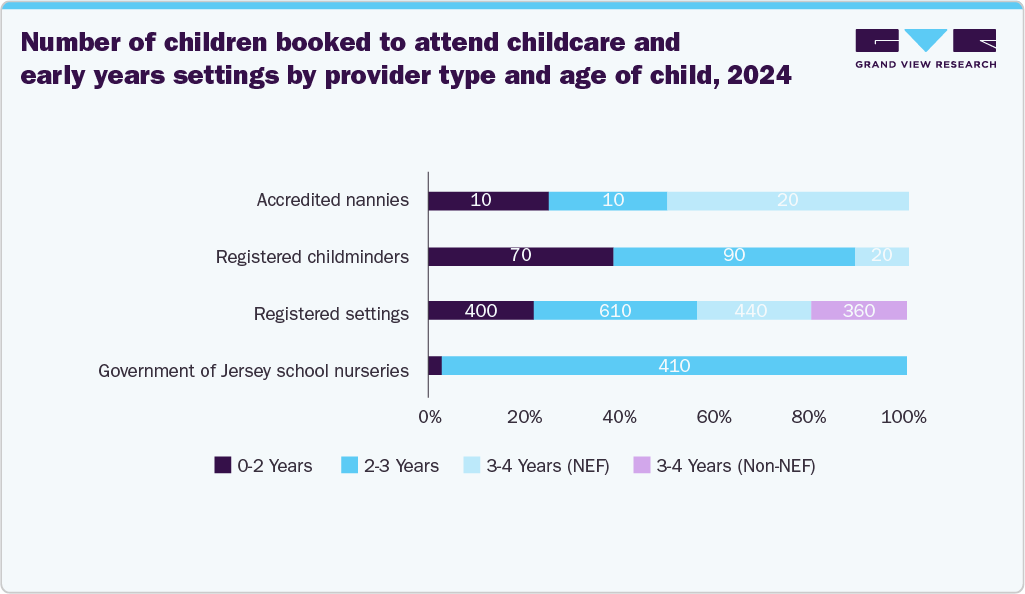
Moreover, based on the Early Childhood Education and Care Survey 2024 findings, approximately 2,220 children were scheduled to attend childcare and early years settings across Jersey, including government school nurseries, private and not-for-profit day nurseries, private school nurseries, registered childminders, and accredited nannies. This figure shows a slight increase compared to 2023, indicating steady or gradually rising demand for early years and childcare services on the island.
 To learn more about this report, Download Free Sample Report
 High childcare service costs continue to restrain the U.S. child care market by limiting affordability for families and reducing access to formal care. Child Care Aware of America’s July 2025 economic analysis noted that families face costs exceeding commonly cited affordability thresholds, while providers continue to experience low pay and workforce-related pressures. Therefore, high service costs can encourage parents to reduce working hours, change employment arrangements, or rely on informal care, thereby limiting the addressable demand for licensed childcare services and acting as a key restraint on market expansion.
The average annual cost of infant care by state, 2025
State
Average Annual Cost of Infant Care (USD)
Alabama
7,871
Alaska
20,943
Arizona
15,625
Arkansas
8,873
California
21,945
Colorado
21,840
Connecticut
20,254
Delaware
16,220
District of Columbia
28,356
Florida
13,021
Georgia
11,863
Hawaii
21,167
Idaho
9,630
Illinois
16,107
Indiana
14,471
Iowa
9,605
Kansas
9,105
Kentucky
8,756
Louisiana
8,873
Maine
13,310
Maryland
18,946
Massachusetts
26,709
Michigan
10,023
Minnesota
22,569
Mississippi
6,868
Missouri
13,173
Montana
12,778
Nebraska
14,106
Nevada
15,950
New Hampshire
17,364
New Jersey
18,155
New Mexico
14,244
New York
17,361
North Carolina
11,720
North Dakota
12,373
Ohio
17,071
Source: TOOTRiS
Facility-based expansion is emerging as a significant opportunity in the U.S. child care market, supported by persistent gaps in licensed child care capacity across several regions. According to Child Care Aware of America, the number of licensed child care centers declined by 1% nationally between 2024 and 2025, with supply decreasing in 26 of 43 states with complete data. This shortage is creating opportunities for new, expanded, and employer-linked child care facilities, particularly in underserved and workforce-intensive locations. For instance, Iowa’s Child Care Business Incentive Grant program supported the expansion of Danfoss Power Solutions’ child care facility in Ames, increasing planned capacity from 80 to 164 slots, while a multi-employer child care center in Dubuque added 120 new slots. In addition, in June 2026, the U.S. Joint Economic Committee identified employer-built and retrofitted child care facilities as a potential approach to expanding capacity, with new facilities potentially requiring USD 1-3 million in construction investment. These developments indicate increasing scope for small-format, employer-supported, and purpose-built facilities to address localized capacity shortages and improve child care access for working families.
The mismatch between child care availability and working-parent requirements remains a key challenge for the U.S. child care market. According to CAP, in January 2025, nearly 70% of children under age six had all available parents in the workforce in 2023, sustaining demand for reliable and full-time child care services. However, supply growth has remained limited. According to Child Care Aware of America (2025), the number of family child care homes declined by approximately 12% between 2019 and 2023, while center-based child care supply showed no further growth in 2023 after returning to pre-pandemic levels in 2022. This imbalance is particularly challenging for working families requiring consistent care that matches their employment schedules and locations. The limited expansion of providers relative to workforce participation can increase wait times, reduce access to suitable programs, and encourage parents to modify work arrangements. Consequently, the persistent supply-demand gap is expected to constrain market accessibility and remain a significant challenge for the market.
Market Concentration & Characteristics:
The U.S. child care market is fragmented, with high competition among local, regional, and national providers. The degree of innovation is medium, supported by increasing adoption of digital management solutions. M&A activity remains medium, while regulations have a high impact on market operations. Service expansion is high, and regional expansion remains medium as providers continue to address underserved areas.
Digital tools are increasingly being integrated into child care administration, parent communication, enrollment, and attendance management. Procare Solutions reported in March 2025 Child Care Business Trends Report that daycare-app adoption increased 7% year over year, while more than half of surveyed teachers reported that child care management software made their daily work easier. In addition, Playground introduced predictive enrollment capabilities in July 2025 to help providers forecast enrollment and manage future capacity. These developments indicate growing technology adoption, although digital transformation remains uneven across providers
 To learn more about this report, Download Free Sample Report
 M&A activity remains medium, with larger operators using acquisitions to increase center capacity and strengthen geographic coverage. In March 2026, KinderCare reported that its fiscal 2025 center portfolio increased by 27 locations, including 26 acquired centers and 20 newly opened centers, partially offset by 19 permanent closures. This indicates that acquisitions remain an important expansion strategy, although the market continues to include a substantial number of independent providers
Regulations have a high impact on market operations because providers must comply with state licensing, staffing ratios, health and safety standards, background checks, and subsidy-related requirements. In September 2025, New Mexico introduced universal child care beginning November 1, 2025, supported by new rules governing provider participation and reimbursement. The state also issued final universal child care regulations in October 2025, demonstrating how policy changes can directly influence provider operations and market access.
Service expansion is rated high as providers, employers, and community organizations continue adding capacity and broadening access to care. In January 2025, Iowa awarded USD 14 million in grants to businesses for new and expanded child care projects, including onsite and community-based facilities. The program specifically targeted infrastructure development to increase child care availability for employees and local communities.
Regional expansion remains medium, as large providers continue entering underserved markets while expansion is constrained by workforce availability and local operating conditions. In March 2025, KinderCare opened its first early childhood education center in Idaho, entering its 41st state with a facility capable of serving up to 80 children in the Boise area. This expansion illustrates the continued geographic penetration of large providers into previously underserved markets.
Analyst Perspective
The U.S. child care market is expected to witness steady growth, driven by rising demand from working parents, increasing workforce participation, and the need for accessible early childhood services. However, high service costs, workforce shortages, limited child care capacity, and uneven availability across regions continue to constrain market expansion. From an analyst perspective, providers are increasingly focusing on expanding capacity in underserved areas, offering flexible care options, and improving service quality to address changing family needs. Government subsidies, state-level funding programs, and public-private partnerships are also supporting market development and improving affordability for eligible families. Opportunities remain particularly strong for providers serving infants and toddlers, rural and underserved communities, and families requiring care during nontraditional working hours.
Age Group Insights
The school-aged children segment dominated the market, accounting for a revenue share of 41.2% in 2025. Demand for school-age child care remains supported by the need for care during the hours when school is not in session. In October 2025, according to the Afterschool Alliance’s 2025 America After 3 PM survey, parents of 29.6 million school-age children wanted afterschool programs, while only 7 million children were enrolled. The survey found that 22.6 million children would participate if a program were available, highlighting substantial unmet demand for afterschool services. Moreover, unmet demand was particularly high among elementary school students, with 58% of elementary school children not enrolled in an afterschool program expected to participate if a program were available.
The preschooler’s segment is anticipated to grow at the fastest CAGR during the forecast period. Increasing participation in preschool and early learning programs is supporting demand for child care services for children aged 3 to 5 years. In April 2026, according to the National Center for Education Statistics (NCES) 2025 Condition of Education report, the overall school enrollment rate for 3- to 4-year-olds increased from 47% in 2022 to 49% in 2023, indicating continued participation in early childhood education. In addition, Head Start programs were projected to provide approximately 567,117 preschool slots in FY 2025, demonstrating continued institutional demand for preschool services. The expansion of early learning programs, growing emphasis on school readiness, and increasing participation of young children in formal education are expected to support demand for preschool child care services during the forecast period.
Type Insights
The early education & early daycare segment dominated the market, accounting for a revenue share of 45.8% in 2025, and is expected to grow at the fastest CAGR from 2026 to 2033. Growth is supported by rising demand for early learning and greater focus on school readiness. In 2025, Massachusetts expanded its Commonwealth Preschool Partnership Initiative (CPPI) to 23 Gateway Cities and seven other communities, supporting access to high-quality, affordable preschool programs. The initiative supported 2,235 children in FY 2025, highlighting continued state investment in early education and daycare services.
The early care segment is expected to have substantial growth over the forecast period. It is emerging as an essential aspect for parents and the government since it provides a safe and nurturing environment for them to grow & learn. High-quality early care can have long-lasting positive effects on children's cognitive, social, and emotional development, and can even lead to better outcomes in adulthood.
Delivery Type Insights
The organized care facilities segment held the largest revenue share of 85.0% in 2025 and is expected to grow at the fastest CAGR during the forecast period. Growth is supported by increasing demand for structured child care and expansion of center-based capacity. In January 2025, the Child Care Workforce and Facilities Act was introduced in the U.S. Senate to support the construction, expansion, and renovation of center-based child care facilities, particularly in child care deserts. In addition, the federal Head Start program was estimated to fund 746,683 early childhood slots through approximately 1,984 awards in FY 2025, highlighting the continued scale of organized early childhood services.
 To learn more about this report, Download Free Sample Report
 The home-based settings segment is expected to grow at a significant CAGR during the forecast period. This is driven by increasing demand for flexible, personalized, and community-based child care options, particularly among families seeking care closer to home or outside conventional center-based schedules. Rising child care costs also encourage some parents to consider family child care homes and other small-scale providers, which can offer smaller group sizes and potentially lower operating costs.
State Insights
Texas held the largest market share of 7.3% in 2025. Strong demand is supported by the state’s large working-family population and persistent gaps in affordable child care. In August 2026, Texas lawmakers allocated USD 100 million to the child care scholarship program to support additional access for families. However, rising child care costs quickly depleted the funding, with more than 100,000 children waiting for scholarships by 2026.
Massachusetts is expected to register the fastest CAGR during the forecast period. The state’s child care market is expanding through increased provider capacity and availability of licensed services. As of November 2025, Massachusetts had 7,658 more licensed and funded child care seats than in November 2024. Moreover, licensed and funded capacity increased by 18% since 2022, reaching capacity to serve more than 263,000 children by October 2025. The number of newly opened programs also exceeded closures, indicating continued expansion of the state’s child care infrastructure.
Regional Insights
Midwest region dominated the market with a revenue share of 25.5% in 2025 and is expected to grow at the fastest CAGR from 2026 to 2033. Growth is supported by rising government investments, expansion of child care capacity, and initiatives aimed at improving access for working families. For instance, Illinois allocated USD 200 million through Smart Start Workforce Grants in FY2025, supporting more than 4,000 child care programs. In addition, Illinois reported that state investments had supported the creation of more than 11,000 new early childhood seats since 2023. In addition, Minnesota awarded USD 6.1 million in Child Care Economic Development Grants in 2025, expected to create more than 1,400 new child care slots, including 1,337 slots in Greater Minnesota. These investments are expected to strengthen child care infrastructure and support market growth across the Midwest.
The West region is expected to witness substantial growth during the forecast period, registering a 7.9% CAGR from 2026 to 2033. Growth is driven by population expansion, increasing workforce participation, and rising demand for accessible and affordable child care services. In addition, government investments in early childhood education, child care subsidies, and expansion of provider capacity are expected to improve service availability across the region. Increasing demand from working families and continued efforts to address child care shortages are further expected to support regional market growth.
Key U.S. Child Care Company Insights
Key companies in the U.S. child care market include large national operators such as Bright Horizons Family Solutions, KinderCare Education, and Learning Care Group, alongside regional providers such as Goddard Systems, Primrose Schools, and Childtime Learning Centers. These players operate through a mix of corporate-owned centers, franchised models, and employer-sponsored programs, catering to the rising demand for early education and full-day care. Their competitive strength lies in offering structured curricula, technology integration for parent engagement, and adherence to safety and regulatory standards. In addition, many are expanding through acquisitions and partnerships with employers to address growing workforce needs for reliable and high-quality services.
Key U.S. Child Care Companies:
-
Bright Horizons Family Solutions
-
KinderCare Learning Centers LLC.
-
Learning Care Group, Inc.
-
Spring Education Group
-
Cadence Education
-
The Learning Experience
-
Childcare Network
-
Kids 'R' Kids
-
Primrose Schools
-
Goddard Systems
-
BrightPath Kids
-
Winnie, Inc.
-
New Horizon Academy
-
Care.com
-
NeighborSchools, Inc.
-
SitterTree., LLC
Competitive Benchmarking
Operating Strategies
Competitive Edge
Weaknesses
Mature Players: Bright Horizons Family Solutions; KinderCare Learning Centers; Learning Care Group; Spring Education Group; Cadence Education; Primrose Schools; Goddard Systems
- Focus on expanding center-based child care and early education services across high-demand U.S. markets.
- Strengthen employer-sponsored, franchise, and corporate child care partnerships to diversify demand.
- Invest in proprietary curricula, teacher training, digital parent engagement, and child development programs.
- Expand through new center openings, acquisitions, and franchise development in underserved markets.
- Large operating networks and strong brand recognition across multiple U.S. states.
- Established curricula, standardized operating processes, and experienced childcare workforces.
- Diversified models covering infants, preschool, kindergarten, before/after-school, and backup care.
- Strong relationships with employers, families, and franchise operators support recurring demand.
- High labor, facility, insurance, and regulatory compliance costs increase operating expenses.
- Large center networks face challenges in recruiting and retaining qualified childcare workers.
- Premium pricing at several operators can reduce affordability for price-sensitive families.
- Large-scale operations can create complexity in maintaining consistent service quality across locations.
Emerging Players: Childcare Network; Kids 'R' Kids; BrightPath Kids; New Horizon Academy; Winnie; Care.com; SitterTree
- Expand through regional centers, franchising, home-based care, and technology-enabled childcare platforms.
- Target underserved markets and families seeking flexible, affordable, or short-term childcare solutions.
- Strengthen digital booking, provider discovery, parent communication, and caregiver-matching capabilities.
- Develop partnerships with employers, local providers, and community organizations to increase childcare access.
- Greater flexibility in serving specific local markets and specialized childcare needs.
- Digital platforms provide convenient access to caregivers and childcare providers.
- Franchise and home-based models require less centralized infrastructure than large center networks.
- Ability to respond quickly to demand for flexible, backup, and nontraditional childcare services.
- Smaller geographic footprints and lower brand recognition compared with major national operators.
- Dependence on local caregiver availability can restrict capacity and service consistency.
- Digital marketplaces have limited direct control over the quality of care delivered by providers.
- Smaller operators generally have fewer financial resources for national marketing, technology, and expansion.
Recent Developments:
-
In June 2026, Cadence Education acquired Especially for Children, adding nine early childhood education schools across the Minneapolis-St. Paul metropolitan area. The acquisition expanded Cadence Education’s national network to 350 schools, strengthening its presence in the child care and increasing access to early childhood education services.
-
In January 2025, The Department of Defense (DOD) launched a comprehensive Child Care Expansion Initiative to enhance access and affordability of child care for military and civilian families serving the armed forces. Recognizing that on-base child development centers alone cannot meet demand particularly for geographically dispersed service members, the initiative broadens care options through partnerships with nonprofit organizations to open new centers in high-demand areas, such as Norfolk, Virginia with additional facilities planned in Northern Virginia and Virginia Beach accommodating about 200 children.
-
In September 2025, Chroma Early Learning Academy expanded its presence in Metro Atlanta through the acquisition of three child care centers—Premier Learning Academy, Kids Tech Academy, and Discovery Point Midway. The acquisitions increased its network to 16 campuses serving more than 2,400 families, reflecting continued consolidation and expansion among child care providers.
U.S. Child Care Market Report Scope
Report Attribute
Details
Market size in 2025
USD 86.2 million
Estimated market size in 2026
USD 91.9 million
Projected market size by 2033
USD 147.2 million
Growth rate
CAGR of 7.0% from 2025 to 2033
Actual data
2021 - 2025
Forecast data
2026 - 2033
Quantitative units
Revenue in USD million/billion and CAGR from 2026 to 2033
Report coverage
Revenue forecast, company ranking, competitive landscape, growth factors, and trends
Segments covered
Type, delivery type, age group, state, region
Country scope
U.S.
Key companies profiled
Bright Horizons Family Solutions; KinderCare Learning Centers LLC.; Learning Care Group, Inc.; Spring Education Group; Cadence Education; The Learning Experience; Childcare Network; Kids 'R' Kids; Primrose Schools; Goddard Systems; BrightPath Kids; Winnie, Inc.; New Horizon Academy; Care.com; NeighborSchools, Inc.; SitterTree., LLC
Customization scope
Free report customization (equivalent to 8 analysts working days) with purchase. Addition or alteration to country, regional & segment scope.
Pricing and purchase options
Avail customized purchase options to meet your exact research needs. Explore purchase options
U.S. Child Care Market Report Segmentation
This report forecasts revenue growth, country level and provides an analysis of the latest industry trends in each of the sub-segments from 2021 to 2033 For this study, Grand View Research has segmented the U.S. child care market report based on type, age group, delivery type, state, and region.
-
Type Outlook (Revenue, USD Million, 2021 - 2033)
-
Early Care
-
Early Education & Early Daycare
-
Backup Care
-
Others
-
-
Delivery Type Outlook (Revenue, USD Million, 2021 - 2033)
-
Organized Care Facilities
-
Home-based Settings
-
-
Age Group Outlook (Revenue, USD Million, 2021 - 2033)
-
Infants
-
Toddlers
-
Preschoolers
-
School-aged Children
-
-
State Outlook (Revenue, USD Million, 2021 - 2033)
-
Massachusetts
-
New Jersey
-
Connecticut
-
Texas
-
South Carolina
-
Georgia
-
-
Region Outlook (Revenue, USD Million, 2021 - 2033)
-
West
-
Southeast
-
Southwest
-
Midwest
-
Northeast
-
Research Methodology
The U.S. child care market figures in this report are based on a proven research process that combines executive interviews with secondary research from proprietary databases, company filings, and recognized regulatory and institutional sources. Market size is built through value-chain sizing—reconciling supply-side and demand-side estimates—and triangulated with bottom-up and top-down approaches. Every estimate passes multiple levels of expert validation before publication, with each U.S. child care segment quantified using the revenue-capture definitions in the table below.
Segment Definition
Segment
Segment Definition / Revenue Capture Definition
Early Care
Includes paid child care services primarily focused on the care, supervision, safety, and basic developmental needs of young children before formal schooling. Revenue is captured through tuition, enrollment fees, and recurring child care payments.
Early Education & Early Daycare
Includes structured early childhood programs combining child care with educational, developmental, and school-readiness activities. Revenue is captured through tuition, program fees, enrollment charges, and other recurring payments.
Backup Care
Includes short-term or emergency child care services used when regular care arrangements are unavailable due to work requirements, school closures, caregiver absence, or other temporary needs. Revenue is captured through membership fees, employer-sponsored programs, hourly charges, and per-use fees.
Others
Includes specialized or supplementary child care services not classified under early care, early education and daycare, or backup care. Revenue is captured through service fees, program charges, and other child care-related payments.
Organized Care Facilities
Includes licensed or regulated child care provided through organized facilities such as child care centers, preschools, daycare centers, and early learning centers. Revenue is captured through tuition, enrollment fees, and recurring care charges.
Home-based Settings
Includes child care provided in residential settings, including family child care homes and care provided in the child’s or caregiver’s home. Revenue is captured through hourly, daily, weekly, or monthly care payments and related service fees.
Infants
Includes child care services provided primarily to children from birth through approximately 12 months of age. Revenue is captured through infant-care tuition, enrollment fees, and recurring care payments.
Toddlers
Includes child care services for children approximately 1 to 3 years of age, generally requiring supervised care and early developmental activities. Revenue is captured through tuition, enrollment fees, and recurring child care charges.
Preschoolers
Includes child care and early learning services for children approximately 3 to 5 years of age before entry into formal kindergarten or elementary education. Revenue is captured through tuition, program fees, enrollment charges, and related services.
School-aged Children
Includes before-school, after-school, holiday, summer, and other child care services for children generally enrolled in elementary or secondary education. Revenue is captured through recurring care fees, hourly charges, program fees, and seasonal enrollment payments.
Massachusetts
Represents child care services generated within Massachusetts across organized facilities and home-based settings. Revenue is captured from child care tuition, enrollment fees, program charges, and other paid care services within the state.
New Jersey
Represents child care services generated within New Jersey across organized and home-based providers. Revenue is captured through tuition, enrollment fees, recurring care payments, and program-related charges.
Connecticut
Represents child care services generated within Connecticut across licensed facilities and home-based providers. Revenue is captured through tuition, enrollment fees, and other paid child care services.
Texas
Represents child care services generated within Texas across child care centers, early learning facilities, family child care homes, and other providers. Revenue is captured through tuition, enrollment fees, and recurring care or program payments.
South Carolina
Represents child care services generated within South Carolina across organized and home-based child care providers. Revenue is captured through tuition, enrollment fees, and other charges for child care services.
Georgia
Represents child care services generated within Georgia across organized facilities and home-based settings. Revenue is captured through tuition, enrollment fees, program charges, and recurring care payments.
Rest of U.S.
Includes child care services generated across all U.S. states and jurisdictions not separately covered in the state-level segmentation. Revenue is captured through tuition, enrollment fees, program charges, and other paid child care services.
Estimation Model
Model Details
This research methodology outlines the process for estimating the size of the U.S. child care market from 2021 to 2033. The study covers key child care types, including Early Care, Early Education & Early Daycare, Backup Care, and Others. It also evaluates delivery types comprising Organized Care Facilities and Home-based Settings, age groups including Infants, Toddlers, Preschoolers, and School-aged Children, and selected state markets including Massachusetts, New Jersey, Connecticut, Texas, South Carolina, and Georgia, along with the Rest of the U.S.
The objective is to develop a robust and defensible market estimate by combining bottom-up and top-down approaches, supported by primary industry validation.
A triangulated market sizing approach was used, combining:
-
Bottom-Up Analysis based on the number of child care providers and facilities, licensed capacity, enrollment, child care attendance, utilization rates, average tuition, average spending per child, operating hours, and provider-level revenues.
-
Top-Down Analysis using U.S. child care expenditure, household spending, workforce participation, child population, child care enrollment, government child care subsidies, employer-sponsored care, household income, and overall early childhood education spending.
- Primary Research with child care center operators, owners, administrators, franchisees, early childhood educators, state child care officials, workforce development organizations, industry consultants, and other market participants.
Step-by-Step Market Estimation Process
- Child Care Enrollment and Revenue Model
This model estimates the market size based on the number of children receiving paid child care services and the average revenue generated per child.
Step 1: Facility-level data on child care providers operating in the U.S. from 2021 to 2025 were collected from state licensing databases, child care provider directories, government databases, industry associations, company disclosures, annual reports, and other industry sources.
Step 2: Child care enrollment and attendance were estimated using licensed capacity, enrollment rates, utilization rates, child population, provider disclosures, child care participation statistics, and primary interviews.
Step 3: Average revenue per child was estimated using monthly and annual tuition rates, hourly care charges, enrollment fees, program fees, age-specific pricing, geographic pricing differences, and provider-level benchmarks.
Step 4: Market size was calculated using:
Number of Children in Paid Child Care × Average Revenue per Child
or
Child Care Enrollment × Average Annual Child Care Spending per Child
Step 5: Provider-level estimates were aggregated to calculate state-level and national market values.
Step 6: Historical and forecast growth rates were incorporated based on child population trends, workforce participation, household income, child care affordability, provider capacity, tuition inflation, demand for early education, government support programs, and expansion of child care facilities.
- Child Care Provider Revenue Extrapolation Model
This model estimates the market size based on revenues generated by child care providers across the U.S.
Step 1: The number of active child care providers and facilities was identified using state licensing databases, provider directories, government databases, company disclosures, franchise networks, and industry sources.
Step 2: Providers were classified by facility type, operating model, geographic location, capacity, and service offering.
Step 3: Average annual revenue per child care provider was estimated using enrollment, licensed capacity, utilization rates, tuition rates, operating days, ancillary fees, and provider financial disclosures.
Step 4: Market size was calculated using:
Number of Child Care Providers × Adjusted Average Annual Revenue per Provider
Step 5: Provider-level revenues were aggregated to determine the overall U.S. child care market size.
Step 6: Annual adjustments were applied to account for new facility openings, provider closures, capacity additions, tuition increases, acquisitions, franchise expansion, changes in enrollment, and shifts in child care demand.
- Child Care Type Revenue Model
This model estimates market size based on revenue generated across major child care service types.
Step 1: Child care services were categorized into:
-
Early Care
-
Early Education & Early Daycare
-
Backup Care
-
Others
Step 2: Enrollment, utilization, provider capacity, pricing, and service volumes were estimated for each child care type using government data, provider disclosures, industry databases, tuition surveys, and primary interviews.
Step 3: Average revenue per child or service transaction was estimated for each category based on tuition rates, hourly charges, enrollment fees, program fees, employer-sponsored arrangements, and other service charges.
Step 4: Revenue generated by each child care type was calculated using:
Child Care Type Enrollment × Average Revenue per Child
or
Number of Service Users × Average Revenue per Service User
Step 5: Revenues across all child care types were aggregated and reconciled with total market revenues to determine the overall market size.
Step 6: Forecast assumptions incorporated increasing demand for early childhood education, working-parent participation, demand for flexible care, employer-sponsored backup care, child care capacity expansion, and changes in household spending on child care.
- Delivery Type-Based Market Estimation
The market was further assessed based on the delivery model through which child care services are provided.
Step 1: Child care services were classified into:
-
Organized Care Facilities
-
Home-based Settings
Step 2: The number of providers, licensed capacity, enrollment, and revenues associated with each delivery type were estimated using state licensing records, provider databases, household surveys, company disclosures, and industry research.
Step 3: Average revenue per child and average revenue per provider were calculated separately for organized facilities and home-based settings.
Step 4: Segment revenue was calculated using:
Segment Enrollment × Average Revenue per Child
or
Number of Providers in Segment × Average Revenue per Provider
Step 5: Delivery-type estimates were cross-checked against the total U.S. child care market to ensure consistency and avoid double counting.
Step 6: Forecast assumptions considered the expansion of organized child care centers, growth of family child care homes, changes in household preferences, provider availability, workforce participation, and demand for flexible child care arrangements.
- Age Group Revenue Model
This model estimates market revenues based on the number of children receiving child care across different age groups.
Step 1: Children receiving child care were classified into:
-
Infants
-
Toddlers
-
Preschoolers
-
School-aged Children
Step 2: Age-specific enrollment and participation rates were estimated using child population data, childcare participation statistics, provider enrollment information, government databases, and primary research.
Step 3: Average annual spending per child was estimated for each age group based on tuition rates, care requirements, program duration, facility type, and geographic pricing.
Step 4: Segment revenue was calculated using:
Number of Children in Age Group × Average Annual Child Care Spending per Child
Step 5: Age-group revenues were aggregated and reconciled with total market revenues.
Step 6: Forecast assumptions incorporated changes in birth rates, child population, parental workforce participation, preschool enrollment, school schedules, demand for infant care, and increasing demand for before-school and after-school programs.
- State-Level Market Estimation
This model estimates the market size across selected U.S. states and the Rest of the U.S.
Step 1: The market was segmented into:
-
Massachusetts
-
New Jersey
-
Connecticut
-
Texas
-
South Carolina
-
Georgia
-
Rest of U.S.
Step 2: State-level data on child population, child care enrollment, number of providers, licensed capacity, utilization, average tuition, household spending, and workforce participation were collected from state agencies, U.S. government databases, provider databases, industry sources, and primary research.
Step 3: Average revenue per child and provider was estimated separately for each state based on local tuition levels, child care demand, provider density, household income, operating costs, and utilization rates.
Step 4: State-level market revenue was calculated using:
Number of Children Receiving Paid Care × Average Annual Spending per Child
or
Number of Providers × Average Annual Revenue per Provider
Step 5: State-level estimates were aggregated to determine the total U.S. child care market.
Step 6: Forecast adjustments were applied based on state-specific child population trends, workforce participation, child care capacity expansion, tuition growth, government funding, employer-sponsored programs, and changes in household demand.
- Market Validation and Forecasting
The estimates derived from the child enrollment and revenue model, provider revenue extrapolation model, child care type model, delivery type model, age group model, and state-level model were cross-validated through data triangulation. Findings were further verified through primary interviews with child care center operators, facility owners, administrators, franchise operators, early childhood educators, state child care officials, industry consultants, and other market participants. Final market forecasts were developed by evaluating child population trends, workforce participation, household income, child care enrollment, provider capacity, average tuition, child care affordability, government subsidies, employer-sponsored child care, and overall household spending.
Forecast assumptions also considered the increasing participation of women and dual-income households in the workforce, continued demand for infant and toddler care, expansion of organized child care facilities, growth of home-based care, increasing demand for flexible and backup care, and investments in early childhood education. The model further considered child care provider expansion, franchise development, consolidation among providers, capacity additions, tuition increases, state-level child care initiatives, employer-sponsored programs, and changes in child care workforce availability through 2033.
Delivered Customizations
This report has been delivered with the following In-depth customizations
Client Request
Customization Delivered
Value Adds
U.S. Child Care Demand & Supply Analysis
Delivered a customized assessment of child care demand and supply across the U.S. by analyzing enrollment trends, child population, working-parent demographics, provider capacity, facility availability, and regional supply gaps. The study identified high-demand states, underserved areas, and priority child care segments.
Provides actionable insights into demand-supply imbalances, priority geographic markets, and service opportunities, enabling child care providers and investors to optimize expansion and capacity planning strategies.
Child Care Affordability & Competitive Landscape Assessment
Developed a comparative benchmarking model evaluating major U.S. child care markets based on service costs, provider density, household income, enrollment capacity, staffing availability, facility models, and competitive intensity.
Helps child care operators, investors, and policymakers identify pricing opportunities, competitive strengths, underserved markets, and strategies to improve affordability and market positioning.
Child Care Provider Expansion & Market Entry Strategy
Delivered a strategic evaluation of market entry and expansion opportunities across states and metropolitan areas by assessing population growth, workforce participation, employer-sponsored care, subsidy programs, regulatory conditions, and unmet child care demand.
Supports strategic decision-making for geographic expansion, identifies high-growth markets and emerging service models, and helps providers develop sustainable expansion strategies while addressing local child care shortages.
Frequently Asked Questions About This Report
The early education & early daycare segment held a significant share of 45.8% in 2025.
The U.S. child care market size was valued at 86.2 million in 2025 and is estimated at USD 91.9 million for 2026.
The U.S. child care market is expected to grow at a compound annual growth rate of 7.0% from 2026 to 2033, reaching USD 147.2 billion by 2033.
Some key players operating in the U.S. child care market include BBright Horizons Family Solutions; KinderCare Learning Centers LLC.; Learning Care Group, Inc.; Spring Education Group; Cadence Education; The Learning Experience; Childcare Network; Kids 'R' Kids; Primrose Schools; Goddard Systems; BrightPath Kids; Winnie, Inc.; New Horizon Academy; Care.com; NeighborSchools, Inc.; SitterTree., LLC
Key factors that are driving the U.S. child care market growth include growing demand for early daycare & education services with more parents returning to working in offices, advancements in learning technologies for children, the rising number of single & working mothers, and government funding.
The organized care facilities segment held the largest share in 2025
School-aged children segment dominated market in 2025 with market share of 41.2%. Population growth, urbanization, and demographic shifts influence demand for child care services in communities across U.S. As communities grow and evolve, there is an increasing need for child care providers to accommodate the needs of school-aged children and their families.
About the Author(s)
Medical Devices Research Team
Healthcare · Medical DevicesThis report was authored by the medical devices research team at Grand View Research - comprising two research analysts, one senior research analyst, and one industry expert - with specialized expertise in the medical devices segment of the healthcare industry. All findings are based on proprietary healthcare databases, executive interviews, and regulatory analysis, subject to internal peer review prior to publication.
Last Updated:
Speak to Analyst

Customize this report to your needs - add regions, segments, or data points, with 20% free customization.
Or view our licence options:


ISO 9001:2015 & 27001:2022 Certified
We are GDPR and CCPA compliant! Your transaction & personal information is safe and secure. For more details, please read our privacy policy.


