
- Home
- »
- Clothing, Footwear & Accessories
- »
-
U.S. Promotional Products Market Size & Share Report 2033GVR Report cover

U.S. Promotional Products Market (2026 - 2033)
Size, Share & Trends Analysis Report By Product (Apparel & Textiles, Office & Business Supplies, Food & Beverage, Technology & Electronics), By End Use, By Distribution Channel, And Segment Forecasts
Market Size, 2025
$27.1BMarket Estimate, 2026
$27.8BMarket Forecast, 2033
$34.9BCAGR, 2026–2033
3.3%U.S. Promotional Products Market Summary
The U.S. promotional products market size was valued at USD 27.1 billion in 2025 and is projected to grow from USD 27.8 billion in 2026 to USD 34.9 billion by 2033, at a CAGR of 3.3% from 2026 to 2033. The market is being driven by increasing corporate marketing expenditures, growing demand for branded merchandise, and rising adoption of promotional products to strengthen brand visibility and customer engagement.
Key Market Trends & Insights
- By product: Apparel & textiles segment held the largest market share of 47.5% in 2025.
- By end use: Corporate segment held the largest market share of 54.5% in 2025.
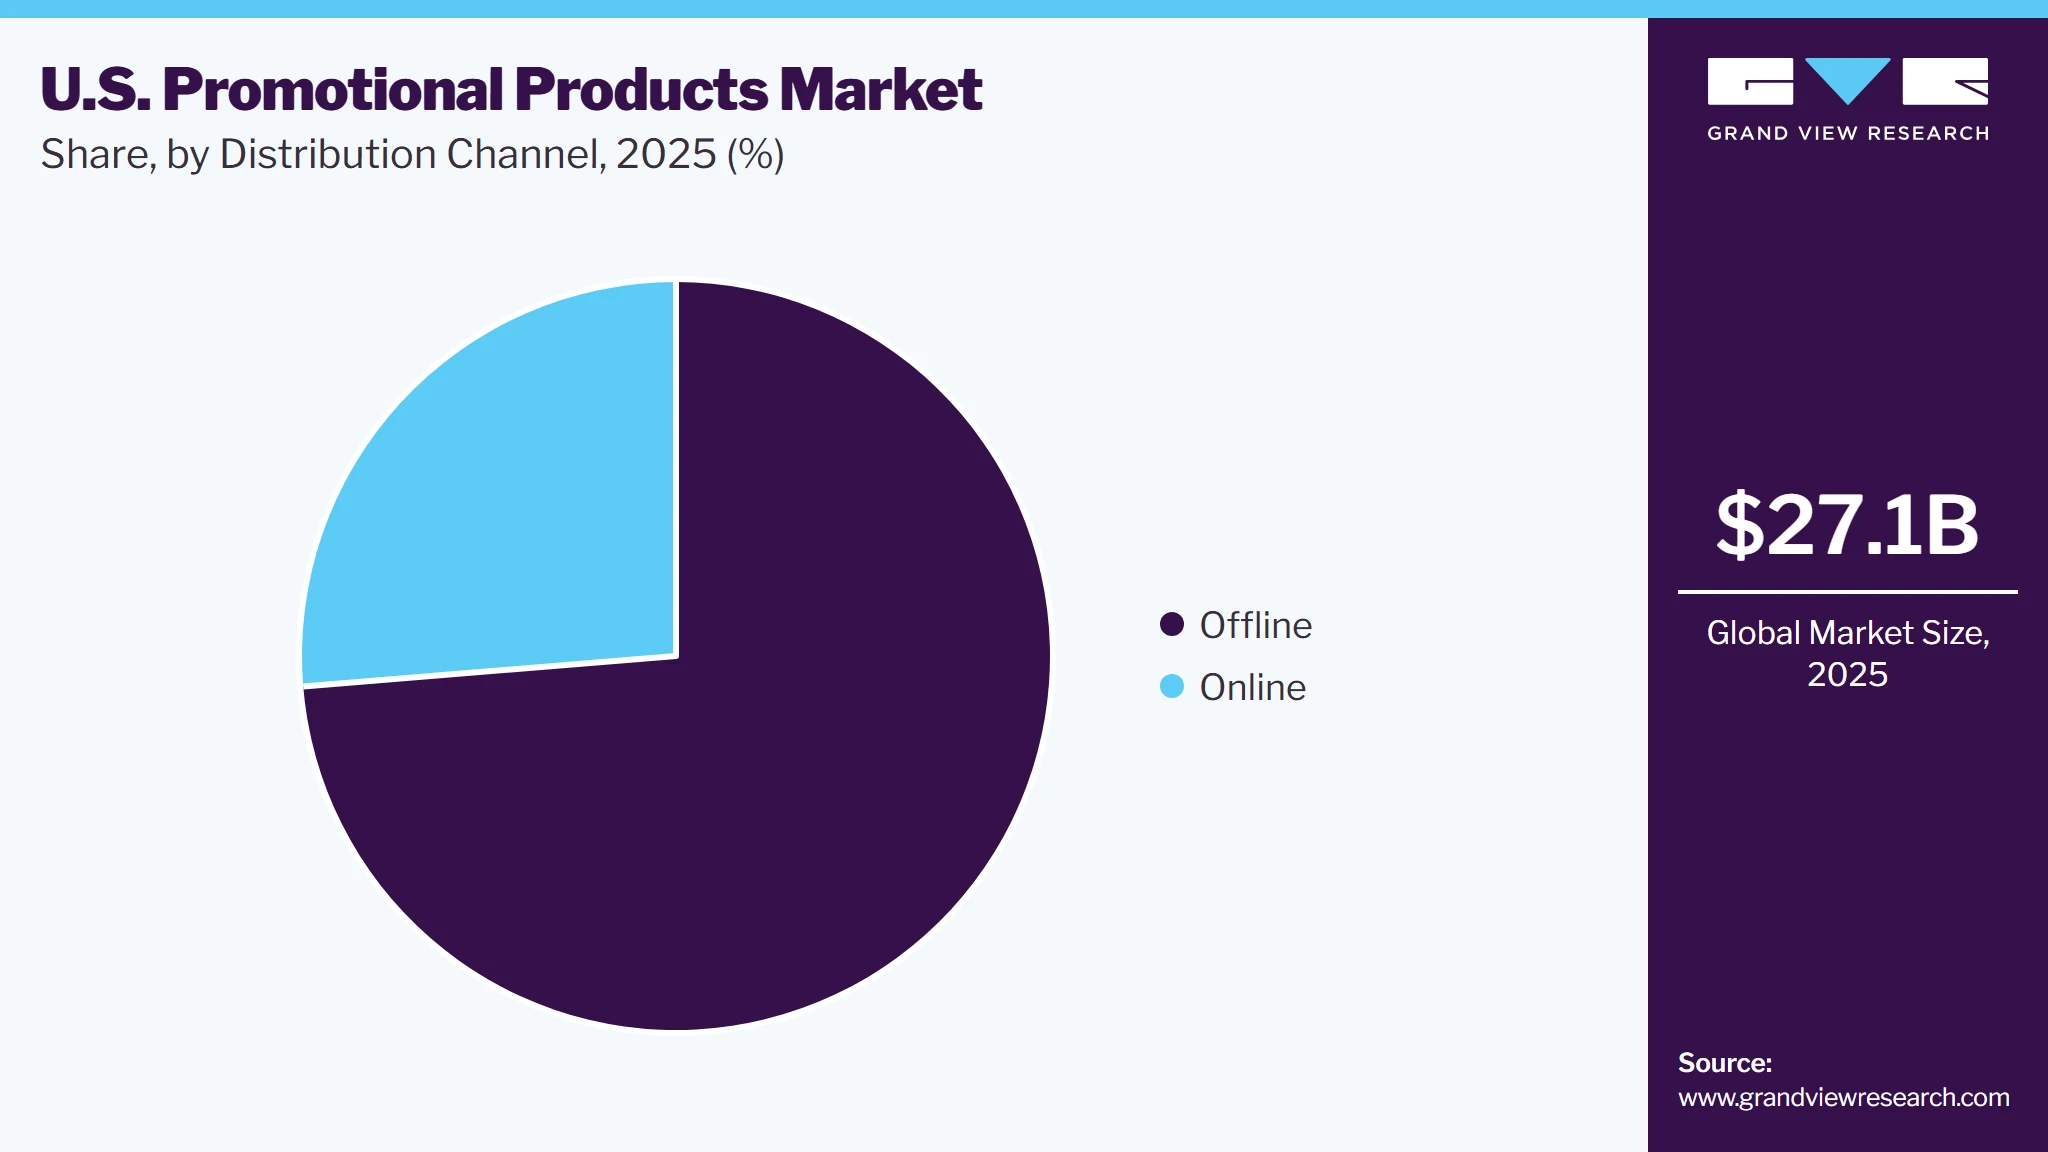
- By distribution channel: Offline segment held the largest market share of 73.7% in 2025.
Market Size & Forecast
- Market size in 2025: USD 27.1 Billion
- Estimated market size in 2026: USD 27.8 Billion
- Projected market size by 2033: USD 34.9 Billion
- CAGR (2026-2033): 3.3%
Prism AI by Grand View Research Free to tryAsk a question about the U.S. promotional products market✓Every figure cited from GVR research Prefer the report? Download free sample →
Organizations across industries, including corporate enterprises, hospitality, education, healthcare, sports, and nonprofit organizations, are increasingly using customized apparel, office supplies, drinkware, technology accessories, and event merchandise as cost-effective marketing tools.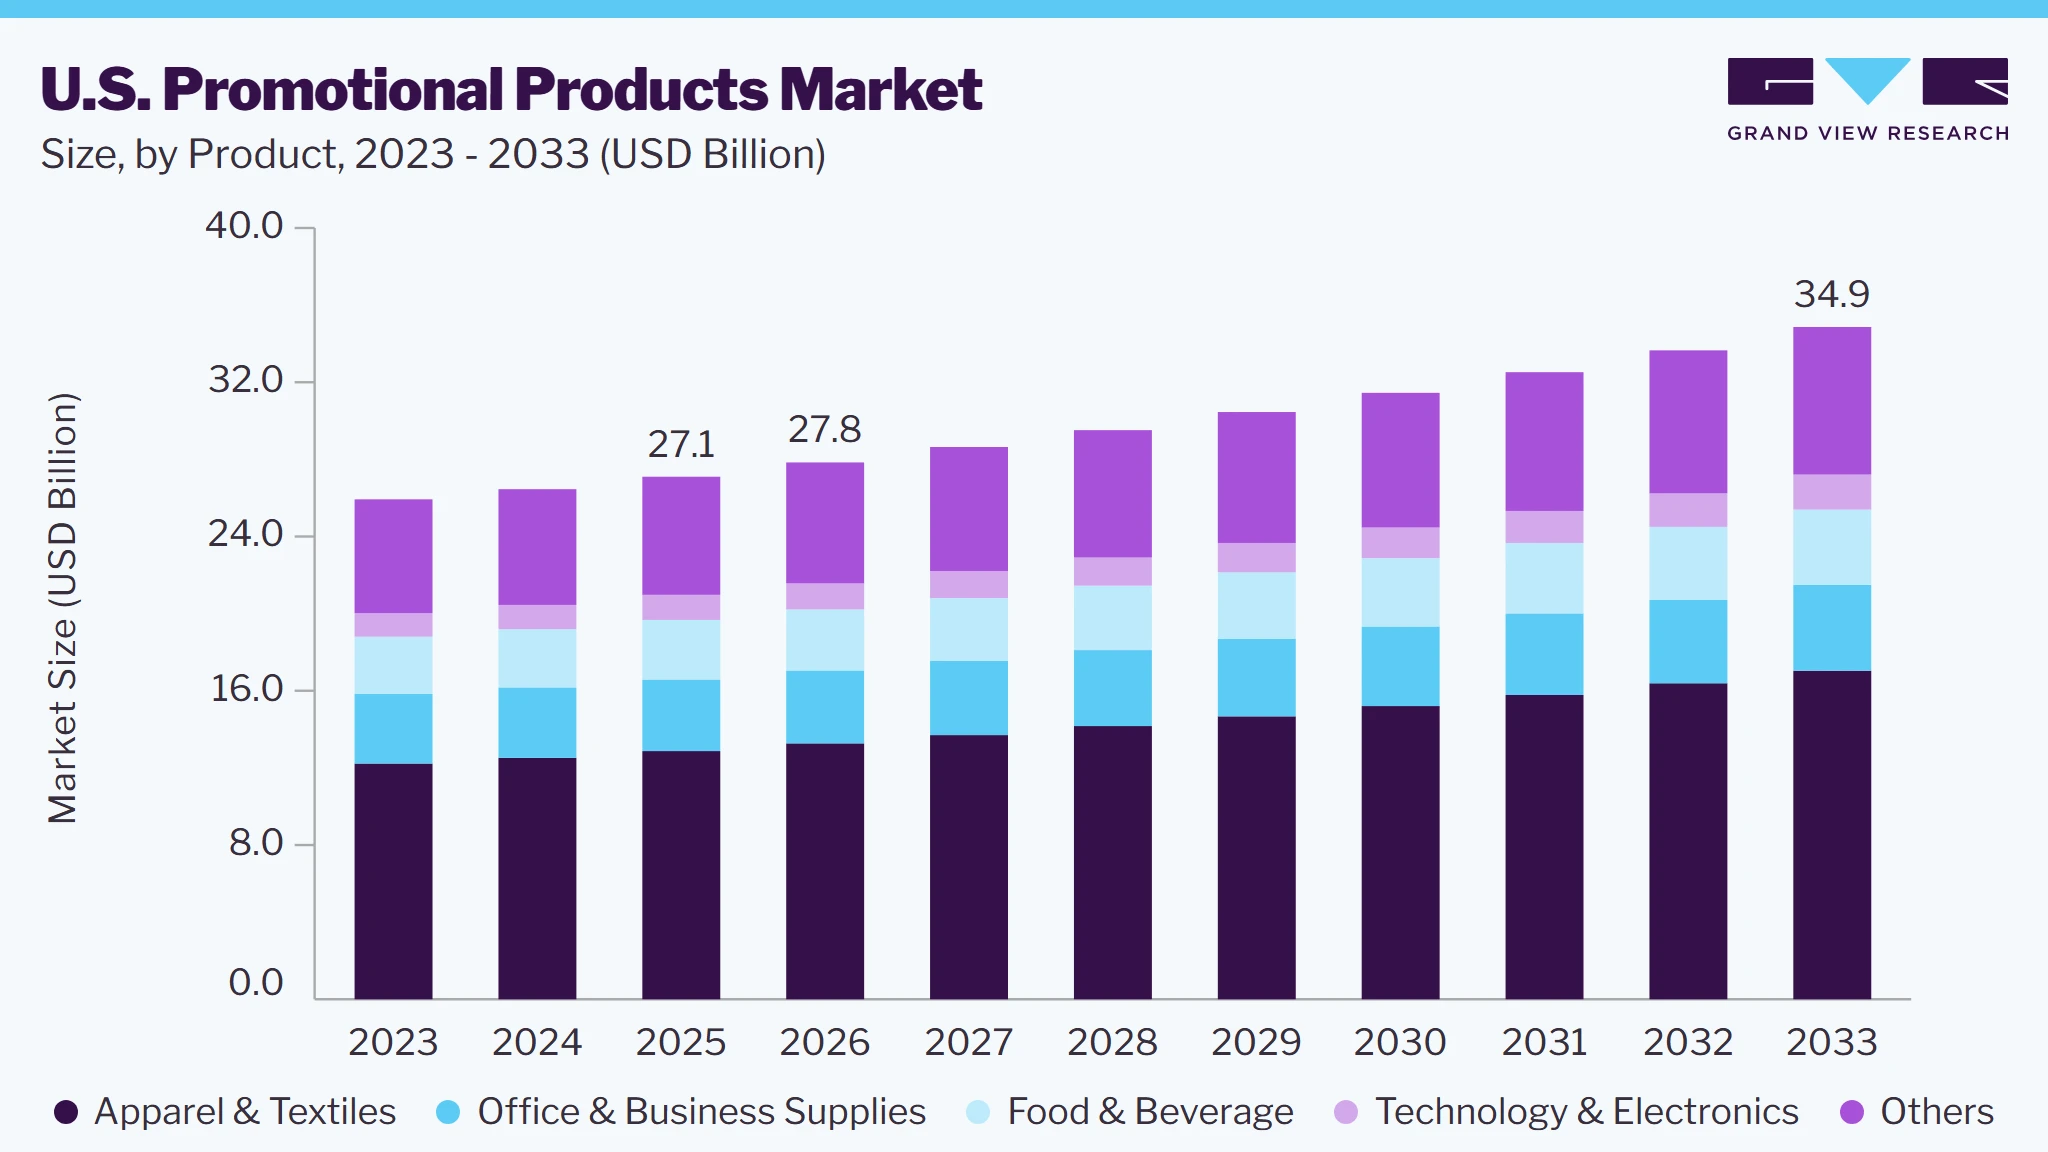 Source: Grand View Research, IR Documents, Primary Interviews, Paid DatabasesTo learn more about this report,
 Download Free Sample Report
The continued expansion of corporate gifting programs, employee recognition initiatives, trade shows, conferences, sponsorships, and promotional campaigns is further supporting demand for customized promotional products across the country.
The market is also benefiting from advancements in product customization technologies and the growing shift toward sustainable promotional merchandise. Suppliers are expanding their portfolios with eco-friendly products made from recycled, biodegradable, and reusable materials to align with corporate sustainability goals.
At the same time, improvements in digital printing, embroidery, and print-on-demand production are enabling faster turnaround times and greater personalization. The rapid growth of B2B e-commerce platforms, online product configuration tools, and integrated fulfillment services is making promotional products more accessible to businesses of all sizes. Furthermore, increasing demand for technology-related promotional items, premium corporate gifts, and data-driven promotional marketing campaigns is expected to support sustained growth in the U.S. promotional products industry.
The market has evolved from a traditional advertising support industry into a sophisticated branding and customer engagement ecosystem driven by corporate marketing, employee recognition programs, and promotional campaigns across multiple industries. While writing instruments and calendars historically dominated product demand, the market today encompasses a diverse portfolio including apparel, drinkware, bags, technology accessories, office supplies, and eco-friendly merchandise.
The industry is supported by a well-established network of manufacturers, suppliers, distributors, decorators, promotional consultants, e-commerce platforms, and corporate buyers, enabling efficient sourcing and customization of branded products. Continuous product innovation, enhanced personalization capabilities, and the introduction of sustainable product lines have expanded the customer base beyond large enterprises to include small and medium-sized businesses, educational institutions, healthcare organizations, hospitality companies, and non-profit organizations, positioning promotional products as an integral component of modern marketing strategies.
A significant growth accelerator has been the growing adoption of promotional merchandise as a measurable marketing tool to strengthen customer relationships and enhance brand visibility. Organizations are expanding investments in corporate gifting, conferences, product launches, sponsorships, and employee engagement initiatives, recognizing promotional products as cost-effective media with long-lasting brand exposure.
The rapid growth of hybrid work environments has also encouraged companies to distribute branded welcome kits, remote-employee gifts, and event merchandise, creating new demand across premium promotional-product categories. In addition, the expansion of online ordering platforms and print-on-demand services has simplified procurement, enabling businesses of all sizes to purchase customized promotional merchandise with shorter lead times and lower minimum order quantities.
The market is also being reshaped by technological advancements and evolving sustainability requirements. Improvements in digital printing, embroidery, laser engraving, and UV printing technologies have enabled greater customization, higher production quality, and faster fulfillment. At the same time, increasing corporate commitments to environmental responsibility are driving demand for promotional products manufactured from recycled, biodegradable, and renewable materials, encouraging suppliers to expand their sustainable product portfolios.
Furthermore, the integration of e-commerce platforms, online product configuration tools, inventory management systems, and fulfillment services is streamlining procurement and distribution processes, while premium technology accessories and environmentally responsible promotional merchandise continue to create new growth opportunities across the U.S. promotional products industry.
Market Dynamics
The U.S. promotional products industry is being driven by rising corporate investments in branding, customer engagement, and employee recognition initiatives. Businesses are increasingly adopting customized merchandise such as apparel, drinkware, bags, writing instruments, and technology accessories as cost-effective marketing tools that provide long-term brand visibility compared to traditional advertising. Promotional products are widely used at trade shows, conferences, product launches, corporate gifting programs, sponsorships, and employee onboarding activities to strengthen brand recall and customer relationships. In addition, the expansion of e-commerce ordering platforms, print-on-demand customization, and sustainable product offerings has made branded merchandise more accessible to businesses of all sizes. As companies continue to prioritize measurable marketing ROI and customer engagement, demand for customized promotional products is expected to remain a key driver of market growth.
 To learn more about this report, Download Free Sample Report
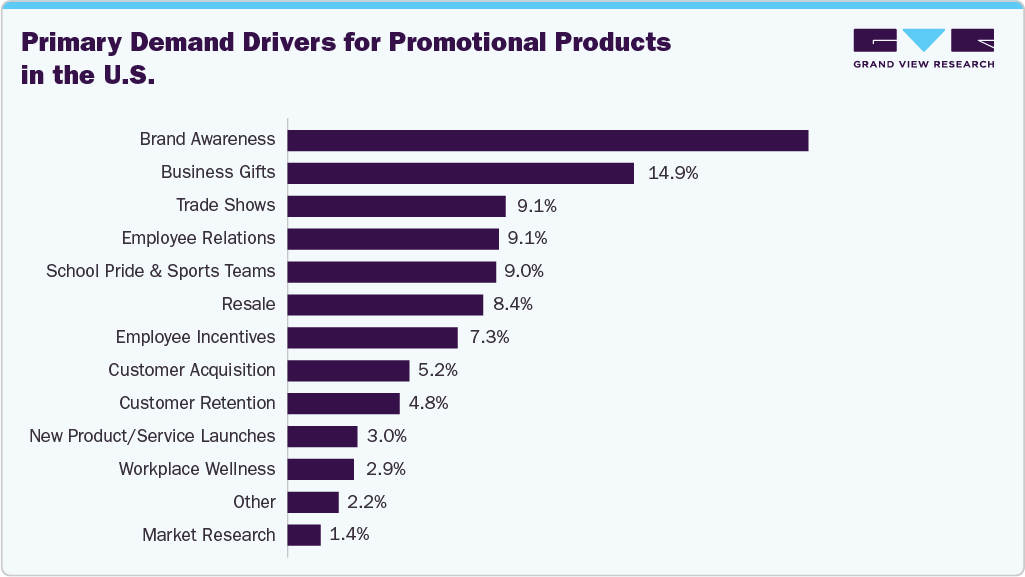
Promotional products continue to serve primarily as a brand-building and relationship-management tool, with brand-awareness programs accounting for the largest share of industry sales volume at 22.5%. This highlights that businesses continue to view branded merchandise as an effective channel for increasing visibility, strengthening brand recall, and maintaining customer engagement.
Beyond traditional brand awareness initiatives, business gifts (14.9%) and trade shows/events (9.3%) are significant contributors to demand, reflecting the continued importance of promotional merchandise in B2B relationship-building, lead generation, and event-based marketing activities. As companies increasingly seek cost-effective alternatives to traditional advertising, promotional products provide repeated brand exposure through tangible, frequently used items. The strong contribution from employee-focused programs, including employee relations (9.1%), employee incentives (7.3%), and workplace wellness initiatives (2.9%), indicates a structural shift in the industry toward internal engagement applications. Companies are increasingly leveraging branded merchandise to support employee recognition, workplace culture, onboarding, and retention initiatives, expanding demand beyond customer-facing marketing.
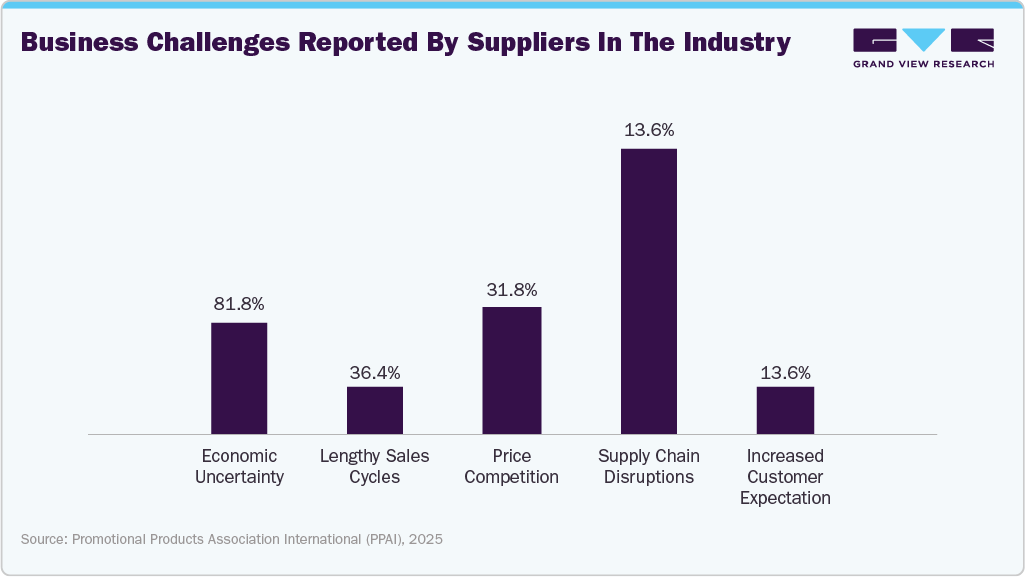
One of the key restraints affecting the U.S. promotional products industry is the rising cost of raw materials, international sourcing, and supply chain disruptions, which continue to pressure manufacturers, distributors, and corporate buyers. A significant share of promotional products, including apparel, drinkware, writing instruments, bags, and technology accessories, is sourced from overseas, making the industry vulnerable to freight cost fluctuations, longer lead times, and geopolitical uncertainties. These challenges can increase production costs, delay deliveries, and reduce product availability, particularly during peak promotional seasons.
 To learn more about this report, Download Free Sample Report
The impact of these challenges has become increasingly evident in recent years. According to the Promotional Products Association International (PPAI), tariffs and higher import costs have emerged as major concerns for suppliers and distributors, prompting many companies to adjust pricing strategies and diversify sourcing locations. In addition, inflationary pressures have led businesses to reduce discretionary marketing budgets, affecting demand for premium promotional merchandise. Although suppliers are expanding domestic sourcing and inventory management capabilities, continued cost volatility and procurement challenges remain significant restraints on the long-term growth of the U.S. promotional products industry.
Analyst Perspective
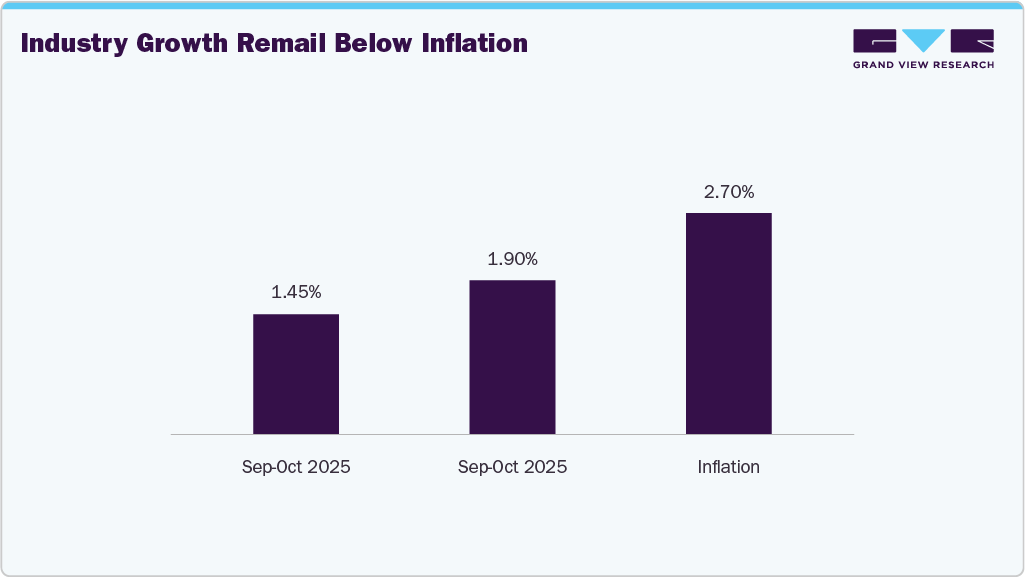
The U.S. promotional products industry concluded 2025 in a phase of stabilization rather than accelerated growth. According to PPAI Research’s bi-monthly flash survey of the PPAI 100 cohort, industry revenue increased by 1.9% year-over-year during November and December, reflecting a modest improvement over the 1.45% growth recorded in September and October. Despite this uptick, overall growth continued to lag the prevailing inflation rate of 2.7%, while tariff-driven cost volatility remained a persistent challenge across the supply chain.
A distinct divergence in performance has also emerged across the value chain. Distributors continue to demonstrate stronger and more consistent top-line growth than suppliers, supported by program-based revenue streams, greater pricing flexibility, and closer control over client budgets. In contrast, suppliers are absorbing a disproportionate share of procurement-related cost pressures and margin compression, with business performance increasingly driven by execution excellence and pricing discipline rather than a broad-based recovery in underlying demand.
 To learn more about this report, Download Free Sample Report
Channel Performance at a Glance
Metric (Nov–Dec 2025)
Suppliers
Distributors
Reporting YoY revenue growth
49%
83%
Reporting revenue decline
32%
10%
Facing higher procurement costs
64%
52%
Reporting no material margin impact
40%
59%
Reporting margin improvement
14%
17%
Revenue Performance Distribution
Revenue outcomes diverged sharply by channel. 38% of distributors reported year-over-year growth, versus just under half of suppliers, with nearly a third of suppliers reporting outright declines, most of them moderate rather than severe.
Cost and Margin Pressure
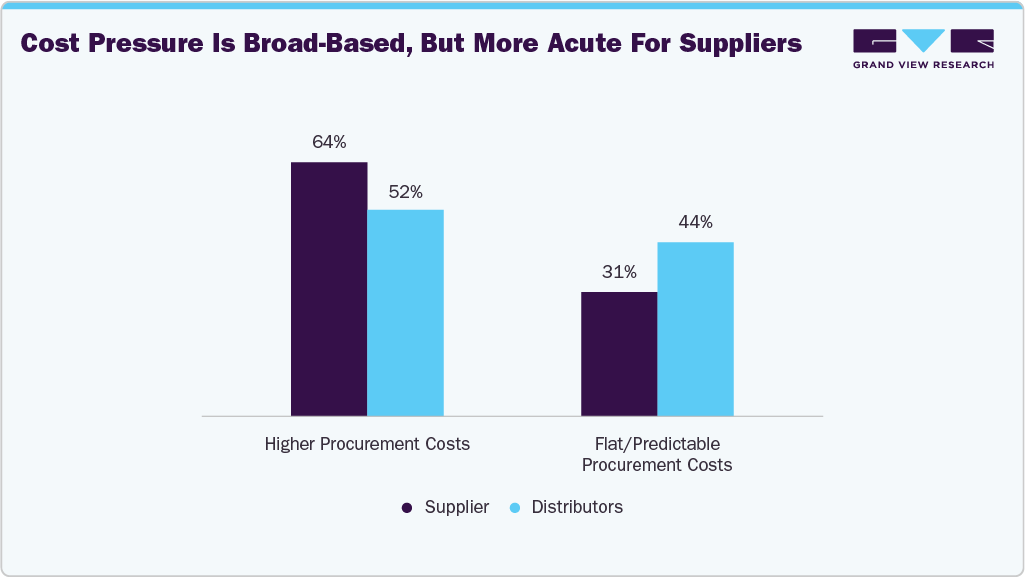
Procurement costs rose across both channels, but the burden fell disproportionately on suppliers: 64% reported higher input costs in November and December, compared with 52% of distributors. Only about a third of suppliers saw costs hold flat, versus 44% of distributors, underscoring suppliers’ more limited ability to pass through or absorb tariff- and freight-related cost inflation.
 To learn more about this report, Download Free Sample Report
The margin picture reinforces this divide. Nearly half (46%) of suppliers reported margin declines attributable to inflation, 44% slight, 2% significant, while only 14% achieved margin improvement. Distributors fared better: 59% reported no material margin impact, and 17% posted improvements, with declines concentrated in modest, manageable territory (24%). This suggests distributors’ closer proximity to end-client pricing affords greater room to protect profitability even as underlying costs rise.
Strategic Implications
-
Pricing discipline has emerged as the primary driver of profitability, outweighing demand growth as the key determinant of channel performance.
-
Suppliers continue to operate in a structurally constrained margin environment and should prioritize cost pass-through mechanisms, supply chain diversification, and tariff mitigation strategies to preserve profitability.
-
Distributors remain better positioned to translate stable demand into revenue growth; however, they should not anticipate near-term cost relief, as more than half continue to experience rising procurement costs.
- With industry growth still lagging inflation, real (inflation-adjusted) market expansion remains negative. A sustained recovery will depend on either a meaningful easing of cost pressures or a stronger acceleration in top-line demand.
Brand Market Share Insight
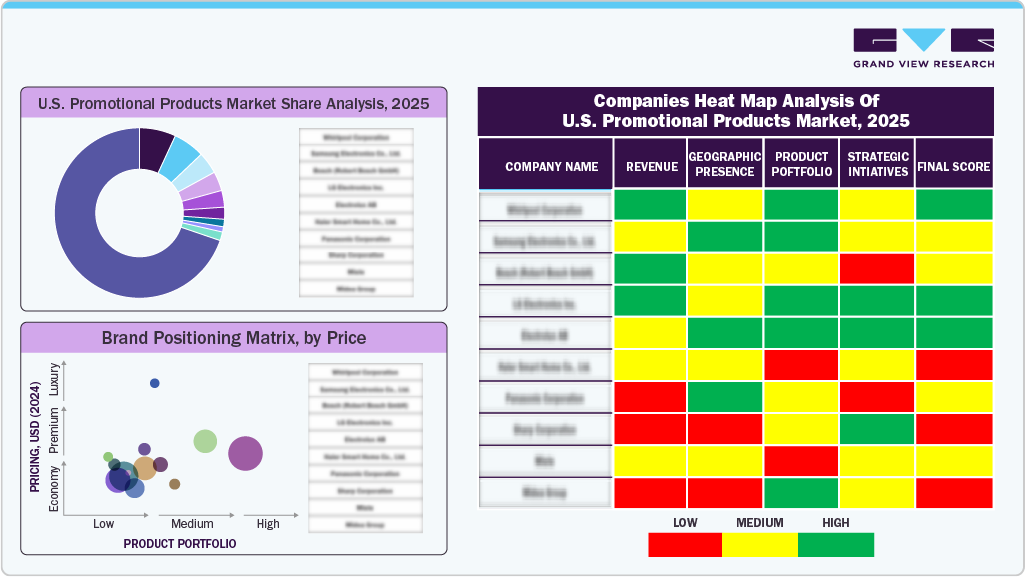
The U.S. promotional products industry is characterized by strong competition among established distributors, branding solution providers, and customized merchandise suppliers. Leading companies, including HALO Branded Solutions, Proforma, Staples Promotional Products, Bensussen Deutsch & Associates (BDA), and BAMKO, compete through extensive supplier networks, nationwide distribution capabilities, digital procurement platforms, and comprehensive customization services. Market participants continue to expand their portfolios with sustainable merchandise, premium corporate gifts, technology accessories, and on-demand personalization solutions to strengthen customer relationships and increase repeat business across corporate, healthcare, education, retail, and hospitality sectors.
 To learn more about this report, Download Free Sample Report
The market is also witnessing growing investment in e-commerce platforms, print-on-demand production, and integrated fulfillment services. Companies such as Custom Ink, American Solutions for Business (ASB), iPROMOTEu, Cintas Promotional Products, and Boundless are enhancing online ordering capabilities, inventory management, and data-driven branding solutions to improve customer experience. In addition, rising demand for eco-friendly promotional products, employee engagement programs, and corporate gifting initiatives is encouraging suppliers to expand sustainable product offerings and digital customization technologies, supporting long-term growth across the U.S. promotional products industry.
Product Insights
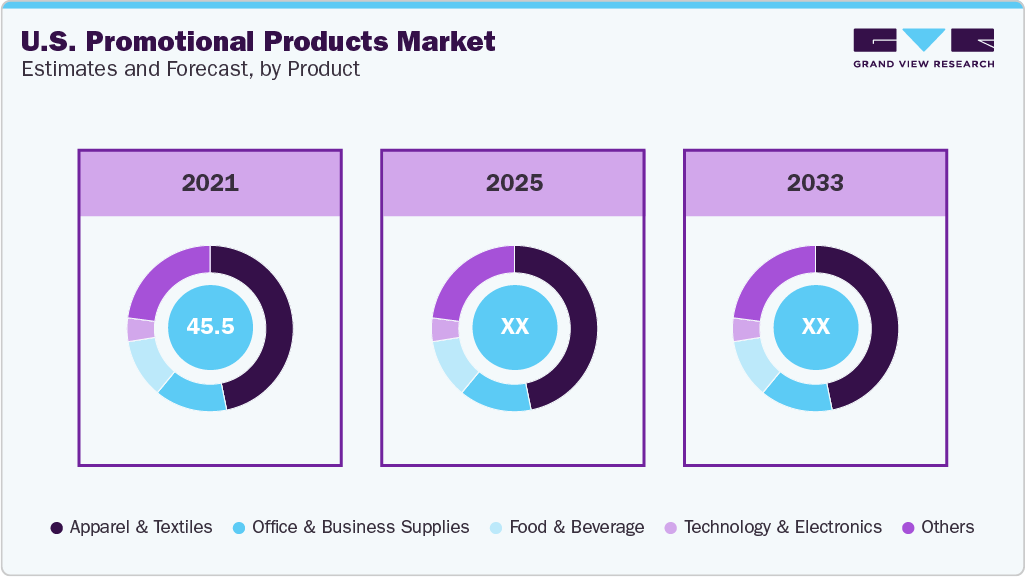
The apparel & textiles segment led the market with the largest revenue share of 47.5% in 2025. This segment comprises branded wearable and fabric-based merchandise customized with company logos, slogans, or promotional messages for corporate marketing, employee branding, customer engagement, trade shows, sponsorships, and promotional campaigns. The category includes T-shirts, polo shirts, hoodies, jackets, caps, uniforms, and other textile products that provide long-term brand visibility through frequent use. Growing demand for premium-quality apparel, sustainable fabrics, and personalized designs is further strengthening growth in the segment as businesses increasingly prioritize durable promotional merchandise over disposable giveaways. Advances in digital printing, embroidery, and on-demand customization have also enabled faster production and greater product personalization.
 To learn more about this report, Download Free Sample Report
The technology & electronics segment is anticipated to grow at the fastest CAGR of 4.3% from 2026 to 2033. The segment includes branded electronic products such as wireless chargers, power banks, Bluetooth speakers, USB flash drives, headphones, phone stands, and other mobile accessories that combine everyday functionality with long-term brand exposure. Rising digitalization, hybrid work models, and increasing reliance on mobile devices have encouraged businesses to adopt technology-based promotional merchandise for employee onboarding, corporate gifting, customer loyalty programs, and trade shows. Compared with conventional giveaways, technology products offer higher perceived value and extended consumer usage, improving brand recall.
End Use Insights
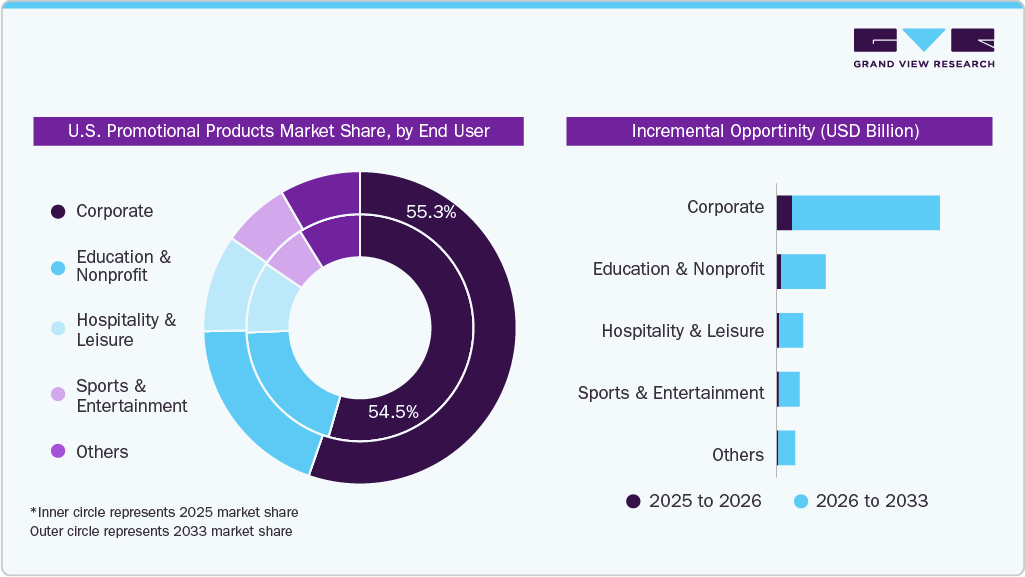
The corporate segment led the market with the largest revenue share of 54.5% in 2025. Businesses across industries increasingly utilize customized promotional merchandise as a strategic marketing tool to strengthen brand awareness, customer relationships, and employee engagement. The segment includes products distributed through corporate gifting programs, employee onboarding, trade shows, conferences, product launches, customer loyalty campaigns, and internal recognition initiatives. Organizations are prioritizing high-quality promotional products such as branded apparel, drinkware, technology accessories, office supplies, and eco-friendly merchandise that provide long-term brand exposure and practical value. The growing adoption of hybrid work models has further increased demand for customized welcome kits and employee appreciation gifts.
 To learn more about this report, Download Free Sample Report
The sports & entertainment segment is anticipated to grow at the fastest CAGR of 3.9% from 2026 to 2033. The segment is driven by increasing demand for branded merchandise that enhances fan engagement, event promotion, and sponsorship activation across professional sports leagues, entertainment companies, concerts, festivals, and live events. Organizations increasingly utilize customized apparel, caps, drinkware, bags, technology accessories, and collectibles featuring team logos, event branding, and licensed intellectual property to strengthen brand visibility and generate additional revenue. Growing investments in experiential marketing and fan-focused promotional campaigns are further supporting demand for premium merchandise.
Distribution Channel Insights
The offline segment led the market with the largest revenue share of 73.7% in 2025. The segment includes promotional product distributors, promotional consultants, wholesalers, specialty stores, and trade shows where businesses can evaluate product quality, customization options, and branding solutions before placing bulk orders. Many organizations continue to prefer offline procurement for large corporate gifting programs, employee recognition initiatives, conferences, and marketing campaigns due to personalized consultation, product sampling, and dedicated account management. Established distributor networks also provide sourcing, warehousing, inventory management, and fulfillment services that simplify large-volume orders.
 To learn more about this report, Download Free Sample Report
The online segment is anticipated to grow at the fastest CAGR of 3.7% from 2026 to 2033. The segment includes company websites, distributor e-commerce platforms, online promotional product marketplaces, and digital procurement portals that enable businesses to efficiently browse, customize, and order branded merchandise. Growing adoption of digital procurement, self-service design tools, and print-on-demand capabilities is encouraging organizations of all sizes to shift toward online purchasing. Businesses increasingly value features such as real-time product customization, instant pricing, virtual proofs, lower minimum order quantities, and faster order fulfillment. The expansion of hybrid work environments and geographically distributed workforces has further accelerated demand for online ordering and direct-to-recipient fulfillment services.
Key U.S. Promotional Products Companies:
-
HALO Branded Solutions, Inc.
-
Staples Promotional Products
-
Proforma, Inc.
-
Custom Ink, LLC
-
Bensussen Deutsch & Associates, LLC (BDA)
-
BAMKO, LLC
-
American Solutions for Business, Inc. (ASB)
-
iPROMOTEu, LLC
-
Cintas Corporation
-
Boundless Network, Inc.
Competitive Benchmarking
Category
Operating Strategies
Competitive Edge
Weakness
Established Players: HALO Branded Solutions, Staples Promotional Products, Proforma, Bensussen Deutsch & Associates (BDA), BAMKO, American Solutions for Business, Cintas Promotional Products
Expand enterprise accounts through long-term corporate contracts and strategic partnerships, strengthen supplier and distribution networks, invest in digital procurement platforms, inventory management, fulfillment, and sustainable product portfolios, and offer integrated branding, customization, warehousing, and logistics services across multiple industries.
Strong relationships with global suppliers and large corporate customers, nationwide distribution and fulfillment capabilities, broad product portfolios, economies of scale in sourcing and customization, extensive industry experience, and strong brand reputation.
High dependence on imported merchandise, exposing operations to tariffs and supply chain disruptions, higher operating costs, pricing pressure from online competitors, slower adoption of niche product trends due to larger organizational structures, and margin pressure from increasing procurement and logistics costs.
Emerging & Digital-Focused Players: Custom Ink, iPROMOTEu, Boundless Network
Focus on e-commerce-driven ordering, online design tools, print-on-demand production, and personalized promotional merchandise, target SMEs and mid-sized businesses through digital marketing, invest in technology-enabled procurement, fast fulfillment, and sustainable product offerings; expand self-service customization platforms and direct online sales.
Agile business models with advanced digital customization capabilities, faster turnaround times, lower minimum order quantities, strong online customer experience, ability to quickly introduce new products and serve growing demand for personalized promotional merchandise.
Smaller enterprise customer base and supplier network compared to established competitors, lower purchasing power, greater reliance on online customer acquisition, limited international sourcing scale, intense competition from larger distributors with broader fulfillment capabilities and stronger corporate relationships.
Recent Developments:
-
In February 2026, Custom Ink launched its first major brand refresh in 15 years under the "Ink Is More Than You Think" platform, expanding its catalog to more than 10,000 customizable products, including promotional merchandise and hard goods. The company also doubled its hard goods portfolio and strengthened its capabilities in corporate gifting, employee engagement, and branded merchandise solutions, reflecting growing demand for comprehensive promotional products.
-
In October 2025,HALO Branded Solutions acquired What's Happening Promotions, a Florida-based promotional marketing agency. The acquisition expands HALO's branded merchandise, corporate apparel, and promotional marketing capabilities while strengthening its nationwide customer network. The acquired company continues to operate under the name What's Happening Promotions Powered by HALO, allowing HALO to enhance its creative services, technology platform, sourcing capabilities, and operational scale for enterprise customers.
U.S. Promotional Products Market Report Scope
Report Attribute
Details
Market size in 2025
USD 27.1 billion
Estimated market size in 2026
USD 27.8 billion
Projected market size by 2033
USD 34.9 billion
Growth rate
CAGR of 3.3% from 2026 to 2033
Base year for estimation
2025
Historical data
2021 - 2025
Forecast period
2026 – 2033
Quantitative units
Revenue in USD million/billion, and CAGR from 2026 to 2033
Report coverage
Revenue forecast, company ranking, competitive landscape, growth factors, and trends
Segments covered
Product, end use, distribution channel
Country scope
U.S.
Key companies profiled
HALO Branded Solutions, Inc.; Staples Promotional Products; Proforma, Inc.; Custom Ink, LLC; The Pokémon Company International, Inc.; Bensussen Deutsch & Associates, LLC (BDA); BAMKO, LLC; American Solutions for Business, Inc. (ASB); iPROMOTEu, LLC; Cintas Corporation; Boundless Network, Inc.
Customization scope
Free report customization (equivalent up to 8 analysts working days) with purchase. Addition or alteration to country, regional & segment scope.
Pricing and purchase options
Avail customized purchase options to meet your exact research needs. Explore purchase options
U.S. Promotional Products Market Report Segmentation
This report forecasts revenue growth at country levels and provides an analysis of the latest trends and opportunities in each of the sub-segments from 2021 to 2033. For this study, Grand View Research has segmented the U.S. promotional products market based on product, end use and distribution channel.
-
Product Outlook (Revenue, USD Billion, 2021 - 2033)
-
Apparel & Textiles
-
Office & Business Supplies
-
Food & Beverage
-
Technology & Electronics
-
Others
-
-
End Use Outlook (Revenue, USD Billion, 2021 - 2033)
-
Corporate
-
Education & Nonprofit
-
Hospitality & Leisure
-
Sports & Entertainment
-
Others
-
-
Distribution Channel Outlook (Revenue, USD Billion, 2021 - 2033)
-
Offline
-
Online
-
Research Methodology
The U.S. promotional products market figures in this report are based on a proven research process that combines executive interviews with secondary research from proprietary databases, company filings, and recognized regulatory and institutional sources. Market size is built through value-chain sizing—reconciling supply-side and demand-side estimates—and triangulated with bottom-up and top-down approaches. Every estimate passes multiple levels of expert validation before publication, with each U.S. promotional products segment quantified using the revenue-capture definitions in the table below.
Segment Definition
Segment - Format
Revenue capture definition
Apparel & Textile
Promotional merchandise is made from textile materials that are customized with a company's logo, brand name, slogan, or artwork for marketing, employee branding, events, and corporate gifting. This segment includes T-shirts, polo shirts, jackets, caps, hoodies, uniforms, towels, and other wearable or fabric-based promotional products.
Office & Business Supplies
Promotional products designed for workplace, educational, and administrative use that are customized with corporate branding to enhance brand visibility and customer engagement. This segment includes pens, notebooks, calendars, planners, folders, sticky notes, desk accessories, and other office-related merchandise.
Food & Beverage
Promotional products intended for food consumption or beverage use that are branded for marketing campaigns, corporate gifts, hospitality, and events. This segment includes drinkware such as mugs, tumblers, water bottles, and cups, as well as packaged snacks, gift baskets, and other branded food and beverage items.
Technology & Electronics
Promotional merchandise incorporating electronic or technology-related functionality that is customized with corporate branding for business promotion and customer engagement. This segment includes power banks, wireless chargers, Bluetooth speakers, headphones, phone accessories, and other electronic promotional products.
Others
Promotional products are not classified under apparel, office supplies, food & beverage, or technology that are customized with company branding for advertising, promotional campaigns, and corporate gifting. This segment includes bags, umbrellas, keychains, badges, awards, wellness products, travel accessories, outdoor products, and other specialty promotional merchandise.
Estimation Model
Each layer progressively narrows the population pool and applies a conversion rate to arrive at addressable revenue.
Step Number
Layer
Guiding Question
Description
01
Promotional Products Buyer Base Layer
Who purchases promotional products?
Begin with the U.S. base of organizations that utilize promotional products for branding, advertising, and employee recognition. Include corporations, (SMEs), educational institutions, hospitality companies, and event management firms. Consider buyers across marketing, sales, procurement, and corporate communications departments to estimate the total addressable promotional products buyer base.
02
Product Accessibility & Distribution Layer
Who has access to promotional products?
Filter the eligible buyer base using the penetration of promotional product distributors, suppliers, company stores, wholesalers, and direct-to-business sales channels. Consider product availability, supplier networks, customization capabilities, e-commerce accessibility, inventory management, and nationwide distribution infrastructure to determine the addressable promotional products market.
03
Active Purchasing & Engagement Layer
Who actively purchases promotional products?
Apply purchasing and campaign adoption rates among organizations actively investing in branded merchandise. Consider corporate gifting, employee onboarding, customer loyalty programs, sponsorships, and employee recognition initiatives. Evaluate factors such as marketing budgets, purchasing frequency, sustainability preferences, and customization requirements to estimate active promotional products buyers.
04
Monetisation Layer
How much revenue is generated?
Multiply annual purchase frequency and average organizational spending across promotional product categories, including apparel & textiles, office & business supplies, and other promotional merchandise. Include revenue generated through distributors, promotional consultants, e-commerce platforms, and direct-to-business sales channels to estimate the total U.S. promotional products market revenue.
Delivered Customizations
This report has been delivered with the following In-depth customizations
Client Request
Customization Delivered
Value Adds
Corporate Gifting & Branded Merchandise Analysis
Conducted a detailed assessment of corporate gifting, employee recognition merchandise, customer giveaways, trade show products, and promotional campaigns by evaluating purchasing behavior, product innovation, customization trends, sustainability initiatives, pricing strategies, and demand across key end-user industries including corporate, healthcare, education, retail, and hospitality.
Helps stakeholders identify high-growth product categories, optimize promotional merchandise portfolios, strengthen customer engagement strategies, and capitalize on the growing demand for premium and sustainable branded products.
Promotional Product Categories & End-Use Demand Assessment
Evaluated demand across apparel & textiles, office & business supplies, food & beverage products, technology & electronics, and other promotional merchandise by assessing corporate purchasing patterns, branding objectives, campaign frequency, product preferences, and customization requirements across organizations of different sizes.
Provides insights into evolving customer preferences, supports product portfolio diversification, identifies emerging business opportunities, and enables suppliers to align product offerings with changing corporate marketing and branding needs
Distribution, Customization & Digital Procurement Assessment
Assessed emerging trends in e-commerce procurement, print-on-demand services, distributor networks, supplier partnerships, fulfillment capabilities, inventory management, personalization technologies, and sustainable sourcing. The analysis also evaluated digital ordering platforms, online customization tools, and direct-to-business sales models shaping the U.S. promotional products industry.
Supports long-term growth strategies by identifying digital transformation opportunities, improving distribution efficiency, enhancing customer purchasing experiences, optimizing fulfillment operations, and strengthening competitive positioning within the U.S. promotional products industry.
Frequently Asked Questions About This Report
Key players in the U.S. promotional products market HALO Branded Solutions, Inc., Staples Promotional Products, Proforma, Inc., The Pokémon Company International, Inc., Custom Ink, LLC, Bensussen Deutsch & Associates, LLC (BDA), BAMKO, LLC, American Solutions for Business, Inc. (ASB), iPROMOTEu, LLC, Cintas Corporation, Boundless Network, Inc.
Offline distribution channels accounted for the largest market share, at 73.7%, in 2025.
The U.S. promotional products market size was estimated at USD 27.1 billion in 2025 and is expected to reach USD 27.8 billion in 2026.
The U.S. promotional products market is expected to grow at a compound annual growth rate of 3.3% from 2026 to 2033, reaching USD 34.9 billion by 2033.
Apparel & textiles segment held the largest market share of 47.5% in 2025.
The U.S. promotional products market is being driven by rising corporate investments in branding, customer engagement, and employee recognition initiatives. Businesses are increasingly adopting customized merchandise such as apparel, drinkware, bags, writing instruments, and technology accessories as cost-effective marketing tools that provide long-term brand visibility compared to traditional advertising.
Corporate accounted for the largest market share of 54.5% in 2025.
About the Author(s)
Clothing, Footwear & Accessories Research Team
Consumer Goods · Clothing, Footwear & AccessoriesThis report was authored by the clothing, footwear & accessories research team at Grand View Research - comprising two research analysts, one senior research analyst, and one industry expert - with specialized expertise in the clothing, footwear & accessories segment of the consumer goods industry. All findings are based on proprietary consumer goods databases, executive interviews, and regulatory analysis, subject to internal peer review prior to publication.
Last Updated:
Speak to Analyst

Customize this report to your needs - add regions, segments, or data points, with 20% free customization.
Or view our licence options:


ISO 9001:2015 & 27001:2022 Certified
We are GDPR and CCPA compliant! Your transaction & personal information is safe and secure. For more details, please read our privacy policy.


