
- Home
- »
- Next Generation Technologies
- »
-
Virtual Cards Market Size, Share & Growth Report, 2033GVR Report cover
![Virtual Cards Market (2026 - 2033)Report]()
Virtual Cards Market (2026 - 2033)
Size, Share & Trends Analysis Report By Card Type (Debit, Credit), By Product Type (B2B Virtual Cards, B2C Remote Payment Virtual Cards, C2B POS Virtual Cards), By Application (Consumer Use, Business Use), By Region, And Segment Forecasts
Market Size, 2025
$22.9BMarket Estimate, 2026
$27.7BMarket Forecast, 2033
$112.9BCAGR, 2026–2033
22.2%Virtual Cards Market Summary
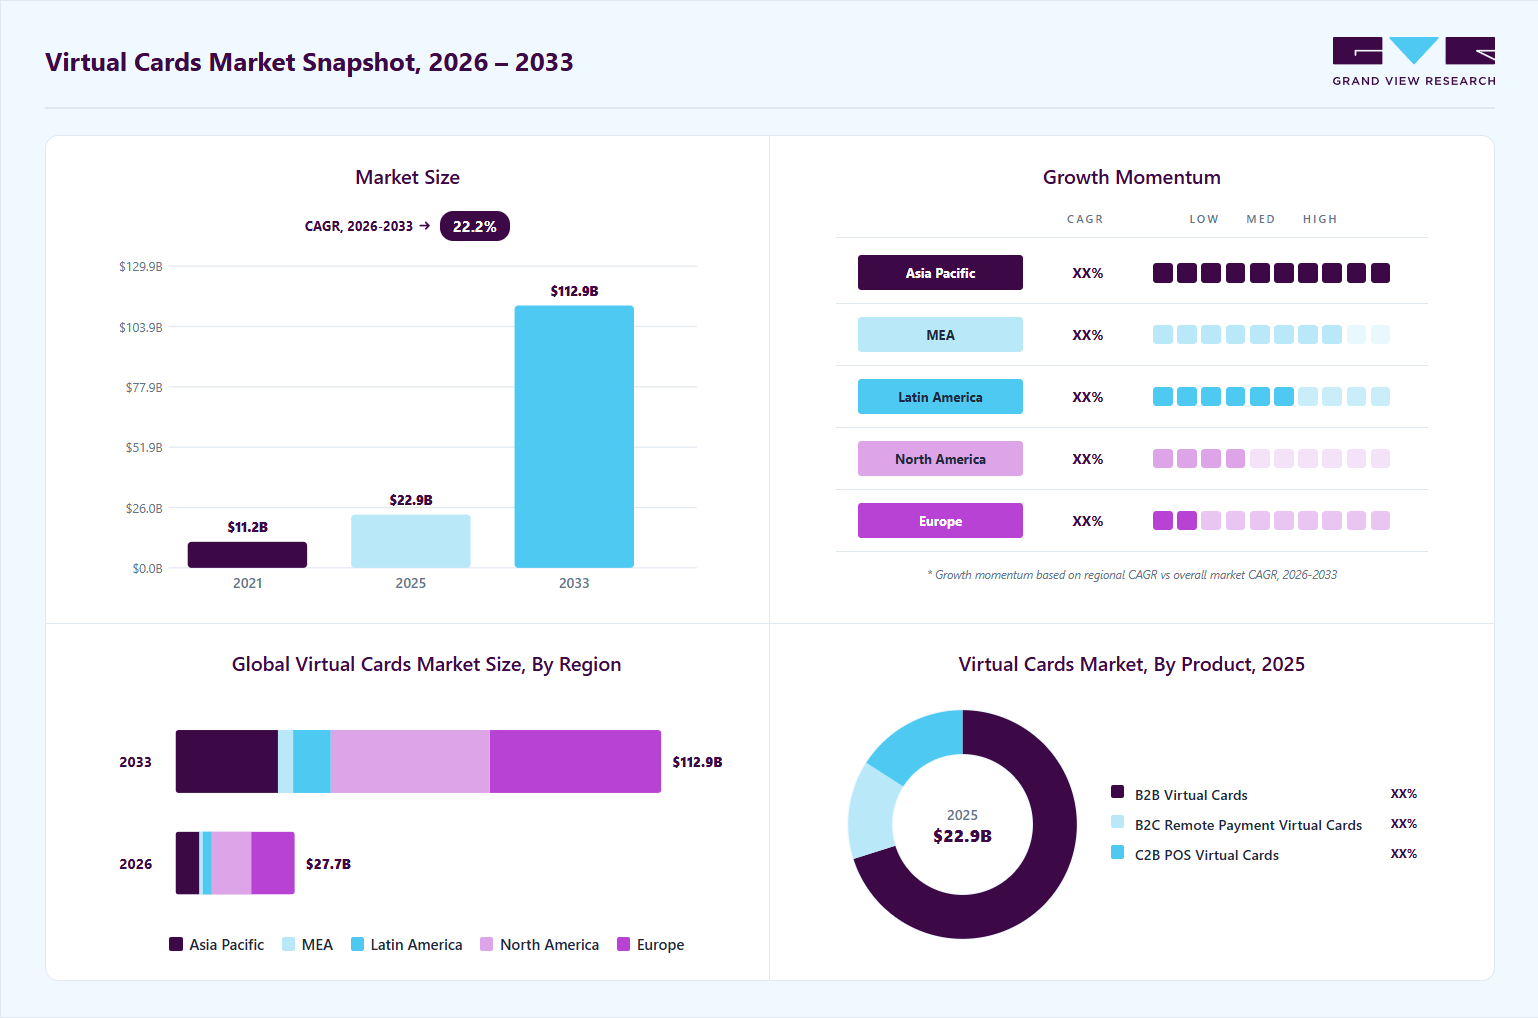
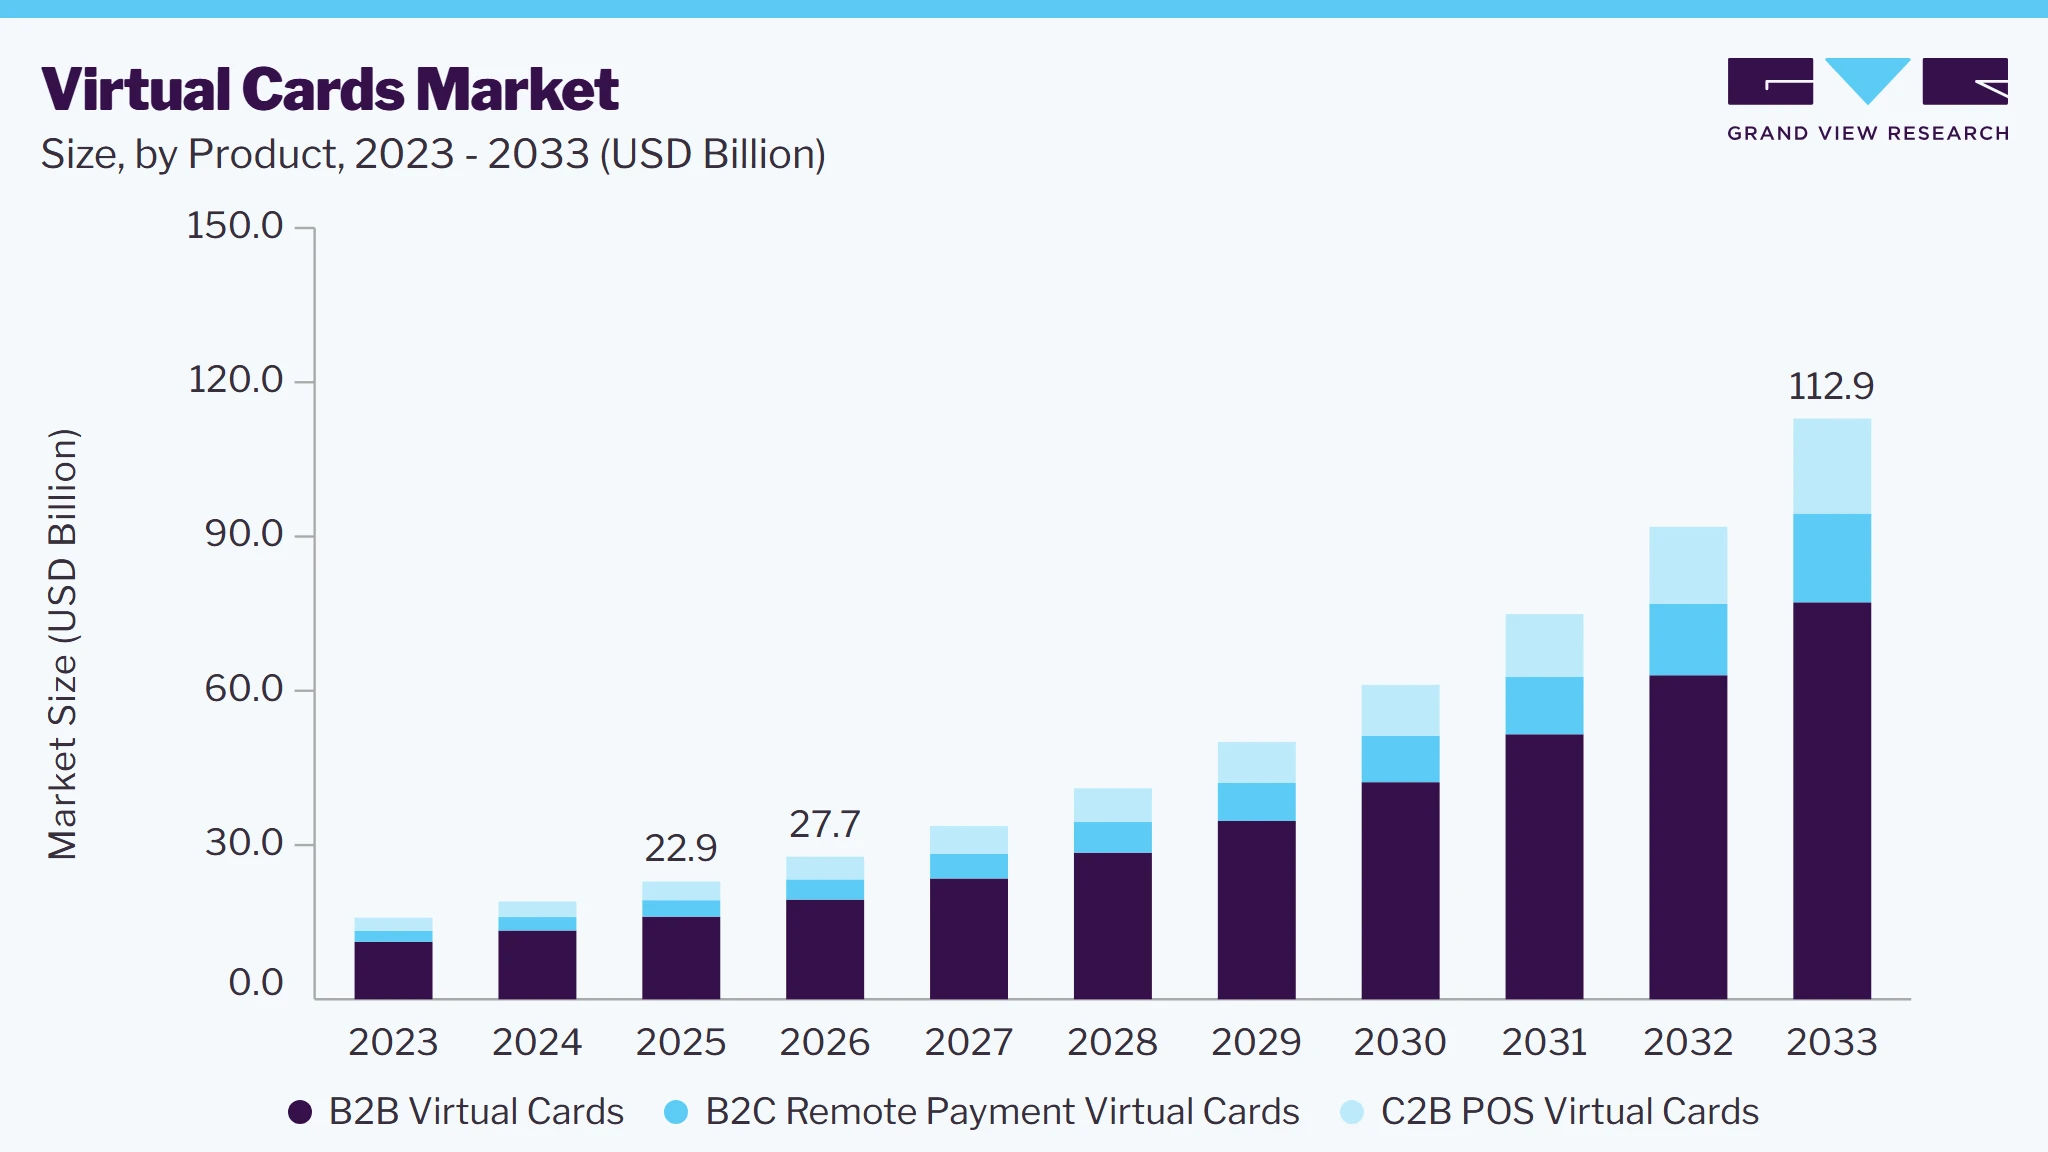
The global virtual cards market size was valued at USD 22.9 billion in 2025 and is projected to grow from USD 27.7 billion in 2026 to USD 112.9 billion by 2033, growing at a CAGR of 22.2% from 2026 to 2033. North America held a significant share in the virtual cards market with a revenue share of 33.0% in 2025. The growing number of digital transactions across the globe is projected to drive the demand for various types of virtual cards, thereby contributing to market growth.
Key Market Trends & Insights
- By card type: Credit card segment led the market with the largest revenue share of 60.8% in 2025.
- By product type: The B2B virtual cards segment led the market with the largest revenue share of 70.1% in 2025.
- By application: Business use segment led the market with the largest revenue share of 68.4% in 2025.
Regional Highlights
- Largest regional market: North America (33.0% revenue share, 2025)
- By country: The U.S. held the largest market share in 2025.
Market Size & Forecast
- Market size in 2025: USD 22.9 Billion
- Estimated market size in 2026: USD 27.7 Billion
- Projected market size by 2033: USD 112.9 Billion
- CAGR (2026-2033): 22.2%
For instance, in May 2021, according to a report published by MasterCard Payment Index, 93% of the surveyed consumers preferred emerging payment trends such as biometrics, digital currencies, and QR code in addition to contactless payment. Hence, payment providers are constantly deploying multiple pay and shop solutions for consumers.The demand for virtual cards is anticipated to be driven by the growing need for an extra layer of protection, such as tokenization, in the digital payment gateway system. In addition, tokenization technology within virtual cards offers multiple benefits, such as better user experience, reduced costs on protection, and others for both businesses and customers. Further, by integrating tokenization within these cards, merchants can transfer data between networks while protecting their customer’s vital information. Such factors are anticipated to create a positive outlook for the market during the forecast period.
The growing adoption of smartphones globally is emerging as one of the major factors propelling the adoption of virtual cards. Innovative technological advancements such as 5G are being integrated progressively within smartphones that offer users better customer satisfaction, thereby accentuating the market growth. In addition, growing internet penetration across the globe is leading to a surge in digital payments, thereby creating demand for virtual cards. In June 2022, according to the latest report published by the World Bank, the global internet users have been estimated to be around 60% of the world population.
Governments across the world are constantly encouraging companies that provide secure payment solutions to improve their offerings. For instance, the Ministry of Electronics and Information Technology (MeitY) issued guidelines to States/UTs and Central Ministries/Departments to enhance payment acceptance infrastructure in India. These guidelines are creating opportunities for citizens to pay through a variety of channels such as mobile banking, internet banking, and mobile applications, among others. Such government initiatives are anticipated to create a positive outlook for the market in the near future.
The rising advantages of these cards, such as setting spending limits, canceling and pausing a card at any time, among others, are expected to develop a new set of opportunities for market growth. In addition, virtual cards, unlike physical cards, cannot be lost or stolen. However, the growing concerns over the limited availability of these cards are expected to hamper the market growth during the forecast period. Further, the ever-increasing risk of cyber-attacks and fraud associated with digital payments are also likely to hinder the development of the market.
Market Dynamics
The virtual cards market is experiencing growth driven by increasing digital payment adoption and enterprise payment modernization; however, market expansion continues to face challenges related to merchant acceptance and limitations in payment infrastructure. Many businesses and merchants, particularly within traditional sectors and developing regions, continue to rely on cash transactions, physical cards, and legacy payment systems that may not fully support virtual payment solutions. Limited usability in certain transaction environments and uneven digital payment penetration across regions can restrict broader adoption. Despite these constraints, ongoing advancements in payment infrastructure and increasing digitalization across industries are expected to improve market accessibility and support long-term growth gradually.
The growing shift toward digital payments and cashless economies is driving the expansion of the virtual cards market. Businesses and consumers increasingly prefer digital payment methods because they offer faster transactions, improved convenience, and easier accessibility compared to traditional payment methods. Virtual cards support this shift by enabling instant issuance, secure online transactions, and compatibility with digital wallets and payment platforms, making them well-suited for evolving payment ecosystems. Rising internet penetration and changing consumer payment preferences continue to strengthen adoption globally.
Growing smartphone usage, expanding e-commerce activities, and increased adoption of mobile banking applications are further accelerating demand for virtual cards across multiple industries. The growth of online shopping and higher transaction volumes has increased the need for payment methods that offer both flexibility and security. Virtual cards simplify online purchases while offering better spending control and fraud protection, making them increasingly attractive for consumers and enterprises. These developments are expected to strengthen market growth as digital commerce and electronic payments continue expanding worldwide.
Limited acceptance across certain merchant categories and geographic regions continues to restrict the growth potential of the virtual cards market. Many businesses, particularly small retailers, traditional merchants, and organizations operating with legacy payment infrastructure, still depend heavily on cash payments, physical cards, or conventional banking systems that may not fully support virtual card transactions. Several payment environments, including certain point-of-sale locations and industries with limited digital infrastructure, continue to require physical payment methods, reducing the usability of virtual cards across all transaction scenarios. Lower digital payment penetration in developing regions and uneven adoption of payment technologies further create barriers to widespread implementation, limiting market expansion and slowing adoption rates across some sectors and countries.
Increasing digital transformation initiatives across enterprises are creating substantial opportunities for virtual cards within business payment ecosystems. Organizations are increasingly shifting away from manual payment methods, paper-based invoicing, checks, and conventional corporate cards toward digital payment systems that improve operational efficiency and streamline financial processes. Virtual cards enable businesses to automate payments while providing enhanced visibility into transaction flows, allowing finance teams to reduce processing time, minimize administrative workload, and improve payment accuracy across procurement and supplier management functions.
The growing adoption of accounts payable automation solutions across enterprises is further driving demand for virtual card solutions. Companies increasingly require payment tools that provide stronger control over employee expenses, vendor payments, and procurement spending while maintaining compliance and reducing fraud risks. Features such as customizable spending limits, merchant-specific controls, real-time tracking, and automated reconciliation make virtual cards particularly suitable for modern financial operations. Rising focus on cost optimization and workflow automation across businesses of all sizes is expected to create strong growth opportunities for virtual card adoption in corporate payment systems.
Analyst Perspective
The virtual cards market is positioned for sustained growth as organizations and consumers increasingly transition toward digital-first payment ecosystems that prioritize security, automation, and transaction efficiency. The growing adoption of e-commerce, the rising enterprise focus on accounts payable automation, and the increasing demand for secure online payment methods are accelerating market penetration across both consumer and business segments. Expansion of embedded finance, fintech innovation, and API-driven payment solutions is creating new use cases across procurement, travel, subscription management, and cross-border transactions. Challenges related to merchant acceptance, regulatory complexity, and integration with legacy systems continue to influence adoption rates; however, ongoing improvements in digital payment infrastructure and increasing collaboration between financial institutions and fintech providers are expected to strengthen long-term market opportunities.
Card Type Insights
Based on card type, the credit card segment led the market with the largest revenue share of 60.8% in 2025 and is expected to grow at the fastest CAGR over the forecast period. The segment growth is attributed to the growing concerns about preventing corporate fraud. In addition, businesses have shifted to controlled, centralized, and seamless payment options such as Virtual Credit Cards (VCCs) to mitigate these risks. Moreover, several banks have collaborated with fintech companies to deliver virtual credit cards. For instance, in November 2021, the Bank of Baroda announced its collaboration with OneCard, a fintech-based startup, to provide a virtual credit card that will be delivered in three minutes. This credit card was planned to be offered by BOB Financial Services Limited (BFSL) and controlled by OneCard on VISA's Signature platform.
The debit card segment is expected to grow at a significant CAGR during the forecast period. The segment is expected to be driven by growing net banking users across the globe, which is expected to drive the demand for virtual debit cards. For instance, in May 2022, Google announced the development of two new payment initiatives, such as digital wallets and virtual cards. This launch is aimed at offering enhanced security and greater convenience for its users across the globe.
Product Type Insights
Based on product type, the B2B virtual cards segment led the market with the largest revenue share of 70.1% in 2025. The increased exports and import of goods and services around the world have ramped up the demand for B2B transactions among businesses, which are expected to drive the demand for B2B virtual cards. Companies are integrating virtual cards into their B2B payment processes to improve cash flow, increase security, and facilitate Accounts Payable (AP) automation more smoothly rather than relying on antiquated methods like paper checks. In addition, enabling virtual card acceptance via accounts receivable automation can also boost efficiency and assist businesses in capturing growth opportunities.
The B2C remote payment virtual cards segment is expected to register at the fastest CAGR of 22.6% during the forecast period. Banks provide these cards to their retail clients, which helps retailers in making effective online payments. In addition, these cards are only used for one-time payments and have a specific validity period. The virtual card number, expiration date, and security code (CVV) can be generated by the customer using the bank's website or mobile application.
Application Insights
Based on application, the business use segment led the market with the largest revenue share of 68.4% in 2025. Businesses use virtual cards to make payments online to vendors and suppliers. These cards provide increased security because, unlike traditional credit and debit cards, they cannot be misplaced or stolen. Furthermore, these cards can only be used once or for a limited number of transactions, thereby reducing the possibility of fraud. In the event of any potential fraud, the issuing authority can immediately block the virtual card. Virtual cards can also be used by businesses to pay employee expenses and book corporate travel.
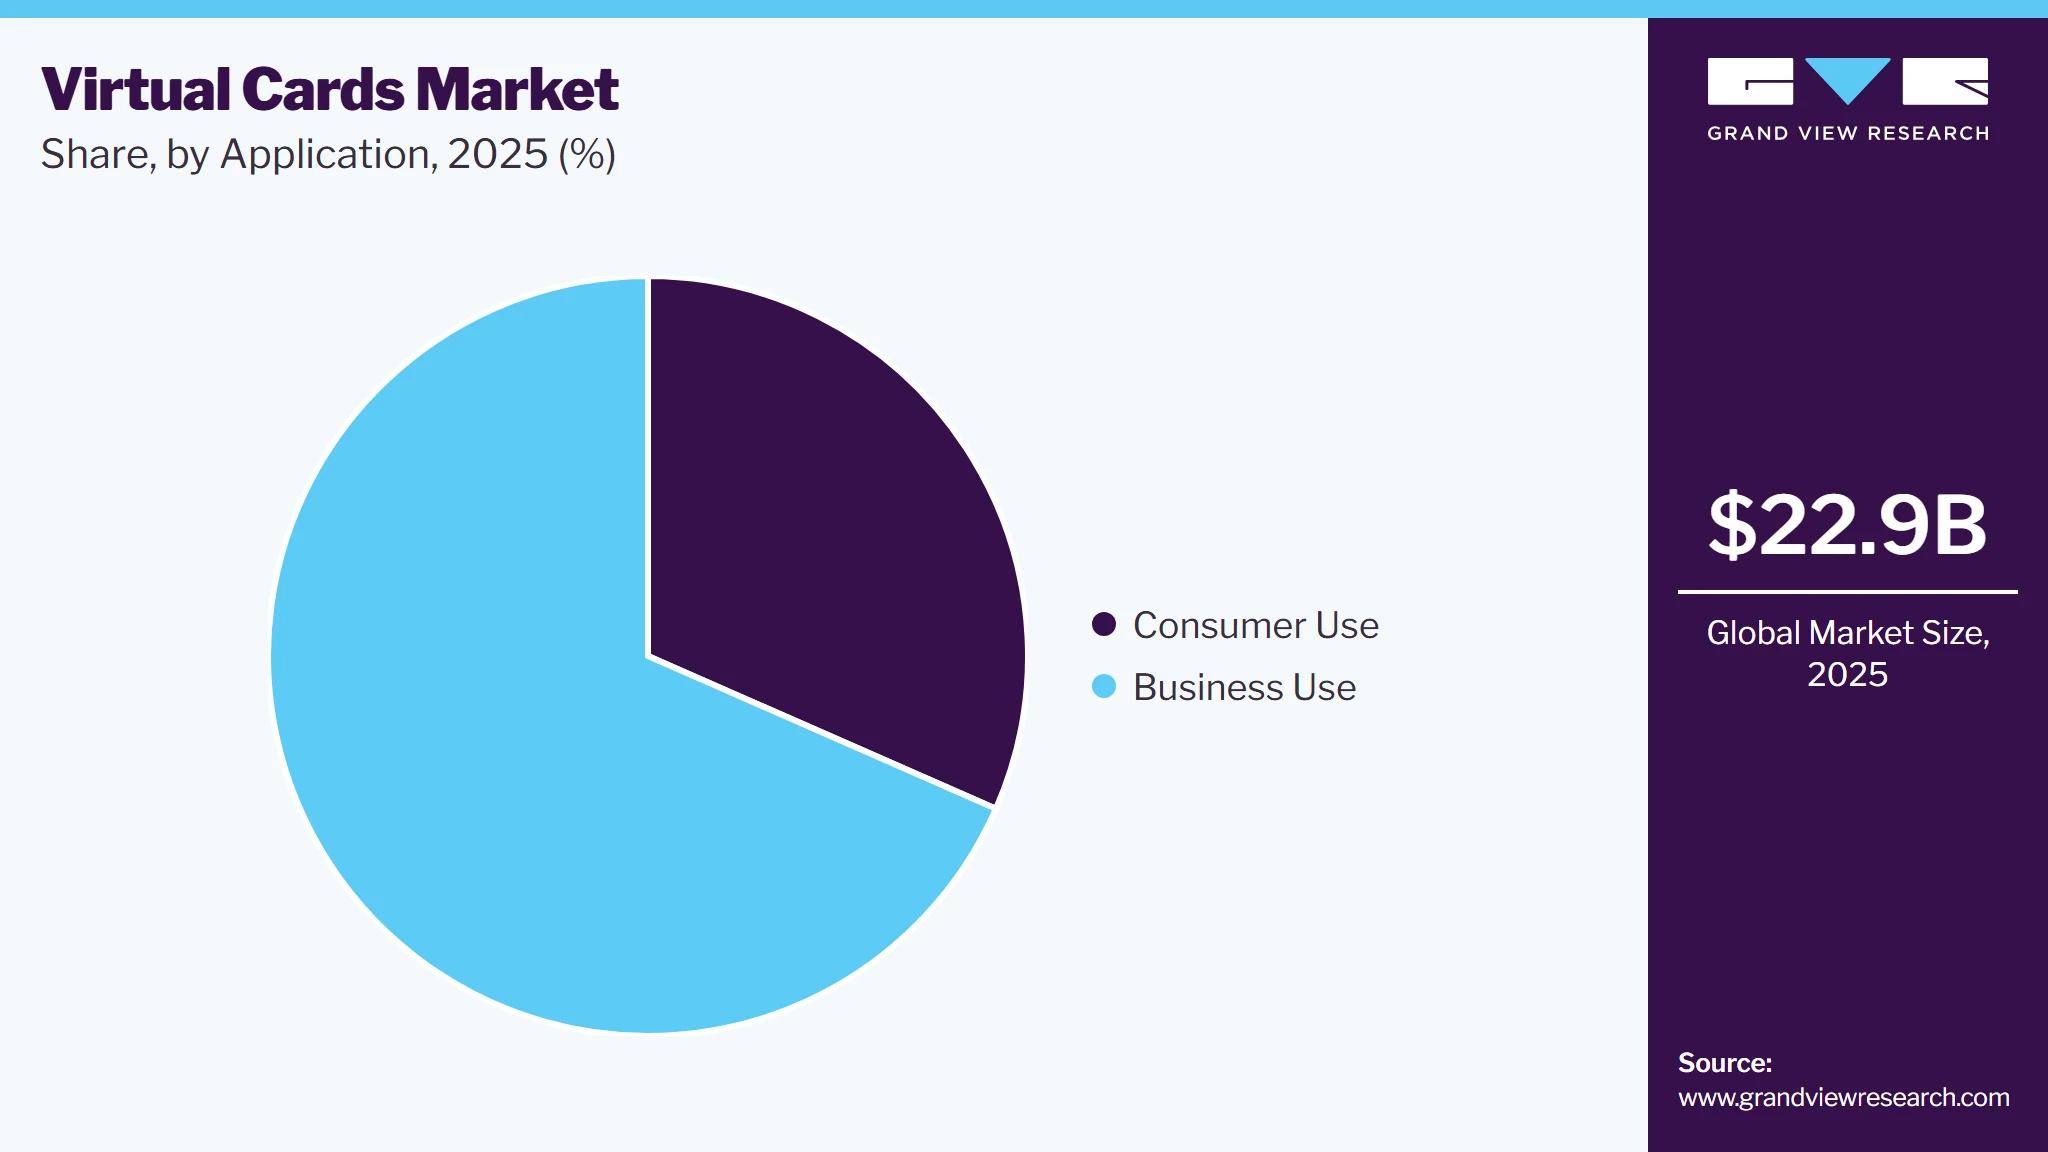
The consumer use segment is projected to grow at the fastest CAGR of 21.8% over the forecast period. The increasing consumer inclination towards digital payments due to the pandemic is among the influential factors that are expected to drive the growth of the segment. Consumers across the globe prefer virtual card payments over cash payments owing to various benefits they offer, such as convenience and accessibility. For instance, according to a global Findex report by the World Bank in 2021, 89% of adults in China had a bank account, of which 82% were engaged in digital payments.
Regional Insights
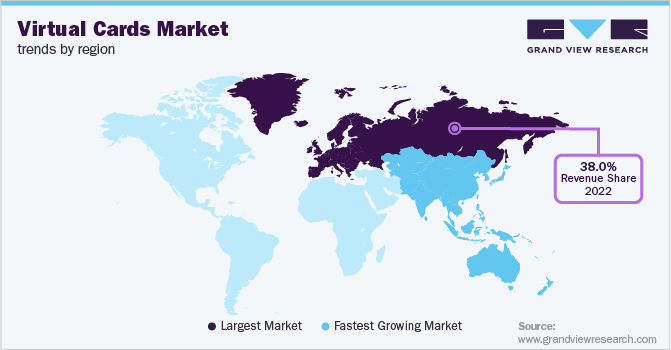
North America held a significant share in the virtual cards market with a revenue share of 33.0% in 2025. The increasing demand for contactless and digital payments drives growth in the market. The COVID-19 pandemic accelerated the shift away from cash and physical card transactions as both consumers and businesses sought safer, more hygienic ways to conduct payments. Virtual cards, which can be used for online and contactless payments without needing a physical counterpart, became a popular option during this time. As consumers have grown accustomed to these forms of payment, their use continues to expand post-pandemic. The convenience of integrating virtual cards into mobile wallets and other digital platforms further enhances their appeal.
U.S. Virtual Cards Market Trends
The virtual cards market in the U.S. held the largest share in the North America region in 2025, due to the enhanced security features offered by it. Each virtual card is typically generated for a specific transaction or merchant, with unique card numbers that reduce the risk of fraud. This "single-use" or "limited-use" functionality ensures that even if card details are compromised, they cannot be reused for fraudulent purposes.
Europe Virtual Cards Market Trends
Europe dominated the virtual cards market with the largest revenue share of 37.28% 2024. The growing preference for cashless payments across European countries such as the UK, Germany, and others is expected to drive the growth of the regional market. Furthermore, several market players are launching innovative products in the European market to attract customers to the adoption of virtual cards. For instance, in April 2021, Stripe launched Stripe Issuing in European nations. Stripe Issuing allows us to create, organize, and disperse virtual and physical payment cards, allowing businesses to have more authority over how their money is spent.
The virtual cards market in the UK is expected to grow at a rapid CAGR during the forecast period, due to the presence of a strong regulatory environment that encourages innovation in financial services. The Financial Conduct Authority (FCA) and other regulatory bodies in the UK have created a conducive framework for fintech companies to develop and deploy digital payment solutions like virtual cards.
The Germany virtual cards market held a substantial market share in 2024, owing to the rising demand for digital payment solutions. This change is largely driven by increased e-commerce activity, accelerated further by the COVID-19 pandemic, which made contactless and online payments a necessity. Consumers in Germany are increasingly turning to secure, flexible, and convenient payment methods, such as virtual cards, that can be used both online and in-store.
Asia Pacific Virtual Cards Market Trends
The virtual cards market in Asia Pacific is anticipated to grow at the fastest CAGR of 22.6% during the forecast period. The regional market growth is attributed to the increasing smartphone penetration in countries such as India, China, and Japan. In addition, the growing smartphone usage in these economies has led to an increasing inclination toward digital payments among consumers, thereby creating more demand for virtual card payment solutions. For instance, in October 2021, according to a report published by Asian Bankers Worldwide, Japan had a 70.6% penetration of digital wallets, which is expected to increase up to 98.6% by 2025.
The Japan virtual cards market is expected to grow at a rapid CAGR during the forecast period, due to the increasing adoption of virtual cards in the corporate. Japanese companies are seeking more efficient ways to handle payments, particularly in managing employee expenses, subscriptions, and online purchases. Virtual cards allow businesses to control and track expenses more effectively, offering the ability to set limits, monitor transactions in real-time, and reduce administrative burdens. This trend is expanding the use of virtual cards beyond consumers to the corporate sector, contributing to overall market growth.
The virtual cards market in China held a substantial market share in 2024, owing to rapid digitization. Platforms like WeChat Pay and Alipay dominate the mobile payment landscape, transforming the country into a largely cashless society. Virtual cards seamlessly integrate with these mobile payment platforms, allowing users to conduct online transactions without needing a physical card.
Key Virtual Cards Company Insights
Some of the key companies in the global market include American Express Company, BTRS Holdings, Inc.,JPMorgan Chase & Co., MasterCard, and others. Organizations are focusing on increasing customer base to gain a competitive edge in the industry. Therefore, key players are taking several strategic initiatives, such as mergers and acquisitions and partnerships with other major companies.
-
Mastercard is a financial services organization known for its payment processing solutions, including credit, debit, and prepaid cards. Mastercard’s virtual card offerings are integrated across its wide range of payment platforms, including consumer wallets, mobile banking apps, and corporate payment systems. For businesses, Mastercard provides virtual cards through its Mastercard InControl and Commercial Card programs, enabling more efficient expense management, secure online procurement, and easier reconciliation for accounts payable processes.
-
American Express Company (Amex) is a provider of financial services including credit card, charge card, and payment solutions. Amex virtual cards are designed for businesses to make secure and flexible payments without using physical cards. These virtual cards allow businesses to generate single-use or limited-use card numbers for specific purchases or vendors, significantly reducing the risk of fraud and unauthorized transactions.
Key Virtual Cards Companies
The following key companies have been profiled for this study on the virtual cards market.
-
American Express Company
-
BTRS Holdings, Inc.
-
Wise Payments Limited
-
JPMorgan Chase & Co.
-
Marqeta, Inc.
-
MasterCard
-
Skrill USA, Inc.
-
Stripe, Inc.
-
WEX, Inc.
-
Adyen
Competitive Benchmarking
Category
Operating Strategies
Competitive Edge
Weakness
Established Players (American Express Company, JPMorgan Chase & Co., Adyen)
- Expand virtual card ecosystems through partnerships with banks, enterprises, fintech firms, payment processors, and ERP providers.
- Invest in embedded finance capabilities, cross-border payment solutions, API-driven card issuance, and enterprise expense management platforms.
- Strong global payment infrastructure, large enterprise customer bases, extensive issuer and merchant networks, and established regulatory expertise.
- Advanced fraud detection capabilities, robust payment processing systems, and strong relationships with financial institutions provide scale advantages.
- Higher operational and compliance costs due to global regulatory requirements and payment security standards.
Emerging Players (BTRS Holdings, Inc., Wise Payments Limited)
- Focus on niche opportunities such as expense automation, embedded finance, cross-border transactions, API-first card issuance, and SME payment solutions.
- Leverage fintech partnerships, developer-friendly platforms, and digital-first customer acquisition strategies to accelerate growth.
- Faster innovation cycles, agile technology infrastructure, and stronger ability to develop customized payment solutions for specific use cases.
- API-driven platforms and cloud-native systems enable quicker integration with enterprises, fintech applications, and digital ecosystems.
- Limited financial resources compared to large payment networks and banks may restrict scaling capabilities.
- Dependence on partnerships and evolving regulatory requirements increases operational risks.
Recent Developments
-
In August 2024, Mastercard partnered with Aquapay to introduce the Mastercard In Control for Business Travel solution in India, aimed at enhancing the efficiency of business travel payments. This innovative virtual card solution allows travel management companies (TMCs) to issue virtual cards for central travel accounts, streamlining payment processes and improving security.
-
In May 2024, HDFC bank launched a virtual credit card named PIXEL in collaboration with Visa. PIXEL is designed to cater to the needs of tech-savvy consumers who prefer seamless and customizable financial solutions. The card comes in two versions-PIXEL Play and PIXEL Go-allowing users to select tailored benefits and offers that align with their spending habits. This innovative offering is fully integrated into HDFC Bank's PayZapp mobile application, which provides a comprehensive suite of features such as card controls, rewards management, and real-time transaction notifications.
Virtual Cards Market Report Scope
Report Attribute
Details
Market size in 2025
USD 22.9 billion
Estimated market size in 2026
USD 27.7 billion
Projected market size by 2033
USD 112.9 billion
Growth rate
CAGR of 22.2% from 2026 to 2033
Base year for estimation
2025
Historical data
2021 - 2024
Forecast period
2026 - 2033
Quantitative units
Revenue in USD million/billion and CAGR from 2026 to 2033
Report coverage
Revenue forecast, company ranking, competitive landscape, growth factors, and trends
Segments covered
Card type, product type, application, region
Regional scope
North America; Europe; Asia Pacific; Latin America; MEA
Country scope
U.S.; Canada; Mexico; Germany; UK; France; China; Japan; India; South Korea; Australia; Brazil; Saudi Arabia; South Africa; UAE
Key companies profiled
American Express Company; BTRS Holdings, Inc.; Wise Payments Limited; JPMorgan Chase & Co.; Marqeta, Inc.; MasterCard; Skrill USA, Inc.; Stripe, Inc.; WEX, Inc.; Adyen
Customization scope
Free report customization (equivalent up to 8 analysts' working days) with purchase. Addition or alteration to country, regional & segment scope.
Pricing and purchase options
Avail customized purchase options to meet your exact research needs. Explore purchase options
Global Virtual Cards Market Report Segmentation
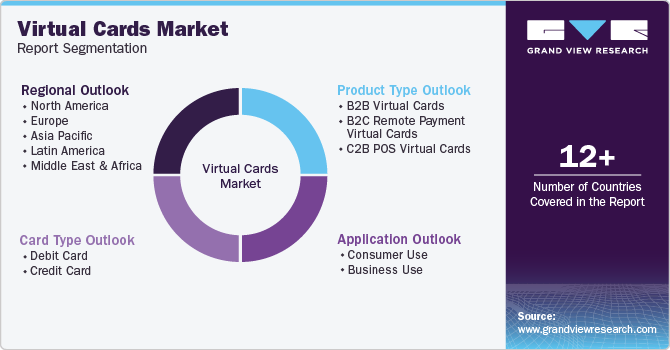
This report forecasts revenue growth at global, regional, and country levels and provides an analysis of the latest industry trends in each of the sub-segments from 2021 to 2033. For this study, Grand View Research has segmented the global virtual cards market report based on card type, product type, application, and region.
-
Card Type Outlook (Revenue, USD Billion, 2021 - 2033)
-
Debit Card
-
Credit Card
-
-
Product Type Outlook (Revenue, USD Billion, 2021 - 2033)
-
B2B Virtual Cards
-
B2C Remote Payment Virtual Cards
-
C2B POS Virtual Cards
-
-
Application Outlook (Revenue, USD Billion, 2021 - 2033)
-
Consumer Use
-
Business Use
-
-
Regional Outlook (Revenue, USD Billion, 2021 - 2033)
-
North America
-
U.S.
-
Canada
-
Mexico
-
-
Europe
-
Germany
-
UK
-
France
-
-
Asia Pacific
-
China
-
Japan
-
India
-
South Korea
-
Australia
-
-
Latin America
-
Brazil
-
-
Middle East and Africa (MEA)
-
KSA
-
UAE
-
South Africa
-
-
Research Methodology
Segment Definition
Segment - Card Type
Revenue capture definition
Debit Card
Revenue for the virtual debit card segment is captured through the issuance and usage of digitally generated debit cards linked directly to bank accounts or prepaid balances, enabling online purchases, business payments, subscriptions, and digital transactions.
Credit Card
Revenue for the virtual credit card segment is captured through the issuance and utilization of digitally generated credit cards that provide access to pre-approved credit lines for online and business transactions.
Segment - Product Type
Revenue capture definition
B2B Virtual Cards
Revenue for the B2B virtual cards segment is generated through the issuance and use of virtual cards for business-to-business transactions, including supplier payments, procurement activities, accounts payable automation, travel expenses, and corporate spending management.
B2C Remote Payment Virtual Cards
Revenue for the B2C remote payment virtual cards segment is generated from virtual cards used by consumers for online purchases, subscription payments, digital wallets, e-commerce transactions, and other remote payment activities.
C2B POS Virtual Cards
Revenue for the C2B POS (Consumer-to-Business Point-of-Sale) virtual cards segment is captured through virtual card transactions conducted by consumers for purchases at merchant point-of-sale environments that support digital or tokenized payment methods.
Segment - Application
Revenue capture definition
Consumer Use
Revenue from the consumer use segment is generated through the adoption and use of virtual cards by individual users for online shopping, subscription services, digital wallet transactions, entertainment payments, travel bookings, and other personal financial activities.
Business Use
Revenue for the business use segment is captured through the deployment and utilization of virtual cards by enterprises for supplier payments, procurement activities, employee expense management, accounts payable automation, travel expenses, and corporate spending control.
Estimation Model
Title
Key Question
Description
Addressable User Base Layer
Who forms the potential virtual card user pool?
Identify the target population comprising digitally active consumers, enterprises, SMEs, financial institutions, and businesses engaged in digital transactions. Evaluate the size of banked populations, enterprise users, online shoppers, and businesses utilizing electronic payment methods to establish the potential user base for virtual card adoption.
Digital Payment Access Layer
Who can access virtual payment infrastructure?
Apply region-specific internet penetration, smartphone adoption, banking access, payment digitization levels, and digital wallet penetration to determine the digitally reachable market. Filter the addressable population based on access to online banking services, payment gateways, and financial infrastructure capable of supporting virtual card issuance and usage.
Virtual Card Adoption Layer
Who actively uses virtual cards for transactions?
Apply virtual payment adoption rates across consumer and business segments, including online shoppers, enterprises, subscription users, procurement teams, and cross-border payment users. Incorporate conversion metrics, such as fintech adoption rates, digital payment preferences, enterprise payment digitization levels, and usage frequency, to estimate the number of active virtual card users.
Revenue Monetization Layer
How much revenue is generated from virtual card usage?
Estimate revenue generation by applying transaction volumes, average transaction values, interchange fees, processing fees, subscription revenue, card issuance fees, and enterprise platform charges to the active user base.
Delivered Customizations
This report has been delivered with the following In-depth customizations
Client Request
Customization Delivered
Value Adds
Consumer Digital Payment & E-commerce Usage Trends
Assessed adoption patterns of virtual cards across online shopping, subscription payments, digital wallets, gaming, travel bookings, and cross-border consumer payments. Evaluated digital payment penetration, online transaction growth, and evolving consumer payment preferences across regions.
Provides insights into evolving consumer payment behavior, identifies high-potential use cases, and supports prioritization of customer acquisition and product positioning strategies.
Regional Adoption & Regulatory Landscape Assessment
Examined virtual card adoption patterns across developed and emerging markets by analyzing payment regulations, digital banking infrastructure, financial inclusion initiatives, and cross-border payment frameworks. Assessed country-level payment ecosystem maturity and regulatory developments influencing adoption.
Enables market prioritization by identifying favorable regions, regulatory barriers, infrastructure gaps, and emerging growth markets for expansion planning.
Competitive Benchmarking & Product Positioning Analysis
Conducted benchmarking of major virtual card providers based on product portfolios, target customer segments, pricing approaches, partnership strategies, and technology capabilities using publicly available company disclosures and industry publications.
Helps stakeholders evaluate competitive positioning, identify market gaps, and refine differentiation strategies across business and consumer segments.
Frequently Asked Questions About This Report
The global virtual cards market size was estimated at USD 22.9 billion in 2025 and is expected to reach USD 27.7 billion in 2026.
Some key players operating in the virtual cards market include American Express Company, BTRS Holdings, Inc., Wise Payments Limited, JPMorgan Chase & Co., Marqeta, Inc., MasterCard, Skrill USA, Inc., Stripe, Inc., WEX, Inc., and Adyen.
Key factors that are driving the virtual cards market growth include increasing demand for digital transactions and rising demand for an additional layer of security.
Asia Pacific is the fastest growing region over the forecast period.
The credit card segment lead with the 39.22% revenue share in 2025, while debit card segment is expected to grow at a significant CAGR over the forecast period.
The B2B virtual cards segment held the largest revenue share in 2025, while B2C remote payment virtual cards is the fastest growing area.
The global virtual cards market is expected to grow at a compound annual growth rate of 22.2% from 2026 to 2033 to reach USD 112.9 billion by 2033.
North America dominant with a 33.0% market share in 2025.
The businesses use held the largest revenue share (68.0)% revenue share in 2025, while consumer use segment is expected to grow at fastest CAGR over the forecast period.
About the Author(s)
Next Generation Technologies Research Team
Technology · Next Generation TechnologiesThis report was authored by the next generation technologies research team at Grand View Research - comprising two research analysts, one senior research analyst, and one industry expert - with specialized expertise in the next generation technologies segment of the technology industry. All findings are based on proprietary technology databases, executive interviews, and regulatory analysis, subject to internal peer review prior to publication.
Last Updated:
Speak to Analyst


Customize this report to your needs — add regions, segments, or data points, with 20% free customization.
Or view our licence options:


ISO 9001:2015 & 27001:2022 Certified
We are GDPR and CCPA compliant! Your transaction & personal information is safe and secure. For more details, please read our privacy policy.


