
- Home
- »
- Next Generation Technologies
- »
-
Virtual Goods Market Size And Share Report, 2026-2035GVR Report cover

Virtual Goods Market (2026 - 2035)
Size, Share & Trends Analysis Report By Type (In-Game Virtual Goods, Virtual Currency, Digital Collectibles), By Platform (Mobile, PC, Console), By Region, And Segment Forecasts
Market Size, 2025
$104.8BMarket Estimate, 2026
$114.2BMarket Forecast, 2035
$271.1BCAGR, 2026–2035
10.1%Virtual Goods Market Summary
The global virtual goods market size was valued at USD 104.8 billion in 2025 and is projected to grow from USD 114.2 billion in 2026 to USD 271.1 billion in 2035, at a CAGR of 10.1% from 2026 to 2035. Asia Pacific dominated the market, accounting for the largest revenue share of 45.0% in 2025. The growth is mainly driven by the expanding gaming ecosystem, increasing consumer spending on in-game purchases, and the growing popularity of digital entertainment platforms. The rising adoption of virtual currencies, digital collectibles, and customizable in-game content, coupled with the rapid growth of mobile gaming and live-service games, continues to accelerate demand for virtual goods.
Key Market Trends & Insights
- By Type: The in-game virtual goods segment held the largest market share of over 60.0% in 2025.
- By Platform: The mobile segment held the largest market share of around 55.0% in 2025.
Regional Insights
- Largest regional market: Asia Pacific (45.0 % revenue share, 2025)
Market Size & Forecast
- Market size in 2025: USD 104.8 Billion
- Estimated market size in 2026: USD 114.2 Billion
- Projected market size by 2035: USD 271.1 Billion
- CAGR (2026-2035): 10.1%
Three ways to get this report
Buy it, customize it, or ask a question.Ask an Analyst
A direct answer, usually in 1 working day
- AccessReport author, directly
- Reply timeWithin 1 working day
- No sales callDirect answer only
- FormatEmail reply
- CostFree, no cost
Get the Full Report
What the study covers
- FormatsPDF · Excel · Dashboard
- Timeline2026–2035 annual, 2025 base
- Coverage20+ countries, 5 regions
- Companies10+ key players profiled
Customize the Report
20% free customization
- IncludeCountries, segments, points
- TailorTo your product definition
- ExtendDeeper competitor detail
- OrA fully bespoke study
- Turnaround5–10 working days
Advancements in digital payment infrastructure, creator-driven virtual economies, and immersive technologies such as AR, VR, and the metaverse are creating new monetization opportunities for developers and supporting long-term market growth.The industry is expanding as digital platforms find new ways to monetize user engagement through virtual products and experiences. Virtual goods encompass digital apparel, accessories, collectibles, avatars, and other non-physical assets. Their adoption is closely tied to gaming, social platforms, virtual worlds, and creator-driven digital ecosystems. Consumers increasingly purchase these products to personalize their identities and enhance their experiences in online environments. Platform developers also utilize virtual goods to diversify revenue streams beyond traditional subscriptions and advertising.
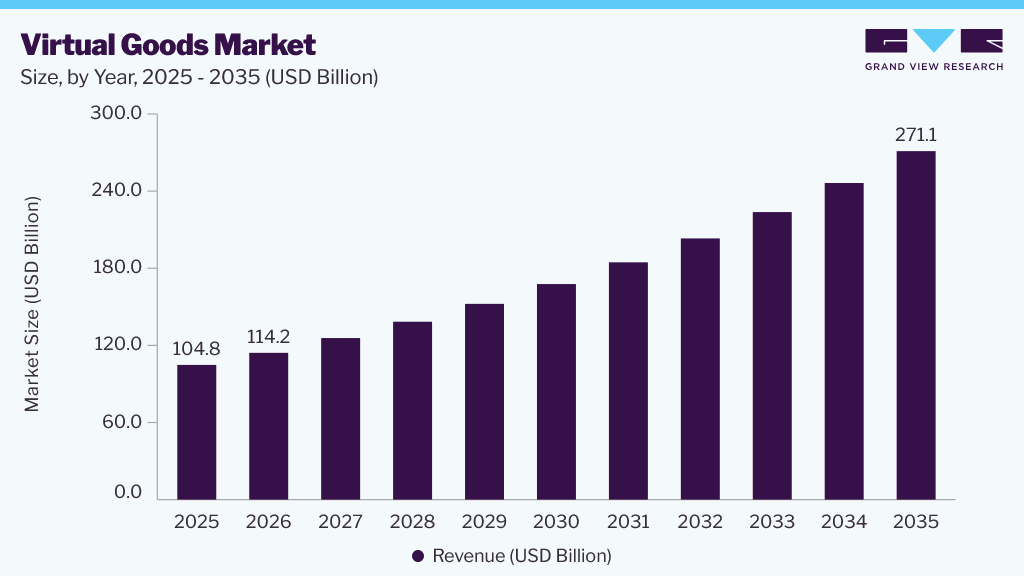 Source: Grand View Research, IR Documents, Primary Interviews, Paid DatabasesTo learn more about this report,
 Download Free Sample Report
 Recent market trends indicate a stronger integration of virtual goods within gaming and social entertainment platforms. Mobile gaming remains a crucial channel due to its large global user base. Many live-service games now introduce recurring virtual item purchases to support ongoing user engagement. Social platforms are expanding opportunities for digital personalization through customizable avatars and environments. Additionally, creator economies are fostering demand by allowing users to monetize original digital designs.
However, consumer spending sensitivity remains a significant challenge in the market. Virtual goods typically offer experiential value rather than physical utility, so changes in disposable income can affect discretionary digital purchases. Concerns about digital ownership, transaction security, and platform-specific usability also influence purchasing decisions.
Emerging opportunities are arising through immersive technologies, virtual communities, and user-generated content ecosystems. Augmented and virtual reality can boost demand for interactive digital products. Blockchain-based ownership models may provide new methods for managing digital assets, though adoption will depend on practical benefits, platform compatibility, and consumer acceptance. Artificial intelligence is also enhancing the personalization of digital products and facilitating automated content creation.
The competitive landscape is continually evolving due to platform expansion, content innovation, and experimentation with monetization strategies. Companies are increasingly focusing on personalized virtual experiences that enhance user engagement. Cross-platform interoperability could further increase the commercial viability of digital assets. Ongoing developments in gaming, social media, and immersive environments will shape the market's long-term trajectory.
Analyst Perspective
Consumers are purchasing in-game items, virtual currencies, digital collectibles, avatars, and other digital assets to personalize experiences and enhance gameplay. The rapid growth of online gaming, virtual worlds, social platforms, and creator economies is driving demand across multiple digital ecosystems. Companies are also introducing new monetization models through live events, subscriptions, and user-generated content. Businesses with strong digital platforms, engaged user communities, and effective content strategies are likely to strengthen their market position. In the coming years, market growth will depend on continuous content innovation, secure digital transactions, and the ability to create immersive experiences that encourage long-term user engagement and spending.
Type Insights
By type, the in-game virtual goods segment led the market, accounting for over 60.0% of revenue in 2025. Their adoption remains strong across multiplayer games and live-service ecosystems. Cosmetics, characters, currencies, and upgrades support recurring player spending. Recent industry developments further support the segment growth. For instance, in March 2025, Xbox expanded Game Pass in-game benefits across several free-to-play titles. The rollout included cosmetics, characters, and currency across titles such as Smite 2 and The Finals. This initiative broadened access to digital items within established gaming ecosystems and supported recurring engagement.
The digital collectibles segment is expected to witness the fastest CAGR over the forecast period. Growing interest in digital ownership is expanding collectible demand across gaming communities. Partnerships are creating new collectible formats and broader access to digital experiences. Continued industry investments reinforce the segment's growth. For instance, in June 2025, Google launched Diamond District on Roblox for Play Points members. The experience offered exclusive merchandise, collectibles, and digital rewards across participating markets.
Platform Insights
By platform, the mobile segment led the market with the largest revenue share of around 55.0% in 2025. Mobile gaming enables frequent purchases of virtual goods through accessible devices and persistent connectivity. Developers increasingly integrate cosmetics and rewards into mobile-first monetization systems. Recent industry developments further support the segment growth. For instance, in October 2025, Supercell announced a Stranger Things crossover for Brawl Stars. The mobile game introduced themed skins, power-ups, cosmetics, and collectibles during the event.
The PC segment is expected to witness a significant CAGR over the forecast period. Expanding cross-platform ecosystems are increasing PC users' access to virtual items. Live-service games continue to support recurring purchases of cosmetics, currencies, and downloadable content. The market trend is increasingly reflected through recent platform investments. For instance, in March 2025, Xbox expanded in-game benefits for PC Game Pass members. The update added cosmetics, characters, and in-game currency across several free-to-play games.
Regional Insights
The Asia Pacific virtual goods market led with the largest revenue share of around 45.0% in 2025. Large gaming populations support sustained demand for virtual goods across regional platforms. Strong mobile ecosystems further drive digital purchases across major Asia Pacific markets. Recent industry developments further support the segment growth. For instance, in November 2025, Google reported that developers in the Asia Pacific region won 86% of regional game awards. The results highlighted strong regional gaming activity across mobile, multiplayer, and cross-platform experiences.
North America Virtual Goods Market Trends
The virtual goods market in North America is expected to witness significant growth. Strong gaming engagement supports purchases across digital cosmetics, currencies, and upgrades. Cross-platform ecosystems expand access to virtual goods across connected gaming audiences. The market trend is increasingly reflected through recent gaming engagement data. For instance, in January 2025, Microsoft reported that 54% of Gen Z played games daily across the United States. The report also found 87% of U.S. mothers participate in gaming activities, demonstrating broad regional engagement.
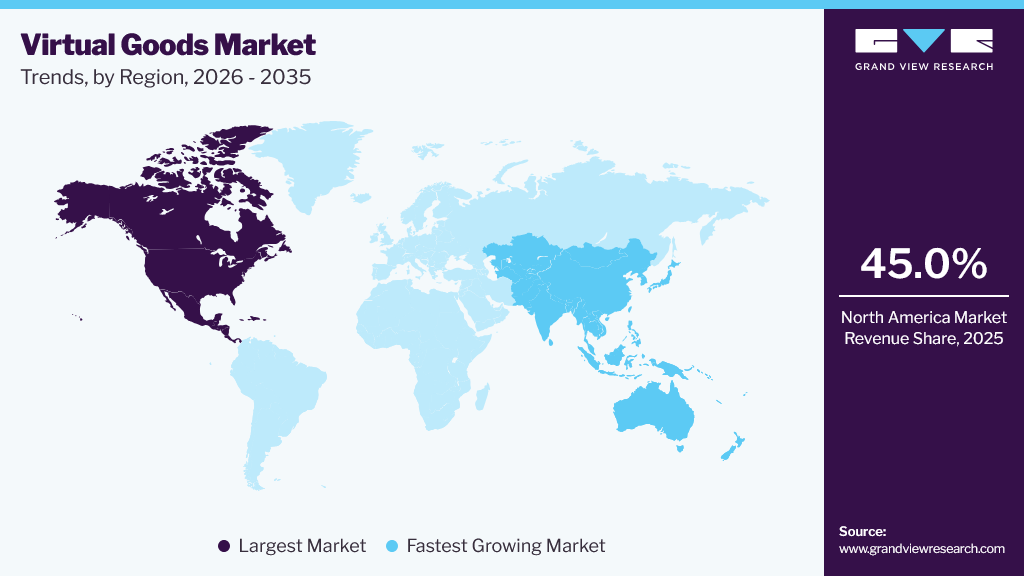 To learn more about this report, Download Free Sample Report
 Key Virtual Goods Companies Insights
The virtual goods market remains competitive through product innovation across gaming, social, and immersive digital platforms. Companies pursue acquisitions and partnerships to expand digital ecosystems and user engagement capabilities. AI integration supports personalization, content creation, and recommendation systems. Digital transformation strengthens monetization and distribution models. Regional expansion broadens user access across emerging markets. Participants focus on technology development and strategic positioning through diversified virtual product portfolios.
Key Virtual Goods Companies
The following key companies have been profiled for this study on the virtual goods market.
-
Tencent Holdings Limited
-
NetEase, Inc.
-
Roblox Corporation
-
Epic Games, Inc.
-
Electronic Arts Inc.
-
Activision Blizzard, Inc.
-
Take-Two Interactive Software, Inc.
-
Valve Corporation
Recent Developments
-
In September 2025, Epic Games introduced direct in-island sales for Fortnite creators, enabling developers to sell durable and consumable virtual goods within their islands. The initiative expands creator monetization opportunities and strengthens the virtual goods ecosystem.
-
In April 2025, Roblox launched regional pricing for in-game virtual items, allowing creators to tailor prices to local market conditions. This feature improves the accessibility of virtual goods and supports global monetization opportunities for creators.
Virtual Goods Market Report Scope
Report Attribute
Details
Market size in 2025
USD 104.8 billion
Estimated market size in 2026
USD 114.2 billion
Projected market size by 2035
USD 271.1 billion
Growth rate
CAGR of 10.1% from 2026 to 2035
Base year for estimation
2025
Actual data
2021 - 2024
Forecast period
2026 - 2035
Quantitative units
Revenue in USD billion, and CAGR from 2026 to 2035
Report coverage
Revenue forecast, company ranking, competitive landscape, growth factors, and trends
Segments covered
Type, platform, region
Regional scope
North America; Europe; Asia Pacific; Latin America; Middle East & Africa
Country scope
U.S.; Canada; Mexico; UK; Germany; France; China; Japan; India; Australia; South Korea; Brazil; Argentina; South Africa; Saudi Arabia; UAE
Key companies profiled
Tencent Holdings Limited; NetEase, Inc.; Roblox Corporation; Epic Games, Inc.; Electronic Arts Inc.; Activision Blizzard, Inc.; Take-Two Interactive Software, Inc.; Valve Corporation
Customization scope
Free report customization (equivalent to 8 analyst working days) with purchase. Addition or alteration to country, regional & segment scope.
Pricing and purchase options
Avail of customized purchase options to meet your exact research needs. Explore purchase options
Virtual Goods Market Report Segmentation
This report forecasts revenue growth at the global, regional, and country levels and provides an analysis of the latest industry trends and opportunities across each sub-segment from 2021 to 2035. For this study, Grand View Research has segmented the global virtual goods market report based on type, platform, and region:
-
Type Outlook (Revenue, USD Billion, 2021 - 2035)
-
In-Game Virtual Goods
-
Virtual Currency
-
Digital Collectibles
-
-
Platform Outlook (Revenue, USD Billion, 2021 - 2035)
-
Mobile
-
PC
-
Console
-
-
Regional Outlook (Revenue, USD Billion, 2021 - 2035)
-
North America
-
U.S.
-
Canada
-
Mexico
-
-
Europe
-
UK
-
Germany
-
France
-
-
Asia Pacific
-
China
-
Japan
-
India
-
Australia
-
South Korea
-
-
Latin America
-
Brazil
-
Argentina
-
-
Middle East and Africa (MEA)
-
South Africa
-
Saudi Arabia
-
UAE
-
-
Frequently Asked Questions About This Report
The global virtual goods market size was valued at USD 104.8 billion in 2025 and is estimated at USD 114.2 billion in 2026.
The global virtual goods market is expected to grow at a CAGR of 10.1 % from 2026 to 2035, reaching USD 271.1 billion in 2035.
The Asia Pacific region dominated the global market, with around 45.0% revenue share in 2025.
The in-game virtual goods segment accounted for the largest revenue share, over 60.0%, in 2025.
Key players in the market include Tencent Holdings Limited, NetEase, Inc., Roblox Corporation, Epic Games, Inc., Electronic Arts Inc., Activision Blizzard, Inc., Take-Two Interactive Software, Inc., and Valve Corporation, among others.
About the Author(s)
Next Generation Technologies Research Team
Technology · Next Generation TechnologiesThis report was authored by the next generation technologies research team at Grand View Research - comprising two research analysts, one senior research analyst, and one industry expert - with specialized expertise in the next generation technologies segment of the technology industry. All findings are based on proprietary technology databases, executive interviews, and regulatory analysis, subject to internal peer review prior to publication.
Last Updated:
Speak to Analyst

Customize this report to your needs - add regions, segments, or data points, with 20% free customization.
Or view our licence options:


ISO 9001:2015 & 27001:2022 Certified
We are GDPR and CCPA compliant! Your transaction & personal information is safe and secure. For more details, please read our privacy policy.


