
- Home
- »
- Medical Devices
- »
-
U.S. Dental Market 2025: Trends, Consolidation & EconomicsGVR Report cover
![U.S. Dental Market Trends, Consolidation Outlook, And Practice Economics Benchmark Report]()
U.S. Dental Market Trends, Consolidation Outlook, And Practice Economics Benchmark Analysis, 2025
Market Overview
The U.S. dental market is experiencing steady growth driven by increasing patient demand, expanding insurance coverage, and growing emphasis on preventive and cosmetic dentistry. Growing awareness of the connection between oral health and overall well-being, along with an aging population requiring increased restorative and prosthetic interventions, is driving higher utilization of dental services. At the same time, the expansion of employer-sponsored dental coverage and Medicaid dental benefits across several states is improving patient access. The market is also being reshaped by technological advancements, as digital dentistry, AI-enabled diagnostics, tele-dentistry, and advanced imaging enhance clinical efficiency, patient experience, and treatment outcomes. In addition, market consolidation continues to intensify, with Dental Service Organizations (DSOs) expanding nationwide to optimize operations and establish standardized, data-driven practice management models.
The following sections will explore the analysis for group practice & DSO market trends, consolidation & transaction landscape (2021–2033), sell-side valuation benchmarks, 2024, and practice economics & operational benchmarks.
Group Practice & DSO Market Trends
The consistent increase in per capita disposable income in the U.S., from USD 56,545 in 2021 to USD 66,973 in 2025 and further to USD 83,858 by 2033, has significantly improved consumers’ ability to manage out-of-pocket (OOP) healthcare expenses, particularly in the dental industry, where a large share of services is paid directly by patients. As disposable income rises, individuals are better able to afford dental treatments that are only partially covered or not covered at all, by insurance plans. According to KFF analysis of National Health Expenditure (NHE) data, per capita out-of-pocket (OOP) healthcare spending in the U.S. increased from approximately USD 1,300 in 2021 to USD 1,430 in 2022 and further to USD 1,514 in 2023.
The U.S. dental workforce is undergoing notable demographic and structural shifts that will influence service capacity and industry organization over the coming years. A significant proportion of practicing dentists remains in older age groups, increasing the likelihood of retirement-related workforce attrition, particularly in solo and small practices where replacement can be challenging. At the same time, a gradual rise in mid-career dentists and increasing preference among younger professionals for employment in group practices and DSO is accelerating consolidation and altering traditional practice ownership models. To mitigate potential capacity constraints and maintain care accessibility, many practices are focusing on productivity optimization, broader utilization of hygienists and support staff, and greater adoption of digital tools to streamline clinical and administrative operations.
The table below benchmarks dentists in the U.S. by age group, 2021-2024:
Age Group
2021
2022
2023
2024
Age under 35
17.60%
17.70%
17.40%
17.30%
Source: American Dental Association, Grand View Research
The Southeast has emerged as a major base for established dental practices due to its large and expanding population base and favorable age demographics. According to the U.S. Census Bureau, in 2024, Texas had an estimated population of 31.3 million, making it the second most populous state in the U.S. Florida’s population reached approximately 23.3 million, while Georgia and North Carolina recorded populations of around 11.1 million and 10.9 million, respectively. Moreover, the Great Lakes region represents a stable and mature dental market, supported by large urban populations, established healthcare infrastructure, and consistent dental service utilization.
Dental procedure fees in the U.S. show a consistent disparity between rural and urban regions. On average, patients in rural areas pay significantly less for routine and advanced dental care than those in urban centers. This fee difference is driven by multiple factors including practice overhead, cost of living, market competition, and patient affordability.
The table below benchmarks estimated average rural vs. urban pricing, 2024:
Pricing
Rural Area
Urban Area
Estimated Average Pricing
87.29
163.44
Source: American Dental Association, U.S. Government Accountability Office (GAO), Grand View Research
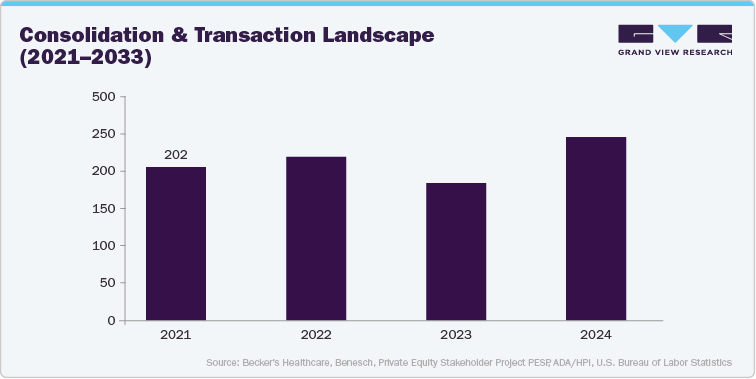
The table below figure shows the annual platform DSO transaction count (2021-2024):
Below is a structured table outlining the key multi-state expansion strategies adopted by DSOs, with a focus on how each strategy supports scale building and market consolidation:
Expansion Strategy
How the Strategy Works
Purpose / Consolidation Impact
Examples
Acquisition of Independent Dental Practices
Upgrade report license to gain access to the complete analysis
Affiliation / Partnership Model
De Novo (Greenfield) Clinic Openings
Platform + Add-On Strategy
Regional Hub-and-Spoke Expansion
Multi-Specialty Integration
Private Equity–Backed Roll-Ups
Entry via Underserved or High-Growth States
Standardization & Centralized Services Model
Cross-State Brand Leveraging
Sell-Side Valuation Benchmarks, 2024
Below table outlines the EBITDA multiples by specialty:
Specialty
25th Percentile
Median
75th Percentile
Range (Low–High)
General Dentistry
6.7×
Upgrade report license to gain access to the complete analysis
Source: Industry Journals, Investor Presentations, Primary Interviews, Grand View Research
Practice Economics & Operational Benchmarks
Below table outlines the average gross daily production by dental specialty, 2024:
Dental Specialty
Avg. Daily Production per Provider (USD)
General Dentistry
4250
Below table outlines the revenue model implications for DSOs Vs. private practices:
Parameter
DSOs
Private Practices
Revenue Structure
Earn revenue via management fees or share of operating revenue from affiliated clinics; centralized non-clinical operations
Owner-operator retains all revenue after expenses; performance depends on ability to manage costs & operations
Affiliation & Growth Trend
Increasing affiliation; ~13% dentists affiliated in 2022; strong adoption among early-career dentists
Slower growth: declining share as more dentists shift toward DSO models
Revenue Distribution & Compensation
Dentists typically paid on production/collection basis; more predictable income; reduced exposure to overhead
Owners retain profits; higher long-term earning potential; higher income variability
Operational Scale & Efficiency
Benefits from economies of scale; centralized billing, procurement, RCM; faster cash flow & lower admin cost
Smaller teams; higher admin cost per revenue; slower collections in some cases
Revenue Stability vs Upside
Greater revenue stability, attractive for early-career dentists; lower financial risk
Greater long-term upside and equity value; higher financial and operational risk


Customize this report to your needs - add regions, segments, or data points, with 20% free customization.
Or view our licence options:


ISO 9001:2015 & 27001:2022 Certified
We are GDPR and CCPA compliant! Your transaction & personal information is safe and secure. For more details, please read our privacy policy.


