- Home
- »
- Reports
- »
-
Air Freight Services Supplier & Cost Intelligence Report, 2030
![Air Freight Services Supplier & Cost Intelligence Report, 2030]()
Air Freight Services Procurement Intelligence Report, 2023 - 2030 (Revenue Forecast, Supplier Ranking & Matrix, Emerging Technologies, Pricing Models, Cost Structure, Engagement & Operating Model, Competitive Landscape)
- Published Date: Sep, 2023
- Base Year for Estimate: 2022
- Report ID: GVR-P-10547
- Format: Electronic (PDF)
- Historical Data: 2020 - 2021
- Number of Pages: 60
Air Freight Services Category Overview
“Leading air freight companies have increased the use of IoT tracking in addition to sensors and RFID tags to meet the customer’s rising demand for end-to-end visibility.”
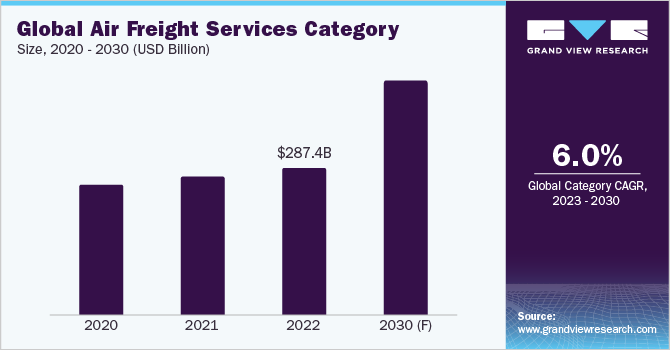
The air freight services category is expected to grow at a CAGR of 6% from 2023 to 2030. Growth in the category is fueled by the robust demand for goods industry-wide and the growth in the e-commerce sector. The different segments considered for this report include - air freight forwarding, airlines, mail, and other services. One of the top trends is increasing automation for boosting facility operations, such as the use of autonomous vehicles, robotic systems, and drones.
For instance, in May 2023, a completely automated robotic freight handling system for air freight was launched by Speedcargo Technologies, a Singapore-based AI and robotics startup for air cargo, in collaboration with Güdel. The robotic system can handle cargo of all shapes and sizes, including odd-shaped ones. The system combines Speedcargo's advanced intelligent robotics software with Güdel's advanced gantry robots to improve three ground handling operations which include an increase in cargo acceptance by creating quick automated lanes with integrated processes for dimensions, weight, and x-ray checks, supports automatic buffers for retrieval and storage, and automates the ULD build-up. Similarly, in December 2022, ASL Aviation Holdings announced a collaboration with Reliable Robotics to explore the potential use of autonomous freighter planes for air cargo services.
The global air freight services category size was valued at USD 287.4 billion in 2022. In 2022, the Asia Pacific region accounted for almost 32.4% of the overall share. However, globally, German logistics companies ranked at the top of the air cargo sector in 2021. For strategic reasons, Kuehne + Nagel relocated its headquarters to Switzerland in 2021 and the company transported 2.2 million tons of goods by airplane in 2021. DHL Global Forwarding came in second with 2.1 million tons of cargo transported.
Continuous technological innovations and advancements such as the use of SAFs or Sustainable Aviation Fuels to curb CO2 emissions, AI, ML, IoT, and blockchain are expected to aid category expansion. More than sixty companies operating in the air freight - airlines domain aim to use 10% sustainable aviation fuels by 2030. Freight providers are increasing their investments in sourcing sustainable fuels. For instance, in February 2023, United Airlines announced the launch of a USD 100 million-investment fund, named "United Airlines Ventures Sustainable Flight Fund", for startups developing and researching SAFs. The fund has investments from major companies such as Air Canada, General Electric, Boeing, Honeywell, and JPMorgan Chase.
Customers now prefer having constant access to tracking, and pharmaceutical and perishable goods manufacturers need to be aware of how their shipments are handled during the airport-to-airport portion of the air cargo voyage. Hence, the demand for IoT tracking in addition to sensors and RFID tags has increased sharply to meet the rising demand for end-to-end visibility. For instance, Cathay Pacific announced the launch of its first IoT application with remote functions, Ultra Track, in 2021 to air transport sensitive shipments. It was powered by Descartes Core Bluetooth Low Energy (BLE) tags and readers. IATA's Cargo IQ is compatible with the multidimensional tracking and data-logging system. The tracking product could be used across 29 ports globally during the introduction phase.
However, continuous fluctuations in air freight rates, soaring oil and energy rates, and supply chain problems will likely hamper the growth.
Supplier Intelligence
“How can the nature of the category be best described? What is the bargaining power of the suppliers?”
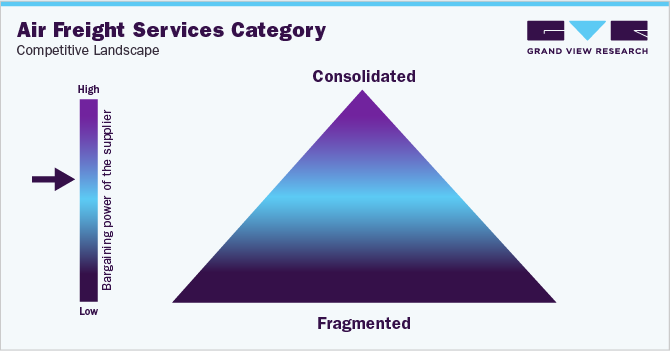
The category features a moderately consolidated landscape with leading players such as DHL Group, FedEx, UPS, United Airlines, and Qatar Airways holding a majority of the share. The top fifteen companies hold more than 35 - 45% of the share. Competition is intense due to increased forward integrations to expand service offerings and customer base. Suppliers have a higher bargaining power as they can work across any verticals and industries.
Service providers actively engage with third-party providers, acquiring, or collaborating with regional vendors who have embraced a global delivery model. For instance,
-
In May 2023, Nippon Express announced the acquisition of an Austrian-based logistics company, Cargo-Partner for USD 743 million. Around 1.2 million tons of air cargo is expected to be handled by two forwarders
-
In May 2023, CEVA Logistics announced it would acquire Bollore Logistics post receiving regulatory approval for EUR 4.6 billion. This deal would make CMA CGM one of the top five companies operating in the logistics space. Around 1 million tons of air cargo is expected to be handled by two forwarders
Key suppliers covered in the category:
-
DHL Group
-
UPS
-
FedEx Corporation
-
Kuehne and Nagel
-
Qatar Airways
-
United Airlines
-
Delta Airlines
-
Singapore Airlines
-
CargoLux Airlines International S.A.
-
American Airlines
-
Etihad Airways
-
Lufthansa
-
All Nippon Airways
-
Emirates
-
Korean Air Lines Co. Ltd.
-
DSV
-
DB Schenker
Pricing and Cost Intelligence
“Which are the largest cost components in this category? Were there any price fluctuations in transpacific routes?”
The total cost of ownership for an air freight service provider includes the cost of - aircraft, fuel and energy, package volume, weight, and dimensions, air freight rates, airline surcharges, pre-export charges, location, labor, taxes and tariffs, and other miscellaneous fees. Aircraft costs can include cost components such as rent, maintenance, and depreciation. Pre-export charges can include cost components like export declaration, pickup and haulage, screening, handling, repackaging, and a dedicated forwarder at the destination. Operating expenses such as fuel, direct maintenance, depreciation, and labor can account for between 40% to 50% of the total cost. Fuel and energy costs alone can account for between 12% to 18% of the total cost.
In March 2023, transpacific airfreight rates increased, but there were further reductions from Hong Kong to Europe and across the Atlantic. According to the Baltic Exchange Airfreight Index, prices from Hong Kong to NA (North America) in March rose by 9% over February 2023. The rates from China to the U.S. increased by 7.8% in March compared to February 2023. Prices were expected to soften again due to the end-of-quarter rush in e-commerce and garments ahead of the Easter holiday season. The rates decreased by 2.2% from China to Europe. Rates from Asia to both Europe and North America have remained quite stable over the past few years.
On the supply side, there has been an increase in air cargo capacity over the pre-pandemic period. February 2023 saw a rise in global air cargo capacity for the eleventh month in a row. This was an 11% increase compared to February 2022. This was mostly caused by an increase in passenger airlines' belly freight capacity, which partially made up for the decrease in international capacity provided by cargo carriers.
The following chart provides a breakdown of the cost structure associated with air freight services. The breakdown of pre-export charges is illustrated below.
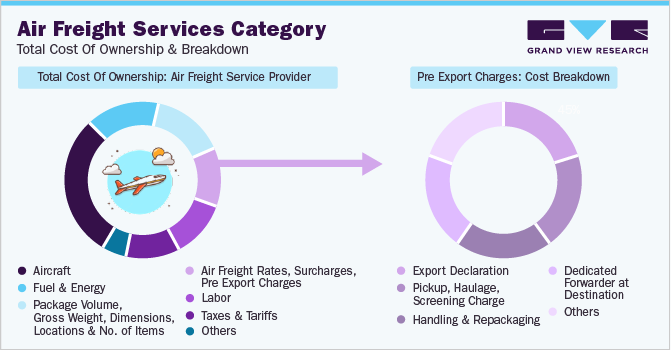
The report provides a detailed analysis of the cost structure and the pricing models adopted by prominent suppliers in the market.
Sourcing Intelligence
“How do companies achieve cost savings? Which models are preferred?”
Almost 60% to 70% of B2B companies opt for a full outsourcing model for their air freight activities. By outsourcing their freight operations, companies are able to achieve better profitability, gain higher cost savings, and leverage the freight provider's scalability, technology, and expertise. As a result, companies get better visibility throughout the process, save time on training and hiring, and target audiences effectively while generating higher ROIs.
In terms of air freight services sourcing intelligence, companies opt for an approved provider operating model to achieve higher cost savings, ensure better flexibility in customization, and reduce security-related risks.
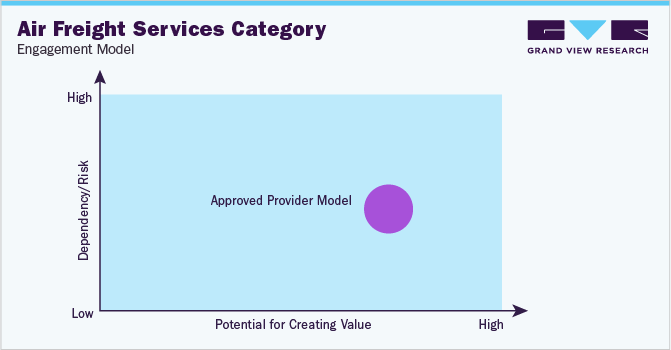
In an approved provider model, the supplier meets a predefined set of qualification criteria, quality standards, prior proven performance, and other selection criteria.
The top 3 air freight exporters in 2022 are China, the United States, and South Korea, with 40,740, 20,981, and 9,600 cargos, respectively. The United States exports most of its Air freight to Brazil, the Philippines, and Argentina. As of June 2023, following the pandemic, there has been a decrease in demand for cargo exports from India, mostly as a result of the economic downturns in the U.S. and Europe. As a result, there has been an increase in the capacity that is available and a consequent reduction in transportation costs in India. Additionally, pharmaceuticals, automotive components, textiles, and handicrafts were formerly among the high-volume commodities exported via air in India, their quantities have decreased as a result of the waning of the epidemic and the recessionary conditions in those countries in 2023. The only sector in India that is expanding is e-commerce as of June 2023, where products are shipped from Tier-2 and Tier-3 cities in little packages weighing between 20 and 50 kg, but large commercial shipments are declining.
Cargo companies are increasing their spending on cutting-edge technology to provide specialized services to their customers. Major companies such as DHL, FedEx, and UPS are advancing their integration with various platform providers that help with automation and produce higher returns while growing their consumer base.
The report also provides details regarding day one, quick wins, portfolio analysis, key negotiation strategies of key suppliers, and low-cost/best-cost sourcing analysis.
Air Freight Services Procurement Intelligence Report Scope
Report Attribute
Details
Air Freight Services Category Growth Rate
CAGR of 6% from 2023 to 2030
Base Year for Estimation
2022
Pricing Growth Outlook
12% - 18% (annual)
Pricing Models
Dynamic pricing, volume-based pricing, and cost-plus pricing model
Supplier Selection Scope
Cost and pricing, past engagements, productivity, geographical presence
Supplier Selection Criteria
By type of cargo, features (temperature sensitive, real-time shipment monitoring), operating capability, quality measures, technology, certifications, regulatory compliance, and others
Report Coverage
Revenue forecast, supplier ranking, supplier matrix, emerging technology, pricing models, cost structure, competitive landscape, growth factors, trends, engagement, and operating model
Key Companies Profiled
DHL Group, UPS, FedEx Corporation, Kuehne and Nagal, Qatar Airways, United Airlines, Delta Airlines, Singapore Airlines, Cargolux Airlines International S.A., American Airlines, Etihad Airways, All Nippon Airways, Korean Air Lines Co. Ltd., DSV, DB Schenker, Emirates, and Lufthansa
Regional Scope
Global
Historical Data
2020 - 2021
Revenue Forecast in 2030
USD 458.07 billion
Quantitative Units
Revenue in USD billion and CAGR from 2023 to 2030
Customization Scope
Up to 48 hours of customization free with every report.
Pricing and Purchase Options
Avail customized purchase options to meet your exact research needs. Explore purchase options
Frequently Asked Questions About This Report
b. The global air freight services category size was valued at approximately USD 287.4 billion in 2022 and is estimated to grow at a CAGR of 6% from 2023 to 2030.
b. The increasing growth in the e-commerce sector, the rising demand for components in the automotive and manufacturing industries, along with high demand for online products, are driving the growth of the category.
b. According to the LCC/BCC sourcing analysis, U.S. and China are the ideal destinations for sourcing air freight services.
b. The global air freight service category is moderately consolidated with the top fifteen players accounting for 35% – 45% of the total overall share. Some of the key players are DHL, UPS, FedEx Corporation, DSV, DB Schenker, All Nippon Airways Co., Ltd., Cargolux Airlines International S.A., Qatar Airways, and Emirates.
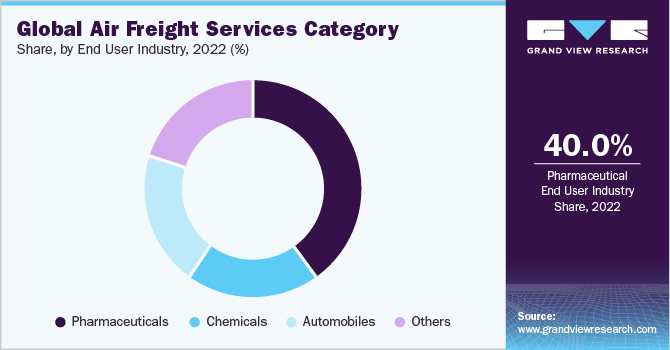
b. The cost of aircraft body, fuel and energy, and labor form the largest cost components. Other key costs include pre-export charges, airline surcharges, air freight rates, number of items, volume, and weight of items, and other taxes and tariffs.
b. Partnering with regional players to gain higher profit margins while expanding service offerings, acquiring technology providers to provide integrated services, and choosing suppliers that provide increased customization for clients.
Share this report with your colleague or friend.
GET A FREE SAMPLE
This FREE sample includes market data points, ranging from trend analyses to market estimates & forecasts. See for yourself...
Add-on Services
Should Cost Analysis
Component wise cost break down for better negotiation for the client, highlights the key cost drivers in the market with future price fluctuation for different materials (e.g.: steel, aluminum, etc.) used in the production process
Rate Benchmarking
Offering cost transparency for different products / services procured by the client. A typical report involves 2-3 case scenarios helping clients to select the best suited engagement with the supplier
Salary Benchmarking
Determining and forecasting salaries for specific skill set labor to make decision on outsourcing vs in-house.
Supplier Newsletter
A typical newsletter study by capturing latest information for specific suppliers related to: M&As, technological innovations, expansion, litigations, bankruptcy etc.
![gvr icn]()
NEED A CUSTOM REPORT?
We can customize every report - free of charge - including purchasing stand-alone sections or country-level reports, as well as offer affordable discounts for start-ups & universities.
Contact us now to get our best pricing.
![esomar icon]()
ESOMAR certified & member
![ISO]()
ISO Certified
We are GDPR and CCPA compliant! Your transaction & personal information is safe and secure. For more details, please read our privacy policy.
We are committed towards customer satisfaction, and quality service.
Client Testimonials

"The quality of research they have done for us has been excellent..."
ISO Certified


