- Home
- »
- Reports
- »
-
Maintenance Repair & Operations (MRO) Category Report, 2030
![Maintenance Repair & Operations (MRO) Category Report, 2030]()
Maintenance Repair & Operations (MRO) Procurement Intelligence Report, 2024 - 2030 (Revenue Forecast, Supplier Ranking & Matrix, Emerging Technologies, Pricing Models, Cost Structure, Engagement & Operating Model, Competitive Landscape)
- Published Date: Mar, 2024
- Base Year for Estimate: 2023
- Report ID: GVR-P-10582
- Format: Electronic (PDF)
- Historical Data: 2021 - 2022
- Number of Pages: 60
Maintenance Repair & Operations (MRO) Category Overview
“The increasing demand from the manufacturing sector and the need to reduce equipment downtime is driving the category’s growth.”
The maintenance repair & operations (MRO) category is expected to grow at a CAGR of 2.2% from 2024 to 2030. It can be classified under these major heads: industrial or infrastructure, production and material handling equipment (e.g., pumps, belts), consumables (e.g., office, cleaning supplies), and maintenance supplies (e.g., lubricants, repair tools). MRO can also involve hundreds of sub-categories that can include supply chain materials as well.
One of the major trends in this category is the rising use of IoT/IIoT sensors in equipment to reduce downtime and enable speedy tracking of inventory. Globally, the demand for these products has been skyrocketing. There is an increased demand for components and parts from the manufacturing sector. As a result, businesses or companies want more dependable equipment, and there is less time for equipment repair and unscheduled failures. Most maintenance departments at major industrial production sites are experiencing a significant shift in the way maintenance tasks are triggered and conducted. Real-time sensors are replacing periodic vibration monitoring and data processing. Many organizations have installed thermal vibration sensors on each motor and gearbox on their production lines. All such factors are driving the growth of the category.
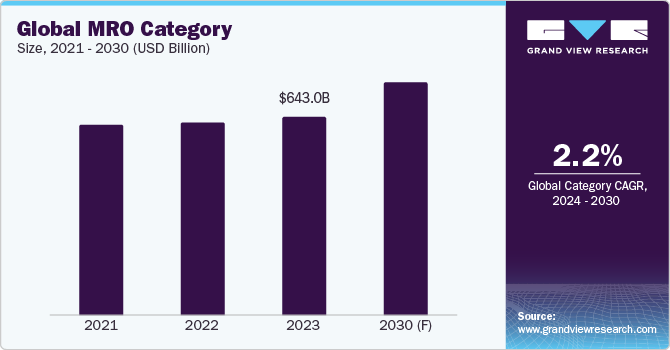
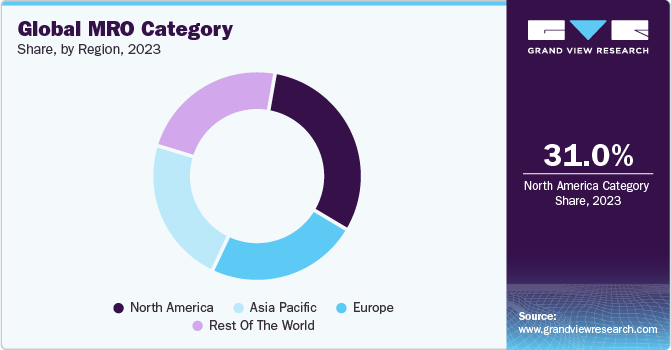
The global maintenance repair & operations category was estimated at USD 643.04 billion in 2023. Regionally, North America holds the largest share, with 25% - 35% of the total category share. In terms of emerging and latest technologies in this category, prescriptive maintenance modeling, digital twinning, robotics and drones, 3D printing, and blockchain are the major ones. Advancements in cloud storage technology coupled with AI and VR are enabling this category to move from predictive to prescriptive modeling for increasing the productivity and efficiency of maintenance and repairs. With the help of blockchain, MRO managers and inspection officials can obtain timely information. This category suffers from major challenges such as the lack of digital records of either multiple components or parts, supply chain disruptions, and system inconsistencies, which can cost MRO companies millions of dollars. Such huge costs can be tackled with blockchain technology as it helps in tracking millions of transactions between different entities thereby providing traceability with increased security. Using this technology, category vendors can achieve annual cost savings of 5% - 10%.
Many companies owing to supply chain problems for small integral metal cast components are considering additive manufacturing (AM) as a potential solution. Industrial plants can save millions of dollars as AM can potentially transform “in-field control valve maintenance” significantly. With the help of AM, companies can design and produce valve replacement parts such as disk stacks or valve trims that would not be possible via traditional methods. Each replacement or bespoke component may be tailored to the valve's exact process conditions, saving time, weight, and money. Manufacturers are turning towards AM and 3D printing as it provides them with on-site, on-demand manufacturing and greater supply chain flexibility. These factors are likely to aid category expansion.
Supplier Intelligence
“What is the nature of the MRO category? What is the supplier landscape?”
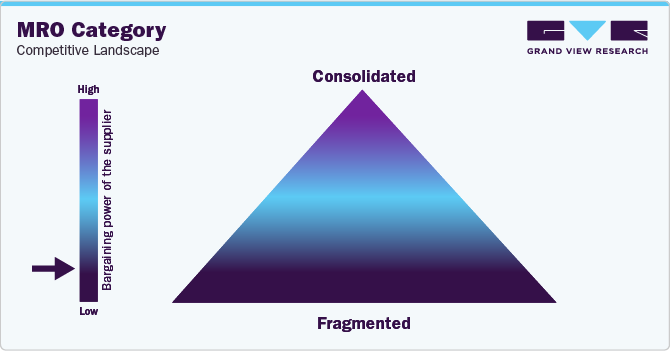
The maintenance repair & operations (MRO) category is fragmented and highly competitive. This is mainly because, under MRO, different departments are responsible for buying and tracking their own MRO items, which can make it difficult to manage. As a result of this fragmentation, the major challenges for vendors include high acquisition costs, poor visibility into demand, and duplication. The supplier landscape consists of many large-scale integrated players with a variety of services under their portfolio, and small to medium-sized players either specializing in industrial products or tools or supplies (across a few targeted industries) or, providing repairs and small maintenance services. Additionally, it also consists of a wide mix of national or regional distributors.
In this industry, it is a common practice for many buyers or companies to purchase almost 40% - 60% of their spare parts or replacement machine parts directly from OEMs or fixed suppliers known to the source. As a result of high dependence, in these cases, the bargaining power of buyers may become moderate. The power is very limited because of the exclusive contractual agreements. This also increases the risk of supply problems. Only 20% of MRO spending was spread across 1,000+ suppliers for companies in steel or other heavy industries. However, on a global scale, the bargaining power of the suppliers is low in mature markets and developed countries. The competitive rivalry is high among players due to low switching costs and industry fragmentation. One of the major barriers to entry among new entrants is information asymmetry as a result of information or data controls and manuals by manufacturers, OEMs, or vendors.
It has been observed that global MRO activities have increased steadily since 2021. In 2022 and 2023, major OEMs and players were refocusing on strengthening their supply chain and increasing component production. Major consolidations have been witnessed in the aftermarket sector. Companies in this category are actively entering collaborations or partnerships or acquiring new technologies and service capabilities to increase operational efficiency. In 2023, deals in the engineering and construction sectors were positively affected by an increase in appetite for infrastructure investments. Several tier suppliers were able to enter the U.S. market through M&As.
Key suppliers covered in the category:
-
Adolf Würth GmbH & Co. KG
-
Air Liquide S.A.
-
Applied Industrial Technologies, Inc.
-
MSC Industrial Direct Co., Inc.
-
Rubix Group International Limited
-
Linde Engineering
-
ERIKS Group
-
Sonepar Group
-
WESCO International, Inc.
-
W. W. Grainger, Inc.
-
RS Group (formerly Electrocomponents plc)
-
Critica Infrastructure (Henkel)
Pricing and Cost Intelligence
“What is the total cost associated with the MRO category? How does labor cost vary?”
The key cost components in this category are labor, warehousing, rent and utilities, technology or IT infrastructure and overheads. Other costs can include transportation, marketing, legal or tax. Labor forms the largest component, accounting for a 40% - 50% share of the total cost structure. Warehousing is the second largest component and includes the cost to store all the industrial supplies and goods procured directly from the OEMs. MRO materials can include components or supplies from different categories such as electrical or switchgear, fluid and power, mechanical, chemicals and lubricants, industrial tools and consumables, or PPE or janitorial. For effective MRO management, IT infrastructure plays a vital role in cost as it can include elements such as engineering or stock management systems, computerized maintenance management systems (CMMS), enterprise resource planning (ERP) software, e-procurement systems, or any other business finance software.
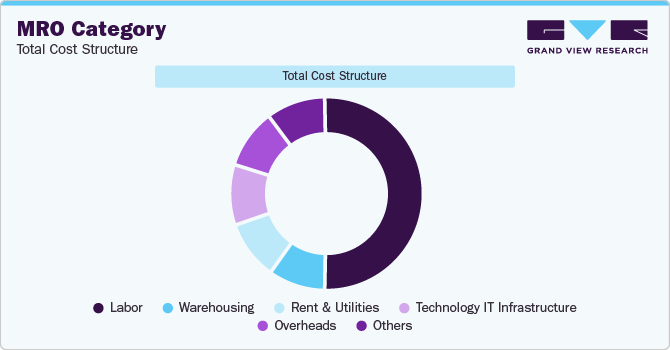
Labor costs vary significantly across developed and developing nations and can dramatically push up service costs. For instance, in 2023, the average salary for MRO managers ranged between USD 57,000 - USD 69,000 annually in developed countries such as the U.S., the UK, and Germany. Entry-level MRO positions can start from USD 41,000 annually. Most companies use automation to reduce labor costs or contract it to countries with low labor costs such as China or India. Most of the MRO-related jobs in India have a salary range of USD 6,000 - 8,000 annually. Salaries can increase based on other factors such as years of experience, industry, and knowledge expertise.
Factors such as rental rates, operating and standard maintenance expenses, and the amount of space needed for storing inventory can significantly impact the total cost of warehousing, rent, and utilities. On average, warehouses are rented on a monthly or yearly basis. For instance, a basic warehouse of 10,000 square feet can have a starting monthly rent of USD 20,000. On the other hand, under IT infrastructure, entry-level CMMS software can start from USD 29 - USD 79 per user per month. The upfront expenditures for subscription-based onboarding in a CMMS can range between USD 600 - USD 2,500. CMMS cost can vary as per user requirements, such as the quantity of assets and equipment to be tracked, the number of users who require access, and other custom features.
The report provides a detailed analysis of the cost structure and the pricing models adopted by prominent suppliers in this category.
Sourcing Intelligence
“What kind of strategies are considered in this category?”
North America and Western Europe are the most mature markets. As a result of buyer maturity, there is a high level of outsourcing. Different firms have different MRO needs. Most of the end-user companies or clients adopt a full outsourcing engagement strategy with their list of approved suppliers. MRO suppliers have a dedicated team of professionals to ensure operations run smoothly for clients, for instance, oil and gas companies. The important positions within high-volume MRO facilities involve dedicated procurement professionals, supplier relationship managers, inventory managers, and compliance or standards officers for clients.
In select regions, sourcing MRO industrial spare parts is easier (for instance, the U.S., Canada, Germany, etc.,) while in other areas (for instance, Africa, Nordic regions, etc.,) it is extremely challenging. Hence, large corporations having spent budgets of more than USD 20 - 30 million generally benefit from outsourcing these services to integrators or aggregators. Additionally, the overhead costs for salaries and training are also reduced for clients in exchange for higher operational efficiency.
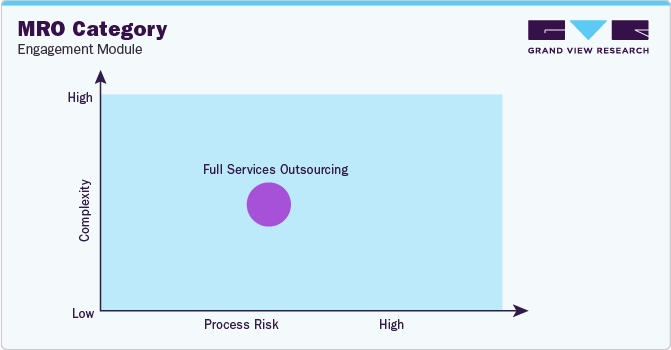
“In the full services outsourcing model, the client outsources the complete operation/manufacturing to single or multiple companies.”
China is the world leader in MRO supplies and is often the most sought-after country for procurement-related activities. Under MRO sourcing intelligence, countries such as Malaysia, Singapore, Turkey, and UAE (Dubai) have consistently established themselves as reliable players in the APAC region. This is mainly due to favorable government policies and tax incentives, the ability to create viable ecosystems, the availability of cost-efficient skilled labor, and geographical location. Singapore accounts for almost 10% of the global MRO share and is one of the largest markets in Asia.
Supplier selection is a critical aspect for the client during the management of the MRO category. Directing the majority of purchases to a few important distributors or vendors can streamline acquisition and lower administrative expenses. According to industry experts, as a guideline, most of the companies (or, clients), generally direct 80% of the overall spending towards the top 15% of strategic MRO suppliers. For the client, it is important to consider a number of factors, including product quality, service and supplier reliability, shipping speed, and shipping costs. Other important considerations, under sourcing, include examining the seasonal patterns of MRO inventory demand and adjusting purchases accordingly.
The report also provides details regarding day one, quick wins, portfolio analysis, key negotiation strategies of key suppliers, and low-cost/best-cost sourcing analysis.
Maintenance Repair & Operations (MRO) Procurement Intelligence Report Scope
Report Attribute
Details
Maintenance Repair & Operations (MRO) Category Growth Rate
CAGR of 2.2% from 2024 to 2030
Base Year for Estimation
2023
Pricing Growth Outlook
8% - 15% (Annually)
Pricing Models
Cost Plus pricing, contract-based pricing model
Supplier Selection Scope
Cost and pricing, past engagements, productivity, geographical presence
Supplier Selection Criteria
By types of services and supplies (industrial and production equipment, construction and infrastructure repairs, material handling equipment, tools and supplies, etc.), operational and functional capabilities, quality measures, standards followed, certifications, regulations, and others
Report Coverage
Revenue forecast, supplier ranking, supplier matrix, emerging technology, pricing models, cost structure, competitive landscape, growth factors, trends, engagement, and operating model
Key Companies Profiled
Adolf Würth GmbH & Co. KG; Air Liquide S.A.; Applied Industrial Technologies, Inc.; MSC Industrial Direct Co., Inc.; Rubix Group International Limited; Linde Engineering; ERIKS Group; Sonepar Group; WESCO International, Inc.; W. W. Grainger, Inc.; RS Group (formerly Electrocomponents plc); Critica Infrastructure (Henkel)
Regional Scope
Global
Revenue Forecast in 2030
USD 748.85 billion
Historical Data
2021 - 2022
Quantitative Units
Revenue in USD billion and CAGR from 2024 to 2030
Customization Scope
Up to 48 hours of customization free with every report.
Pricing and Purchase Options
Avail customized purchase options to meet your exact research needs. Explore purchase options
Frequently Asked Questions About This Report
b. The global maintenance repair & operations (MRO) category size was valued at USD 643.04 billion in 2023 and is estimated to witness a CAGR of 2.2% from 2024 to 2030.
What are the major factors driving the growth of the maintenance repair & operations (MRO) category?b. The rising demand from the manufacturing sector, the growing requirement to reduce equipment downtime, and the high consumer demand for multiple components and parts are driving the category growth.
b. China, Singapore, Malaysia, Turkey, and UAE (Dubai) are some of the preferred countries for sourcing MRO services.
b. The maintenance repair & operations (MRO) category is fragmented and highly competitive. Some of the leading players include Adolf Würth GmbH & Co. KG, Air Liquide S.A., Applied Industrial Technologies, Inc., MSC Industrial Direct Co., Inc., Rubix Group International Limited, Linde Engineering, ERIKS Group, Sonepar Group, WESCO International, Inc., W. W. Grainger, Inc., RS Group (formerly Electrocomponents plc) and Critica Infrastructure (Henkel).
b. The key cost components in this category are labor, warehousing, rent and utilities, technology or IT infrastructure and overheads. Other costs can include transportation, marketing, legal or tax.
b. Supplier selection is a critical aspect for the client during MRO management. Directing the majority of purchases to a few important distributors or vendors can streamline acquisition and lower administrative expenses. It is important to consider a number of factors, including product quality, service and supplier reliability, shipping speed, and shipping costs. Other important considerations, under sourcing, include examining the seasonal patterns of MRO inventory demand and adjusting purchases accordingly.
Share this report with your colleague or friend.
GET A FREE SAMPLE
This FREE sample includes market data points, ranging from trend analyses to market estimates & forecasts. See for yourself...
Add-on Services
Should Cost Analysis
Component wise cost break down for better negotiation for the client, highlights the key cost drivers in the market with future price fluctuation for different materials (e.g.: steel, aluminum, etc.) used in the production process
Rate Benchmarking
Offering cost transparency for different products / services procured by the client. A typical report involves 2-3 case scenarios helping clients to select the best suited engagement with the supplier
Salary Benchmarking
Determining and forecasting salaries for specific skill set labor to make decision on outsourcing vs in-house.
Supplier Newsletter
A typical newsletter study by capturing latest information for specific suppliers related to: M&As, technological innovations, expansion, litigations, bankruptcy etc.
![gvr icn]()
NEED A CUSTOM REPORT?
We can customize every report - free of charge - including purchasing stand-alone sections or country-level reports, as well as offer affordable discounts for start-ups & universities.
Contact us now to get our best pricing.
![esomar icon]()
ESOMAR certified & member
![ISO]()
ISO Certified
We are GDPR and CCPA compliant! Your transaction & personal information is safe and secure. For more details, please read our privacy policy.
We are committed towards customer satisfaction, and quality service.
Client Testimonials

"The quality of research they have done for us has been excellent..."
ISO Certified


