- Home
- »
- Reports
- »
-
PPE Procurement, Cost & Sourcing Intelligence Report, 2030
![PPE Procurement, Cost & Sourcing Intelligence Report, 2030]()
Personal Protective Equipment Procurement Intelligence Report, 2024 - 2030 (Revenue Forecast, Supplier Ranking & Matrix, Emerging Technologies, Pricing Models, Cost Structure, Engagement & Operating Model, Competitive Landscape)
- Published Date: Jun, 2023
- Base Year for Estimate: 2023
- Report ID: GVR-P-10514
- Format: Electronic (PDF)
- Historical Data: 2021 - 2022
- Number of Pages: 60
PPE - Procurement Trends
“The strong growth in Personal Protective Equipment end-user industry such as construction, manufacturing, and healthcare are driving the market growth.”
Personal Protective Equipment (PPE) procurement has been a vital element for the industry and personal use to ensure equipment continues to be transported globally with agility and resilience. The global market is poised to grow at a 7.2% CAGR from 2024 to 2030. Notable growth in end-use industries such as chemicals, healthcare, construction, and manufacturing and a rise in product innovation in PPE design and materials such as polyolefins, polyamides, and ultrahigh-molecular-weight polyurethane and manufacturing processes are fueling investments. The demand for smart PPE, which increases worker safety to combat injuries and illness, is one of the key trends in the market
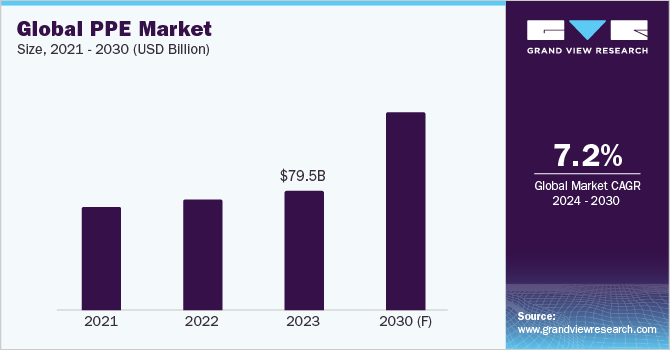
The global Personal Protective Equipment (PPE) market size was valued at USD 79.5 billion in 2023. Segments such as hand protection, protective clothing, eye protection, protective footwear, respiratory protection, and others are integral parts of PPE. More than 80% of the sales come from these four major sectors - hand protection, protective clothing, protective footwear, and respiratory protection. The European region now holds a market share of 30.6%, followed by APAC and North America. The APAC personal protective equipment market is expected to witness the fastest growth.

Continuous technical developments and advancements are expected to propel market expansion. Examples include personnel tracking systems, cooling PPE, the usage of biodegradable materials in PPE kits, and augmented reality glasses for safety. For instance, many companies are deploying new devices that can automatically detect hard hat compliance in real-time and provide workplace alerts. Some devices utilize the latest technology such as NVIDIA AI embedded system and AI platforms that can acquire custom data, visualize the data, and train the machine learning model to validate the results.
Similarly, augmented reality glasses can remotely support workers and assist technicians. For instance, Vuzik’s Blade Smart Glasses are certified for enterprise use as PPE in the U.S. The glasses are ANSI Z87.1 and CE EN166/70 certified across the U.S. and Europe, respectively. Smart glasses are mainly used in industrial applications and worksites.
A few examples of Industrial-grade AR glasses are - RealWear Navigator 500 (compatible with helmets and safety glasses or can be worn independently), RealWear Navigator 520 comes with a large screen size and is chosen mostly for frontline workers, RealWear HMT-1Z1 is a Class 1 Division 1 and ATEX & IECEx Zone 1 certified device and is mainly targeted for hazardous working environments, and Microsoft HoloLens 2, which is used mainly by Airbus and NASA. The HoloLens2 is a dustproof-certified device that provides real-time updates with spatial mapping and 6DoF tracking. It is compatible with hardhat helmets and safety gloves and is useful for manufacturing workers.
Supplier Intelligence
“How can the nature of the PPE market be best described? Who are the key players in this market?”
The industry is highly fragmented across many smaller product segments such as head, eye, ear, and face coverings. Hence, top players account for a comparatively smaller portion of the market share. Suppliers have low bargaining power due to the availability of multiple substitutes and the presence of many small private producers and large-scale global players.
Incumbent players have dominated the market by injecting funds into research and development activities and production capabilities and launching advanced products. Large corporations also engage in strategic partnerships with many small and mid-sized companies to enhance their regional logistics capabilities and procurement management.

Key suppliers covered in the industry:
-
Honeywell International Inc.
-
Lakeland Industries Inc.
-
DuPont
-
3M
-
Ansell Ltd.
-
Cardinal Health
-
Avon Rubber plc
-
COFRA S.r.l.
-
FallTech
-
Kimberly-Clark Corporation
-
MSA Safety Incorporated
-
Dynarex Corporation
Pricing and Cost Intelligence
“What are some of the key cost components or elements involved in the production of PPE? Which factors influence the prices?
Raw materials (such as microporous fabrics, spunbond meltblown spunbond (SMS), SMMS, polypropylene, polyethylene, polyethylene coatings, nylon, or polyester) are the major cost component when it comes to producing PPE. Changes in feedstock prices such as polypropylene or polyethylene significantly impact clothing prices and influence procurement decisions.
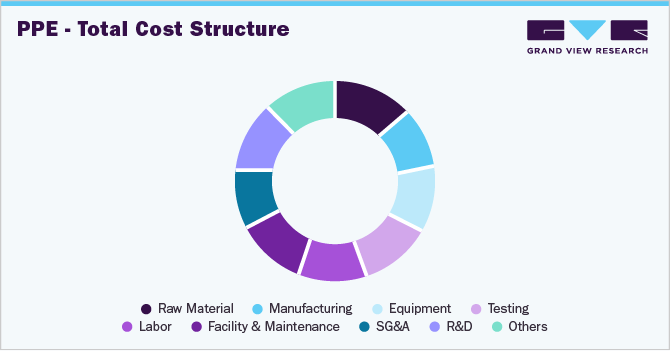
Raw materials (microporous fabrics, spunbond meltblown spunbond (SMS), SMMS, polypropylene, polyethylene, polyethylene coatings, nylon, or polyester), manufacturing, equipment, and labor account for 60% to 70% of the total costs.
The price of clothing depends on multiple factors such as disposable or reusable, kinds of material used, type of PPE clothing produced, longevity, supply chain issues, etc. For instance, in 2020, the prices of N95 masks increased from USD 0.38 to USD 5.75 each, vinyl exam gloves increased from USD 0.02 to USD 0.06, and prices of isolation gowns increased from USD 0.25 to USD 5.00. Reusable face shields increased to USD 4 from USD 0.50, which is almost a 900% price hike due to the pandemic situation.
The following chart below provides a breakdown of the cost structure associated with PPE production. The major cost components include costs of raw materials, equipment, manufacturing process, and testing. The variable cost components include labor cost, depreciation cost, plant overhead cost, facilities and maintenance, insurance cost, SG&A and taxes, R&D, and others. The cost of labor varies widely depending on the region.
On the other hand, in the U.S., prices of major petrochemicals such as polypropylene (PP) and polyethylene (PE) have increased steadily since June 2022, and have risen by 80% to 120% since 2019. PE prices in the U.S. increased from USD 1,200 to USD 2,200 in 2021 due to multiple factors such as tight supply and low imports, February polar vortex, and power outages in Texas which significantly reduced PE production. The continuous supply chain disruptions in ocean freight also impacted the prices. Similarly, PP prices have increased worldwide by 36% to 40% since 2019 due to high input costs and supply shortages in domestic inventories.
In 2022, prices for PPE clothing in Europe were significantly impacted by the Russian-Ukraine Crisis as clothing production is an energy-intensive process. Costs of garments increased to cover the rising energy prices used in the process. In Europe, some of the protective clothing prices increased by 40%. Between January 2021 and January 2023, the domestic industrial producer prices (PP) for energy increased from 106.2 to 241.3. The consumer prices for gas and electricity increased from 105.4 to 172.3. Similarly, the prices of non-woven fabrics have been following a bullish momentum. North America accounts for 15% of the global PPE market share.
Sourcing Intelligence
“Which countries are the leading sourcing destinations for PPE? What is the share of exports?
In the procurement of personal protective equipment, China is the largest exporter worldwide followed by Germany. For instance, in 2020, New York Times estimated that China produced 116 million masks a day during the pandemic. This was almost 12 times its supply before the COVID-19 outbreak. In 2019, globally China exported the largest amount of protective equipment products and accounted for 17.2% of the total market share.
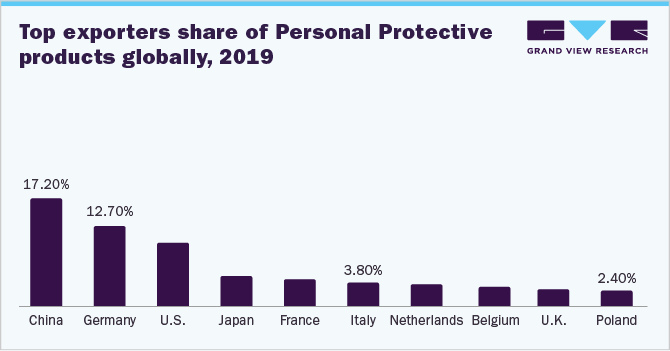
China exported almost 43% of face shields, safety gloves, goggles and visors, protective clothing, mouth and nose protection. On the other hand, the U.S. and E.U. imported 45% and 50% of protective garments from China, respectively.
In terms of PPE procurement, most suppliers opt for hybrid/bundled outsourcing to achieve higher cost savings, reduce security-related risks, and ensure better customization.
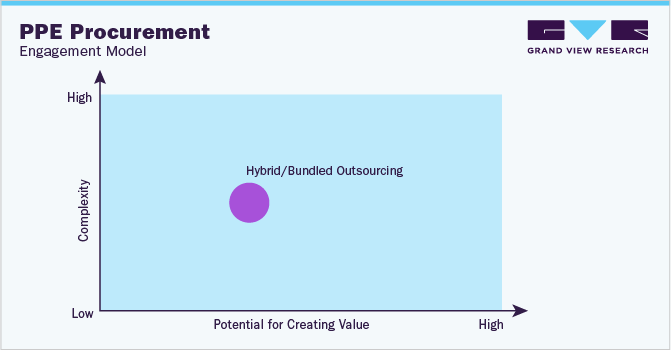
The producers are increasing their investments in research and development trying to develop new products. To lower risks for customers, manufacturers are also working with independent suppliers and collaborating with those who have adopted a global delivery model. Clients should ensure that there are no inactive suppliers in their supply chains and start concentrating on strategic alliances for value-added procurement.
The PPE procurement intelligence report also provides details regarding day one, quick wins, portfolio analysis, key negotiation strategies of key suppliers, and low-cost/best-cost sourcing analysis.
Producers are increasing their investments in research and development to develop new products. To lower risks for customers, manufacturers are also working with independent suppliers and collaborating with those who have adopted a global delivery model. Clients should ensure that there are no inactive suppliers in their supply chains and start concentrating on strategic alliances for value-added procurement.
The PPE Procurement Intelligence report also provides details regarding peer analysis, recent supplier developments, supply-demand analysis, competitive landscape, KPIs, SLAs, risk assessment, negotiation strategies and low-cost/best-cost sourcing analysis. In the report, we have tried to provide a holistic industry perspective, an overview of the supplier landscape – the presence of different types of players and the competitive pressure within the industry as a whole (PORTER’s). Similarly, the supply chain practices under sourcing are also covered. One such instance is the operating or engagement model which encompasses all the business processes conducted within an organization. It is an integral aspect of the company's operations and plays a crucial role in its success.
PPE Procurement Intelligence Report Scope
Report Attribute
Details
Growth Rate
CAGR of 7.2% from 2024 to 2030
Base Year for Estimation
2023
Pricing growth Outlook
8% - 10%
Pricing Models
Volume-based pricing model, Fixed price pricing model
Supplier Selection Scope
Cost and pricing, Past engagements, Productivity, Geographical presence
Supplier selection criteria
Types of products (first responder safety, fall protection and first aid, gas, and flame detection, hand-eye and face protection, respiratory protection, etc.), technical specifications, operational capabilities, regulatory standards and mandates, category innovations, and others.
Report Coverage
Revenue forecast, supplier ranking, supplier positioning matrix, emerging technology, pricing models, cost structure, competitive landscape, growth factors, trends, engagement, and operating model
Key companies profiled
Honeywell International Inc.; Lakeland Industries Inc.; DuPont; 3M; Ansell Ltd.; Kimberly-Clark Corporation; COFRA S.r.l.; FallTech; MSA Safety Incorporated; Dynarex Corporation; Cardinal Health; Avon Rubber plc
Regional scope
Global
Historical data
2021 - 2022
Revenue Forecast in 2030
USD 128.14 billion
Quantitative units
Revenue in USD billion and CAGR from 2024 to 2030
Customization scope
Up to 48 hours of customization free with every report.
Pricing and purchase options
Avail customized purchase options to meet your exact research needs. Explore purchase options
Frequently Asked Questions About This Report
b. The global Personal Protective Equipment market was valued at USD 79.5 billion in 2023 and is estimated to witness a CAGR of 7.2% from 2024 to 2030.
b. The strong growth in end-user industries and the increasing demand for PPE due to the rise in product innovation in PPE design, materials such as polyolefins, polyamides, and ultrahigh-molecular-weight polyurethane, and manufacturing processes which fueled end-use adoption are driving the growth of global PPE market.
b. According to the LCC/BCC sourcing analysis, China and Germany are the ideal destinations for sourcing Personal Protective Equipment (PPE).
b. The global PPE industry is highly fragmented across many smaller product segments such as head, eye, ear, and face coverings. Some of the key Personal Protective Equipment (PPE) suppliers are Honeywell, Lakeland Industries, Dupont, 3M, Ansell, Avon Rubber Plc, COFRA S.R.L, and FallTech.
b. Raw materials, equipment, manufacturing process, testing, and labor are the largest cost components accounting for more than 60-70% of the total fixed costs of PPE production.
b. Adopting innovative sourcing practices, increasing spend transparency, shifting to low-cost countries for sourcing, and standardizing the contract period can be considered some of the best sourcing practices in the Personal Protective Equipment market.
Share this report with your colleague or friend.
GET A FREE SAMPLE
This FREE sample includes market data points, ranging from trend analyses to market estimates & forecasts. See for yourself...
Add-on Services
Should Cost Analysis
Component wise cost break down for better negotiation for the client, highlights the key cost drivers in the market with future price fluctuation for different materials (e.g.: steel, aluminum, etc.) used in the production process
Rate Benchmarking
Offering cost transparency for different products / services procured by the client. A typical report involves 2-3 case scenarios helping clients to select the best suited engagement with the supplier
Salary Benchmarking
Determining and forecasting salaries for specific skill set labor to make decision on outsourcing vs in-house.
Supplier Newsletter
A typical newsletter study by capturing latest information for specific suppliers related to: M&As, technological innovations, expansion, litigations, bankruptcy etc.
![gvr icn]()
NEED A CUSTOM REPORT?
We can customize every report - free of charge - including purchasing stand-alone sections or country-level reports, as well as offer affordable discounts for start-ups & universities.
Contact us now to get our best pricing.
![esomar icon]()
ESOMAR certified & member
![ISO]()
ISO Certified
We are GDPR and CCPA compliant! Your transaction & personal information is safe and secure. For more details, please read our privacy policy.
We are committed towards customer satisfaction, and quality service.
Client Testimonials

"The quality of research they have done for us has been excellent..."
ISO Certified


