
- Home
- »
- Automotive & Transportation
- »
-
Digital Freight Matching Market Size & Share Report, 2033GVR Report cover
![Digital Freight Matching Market (2026 - 2033)Report]()
Digital Freight Matching Market (2026 - 2033)
Size, Share & Trends Analysis Report By Service (Freight Matching Services, Value Added Services), By Platform (Web-based, Mobile-based), By Transportation Mode, By Industry, By Region, And Segment Forecasts
Market Size, 2025
$61.5BMarket Estimate, 2026
$80.4BMarket Forecast, 2033
$613.8BCAGR, 2026–2033
33.7%Digital Freight Matching Market Summary
The global digital freight matching market size was valued at USD 61.5 billion in 2025 and is projected to grow from USD 80.4 billion in 2026 to USD 613.8 billion by 2033, growing at a CAGR of 33.7% from 2026 to 2033. North America dominated the global market with the largest revenue share of 33.1% in 2025. The growing need for automation and digitization across supply chains drives the growth of the digital freight matching industry.
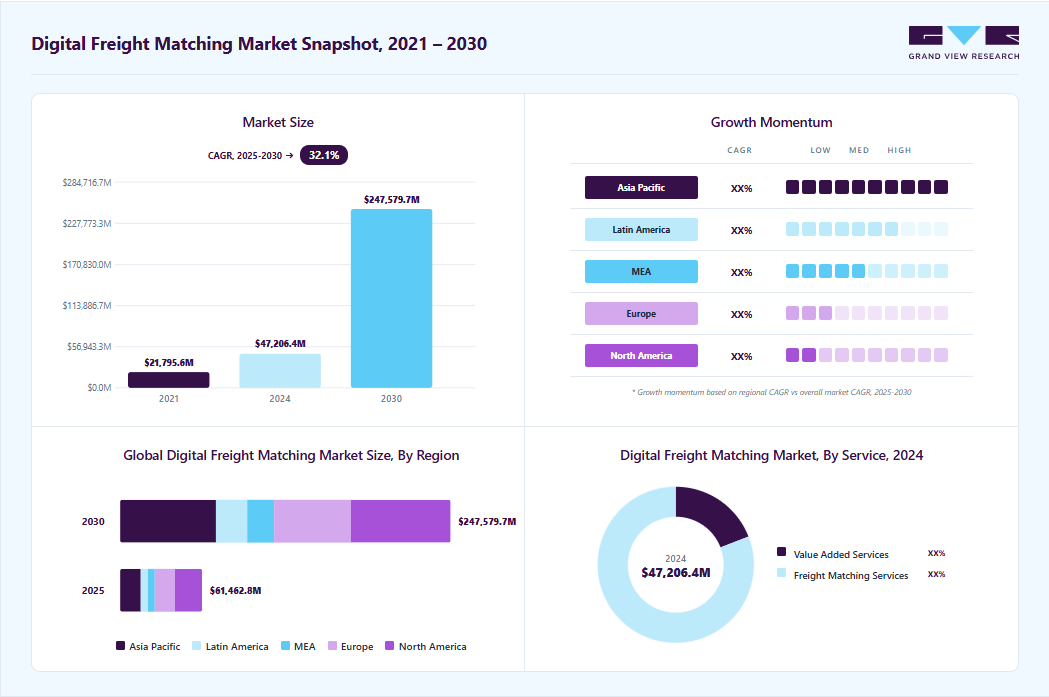
Key Market Trends & Insights
- By service: Freight matching services segment dominated the market, with a revenue share of 80.7% in 2025.
- By platform: Mobile-based segment held the largest market share of 62.6% in 2025.
- By transportation mode: Full truckload (FTL) segment accounted for the largest revenue share of 43.2% in 2025.
- By industry: Food & beverages segment accounted for the largest revenue share in 2025.
Regional Highlights
- Largest regional market: North America (33.1% revenue share, 2025)
- Fastest-growing regional market: Asia Pacific (highest CAGR, 2026-2033)
- By country: The U.S. held the largest market share in 2025.
Market Size & Forecast
- Market size in 2025: USD 61.5 Billion
- Estimated market size in 2026: USD 80.4 Billion
- Projected market size by 2033: USD 613.8 Billion
- CAGR (2026-2033): 33.7%
Digital freight matching platforms provide solutions to shippers and carriers by connecting them in real time. It is a relatively new technology offered through an application or a platform that enables shippers to share their load requirements and assist carriers in finding and booking loads efficiently. Digital freight matching is better than traditional methods as it handles challenging manual processes such as posting and booking loads, making confirmation calls, and managing paperwork.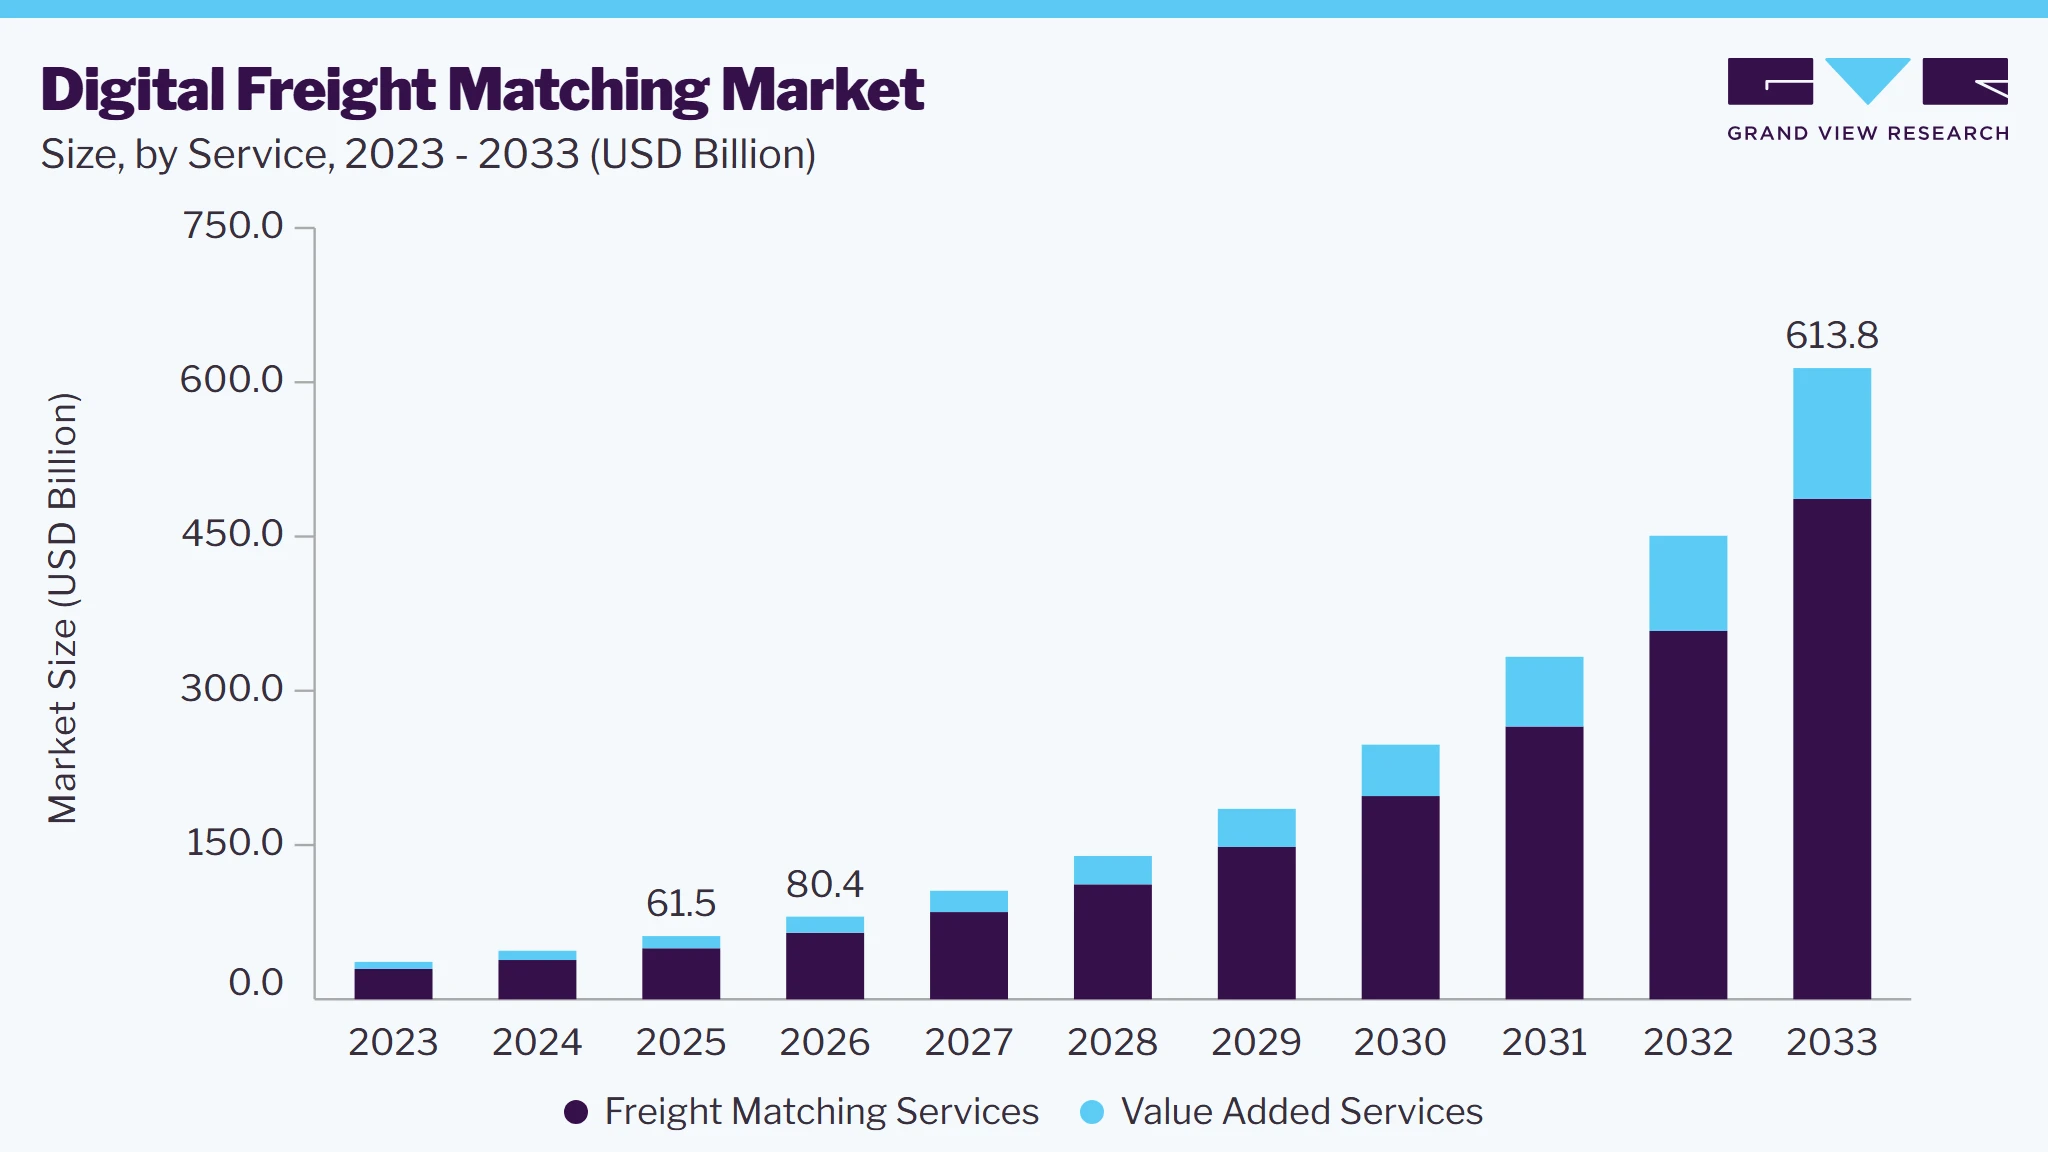
Digital freight matching is gaining popularity in the logistics industry as it has integration capabilities with Enterprise Resource Planning (ERP) and Transportation Management Systems (TMS). The platforms offer improved operational efficiency and quick and efficient capacity fulfillment. The platforms are developed using advanced technologies such as Artificial Intelligence (AI), Machine Learning (ML), and predictive analytics in developing algorithms to match loads with carriers automatically. In March 2023, Freight Technologies, Inc. announced the launch of Fr8App, a digital freight matching platform. The platform uses ML algorithms to match shippers with carriers. With this launch, the company aimed to make the shipping process more cost-efficient and faster.
Digital freight matching platforms have been adopted rapidly in North America, a region with high penetration of internet and smartphones. Moreover, the region has the presence of many prominent players. The market is fragmented, with many established and new companies entering the market. The market players are adopting strategies such as product development and acquisition to gain a competitive edge.
The rapid growth of e-commerce is a major driver for the digital freight matching industry, creating increased demand for efficient, flexible, and on-demand freight solutions. E-commerce generates a high volume of small, frequent shipments requiring timely delivery. DFM platforms can quickly connect shippers with available carriers, streamlining the transportation process to handle the surge in e-commerce freight efficiently. Seasonal peaks in e-commerce, such as holiday shopping seasons, create surges in freight demand. Digital freight matching platforms enable shippers to scale up quickly, meeting peak demand without relying on traditional brokerage processes, which may be slower and more costly.
User-friendly mobile applications are a significant growth driver in the digital freight matching industry because they streamline operations, improve accessibility, and enhance usability for carriers, drivers, and shippers. Many small or independent carriers lack advanced logistics infrastructure. User-friendly mobile apps make it easy for these carriers to navigate the digital freight matching platform, boosting participation and creating a more competitive, diverse carrier pool.
The demand for sustainability in logistics is a powerful industry growth driver, as digital freight matching platforms provide solutions that help reduce environmental impact and promote greener operations. These platforms optimize freight loads by reducing the number of empty or partially filled trucks on the road. By matching available loads with trucks that would otherwise return empty, these platforms minimize fuel consumption and greenhouse gas emissions, meeting both operational and sustainability goals.
Market Dynamics
The digital freight matching market is evolving amid sustained growth in global freight volumes, rising cost pressures across logistics networks, and increasing demand for real-time visibility and efficiency. Advances in cloud computing, mobile applications, artificial intelligence, and data analytics are reshaping how shippers and carriers connect, price capacity, and manage freight flows. Market direction is characterized by a gradual shift from broker-led freight sourcing toward platform-driven, algorithm-based matching models that emphasize transparency, speed, and optimized asset utilization.
The increasing need for real-time freight visibility is a major driver of the digital freight matching market. Shippers and carriers are seeking greater transparency across transportation operations to improve planning and reduce inefficiencies. Digital freight matching platforms provide instant access to available loads and carrier capacity, enabling faster decision-making. Real-time tracking and visibility help reduce empty miles, improve fleet utilization, and optimize transportation costs. Logistics providers are increasingly adopting digital platforms to enhance service quality and operational performance. The ability to streamline freight procurement processes further strengthens demand for these solutions. These factors contribute to the growth of the market.
Despite strong value propositions, adoption of digital freight matching solutions remains constrained among small and mid-sized carriers due to limited digital literacy, fragmented fleet ownership, and resistance to platform dependency. Many operators continue to rely on relationship-based contracting and phone-based load sourcing, slowing platform penetration in highly fragmented markets.
This restraint disproportionately affects emerging economies and rural freight corridors where smartphone penetration, data connectivity, and trust in digital payments remain uneven. Platform adoption in the less-than-truckload (LTL) and regional freight segments is particularly affected, moderating overall market expansion and slowing the network effects critical to scaling digital freight ecosystems.
The growing demand for end-to-end logistics visibility is enabling digital freight matching platforms to expand beyond load matching into integrated service offerings. Embedded payments, freight financing, shipment tracking, carbon reporting, and analytics are increasingly being layered onto core platforms, driven by shipper demand for consolidated logistics solutions. This evolution creates significant growth potential for platforms with strong data capabilities and ecosystem partnerships. Vendors offering bundled freight execution, visibility, and financial services are best positioned to capture higher revenue per transaction and deepen customer stickiness, particularly in full truckload (FTL), e-commerce, and time-sensitive industry verticals.
Analyst Perspective
The digital freight matching market is transitioning from a cost-control solution to a core type of digital operations strategy. Strong demand is driven by enterprise-wide inventory optimization initiatives and the expansion of smart manufacturing frameworks. Technological differentiation is increasingly centered on analytics, connectivity, and ecosystem integration rather than hardware alone. Investment activity is expected to favor vendors with scalable software platforms and global service capabilities. Competitive dynamics indicate a shift toward solution bundling and long-term service-led engagements.
Service Insights
Based on service, the freight matching services segment led the market with the largest revenue share of 80.7% in 2025. It is expected to grow at a significant CAGR from 2025 to 2030. Market players provide freight matching services like freight listing and brokerage, and online transaction services. These services are the platform's core services, and the market players have contracts with shippers and carriers for using brokerage services. The growing innovation in technologies such as AI and ML and their adoption in digital freight matching platforms is driving the growth of this segment. Algorithms powered by these technologies can help in various freight brokerage applications such as capacity management and dynamic pricing.
The value added services segment is anticipated to grow at the fastest CAGR over the forecast period. Value-added services include services such as support and insurance services. Moreover, these services can offer shippers access to TMS and carriers access to software for managing traffic ticket records. These services address the needs of carriers and shippers, improving their engagement on the platform. The need for essential services on a single platform is driving the growth of this segment.
Platform Insights
Based on platform, the mobile-based segment led the market with the largest revenue share of 62.6% in 2025. It is expected to grow at the fastest CAGR from 2025 to 2030. Most market players provide mobile applications on Google Play and Apple Inc.'s App Store. China-based Full Truck Alliance (JiangSu ManYun Software Technology Co., Ltd.) provides freight matching and value-added services through mobile apps such as Yunmanman and Huochebang. Mobile-based platforms are faster than web-based apps and can work offline. Moreover, they are safer as they must be approved on the app store. The growing penetration of smartphones and ease of use drive the segment's growth.
The web-based segment is expected to grow at a considerable CAGR over the forecast period. Web-based digital freight matching platforms are platforms accessed through web browsers. Web-based applications are easier to build compared to mobile apps. Moreover, they can be launched quickly, as they do not require app store approval. The ease of maintenance of web-based platforms is driving the segment’s growth.
Transportation Mode Insights
Based on transportation mode, the full truckload segment led the market with the largest revenue share of 43.2% in 2025. Full truckload (FTL) involves booking the entire truck, and the goods are delivered from the starting to the end point without intermediate loading. It is a good option for shipping temperature-sensitive goods not meant to be transported with other goods. Moreover, it is a good option for transporting goods quickly without stopovers. The flexibility and quickness of Full truckload (FTL) transportation is driving the segment’s growth.
The intermodal segment is anticipated to witness a notable CAGR over the forecast period. Intermodal shipping includes goods shipment through a combination of truckload and rail. Intermodal transportation is a good option when shipping needs to be done over longer distances. It is a lower-cost alternative to truckload and a more environmentally sustainable option. Asia Pacific countries are taking initiatives to make intermodal transportation more effective by expanding their rail network. Intermodal transportation's cost-effectiveness and environmental sustainability drive the segment's growth.
Industry Insights
Based on industry, the food & beverages led the market with the largest revenue share of 21.5% in 2025. The food & beverage industry consists of time-sensitive goods. The quality of the products can deteriorate over time and require specific conditions across the supply chain. Hence, they require quick and efficient transportation solutions to maintain their quality. A digital freight matching platform can improve the overall speed of freight brokerage operations as the platform connects the shippers with carriers as per load requirements. The need to maintain food quality and ensure regulatory compliance is driving the segment’s growth.
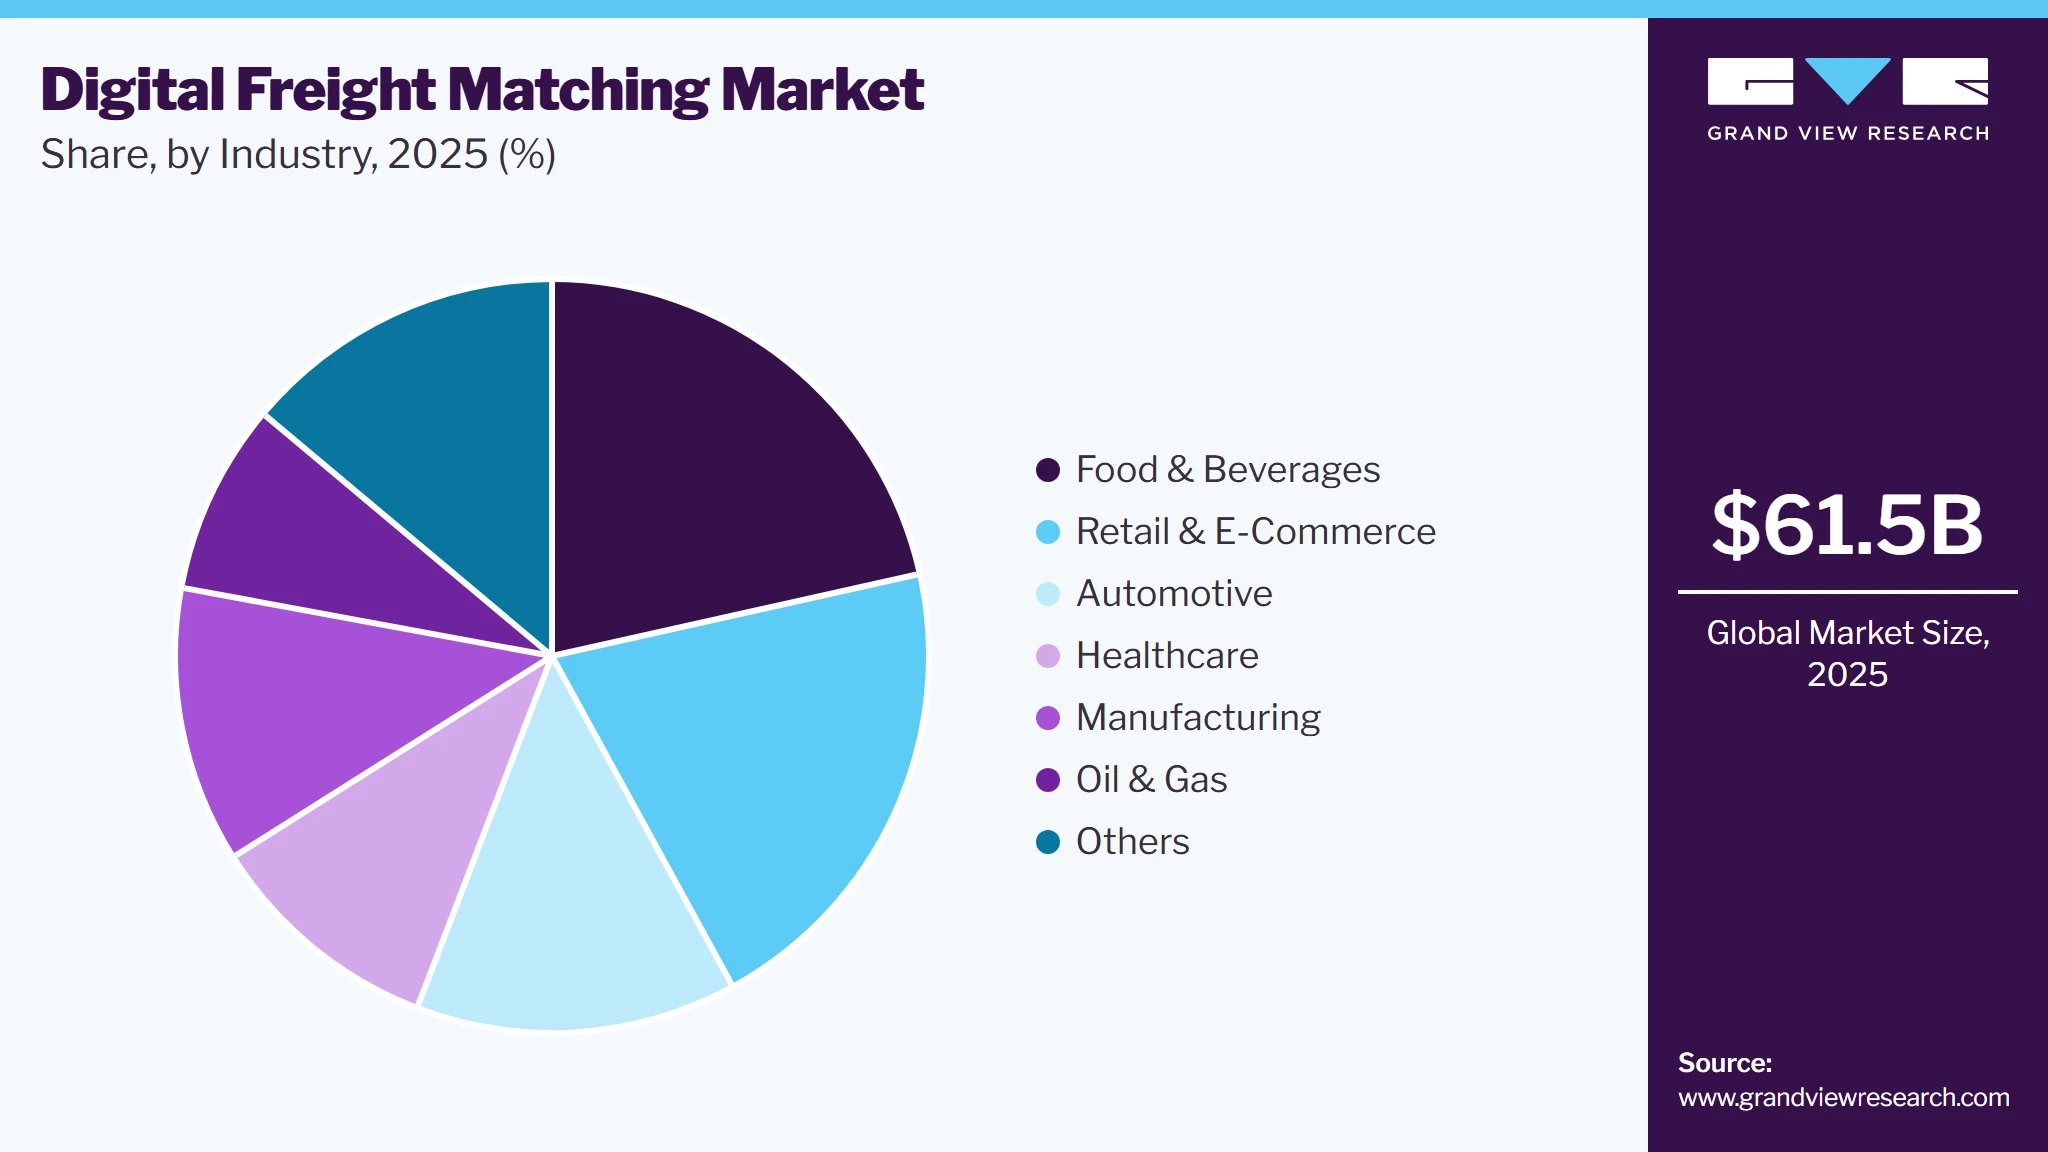
The retail & e-commerce segment is anticipated to witness the fastest CAGR over the forecast period. Growing access to the internet and smartphones is driving the growth of the e-commerce sector. Moreover, e-commerce provides customers convenience as they can shop for goods from their homes. The COVID-19 pandemic accelerated e-commerce sales as people stayed at home. According to the U.S. Department of Commerce’s Annual Retail Trade Survey (ARTS) in 2020, e-commerce sales in the U.S. rose by 43% in 2020 compared to 2019. The need to meet customers’ quick delivery expectations drive the segment’s growth.
Regional Insights
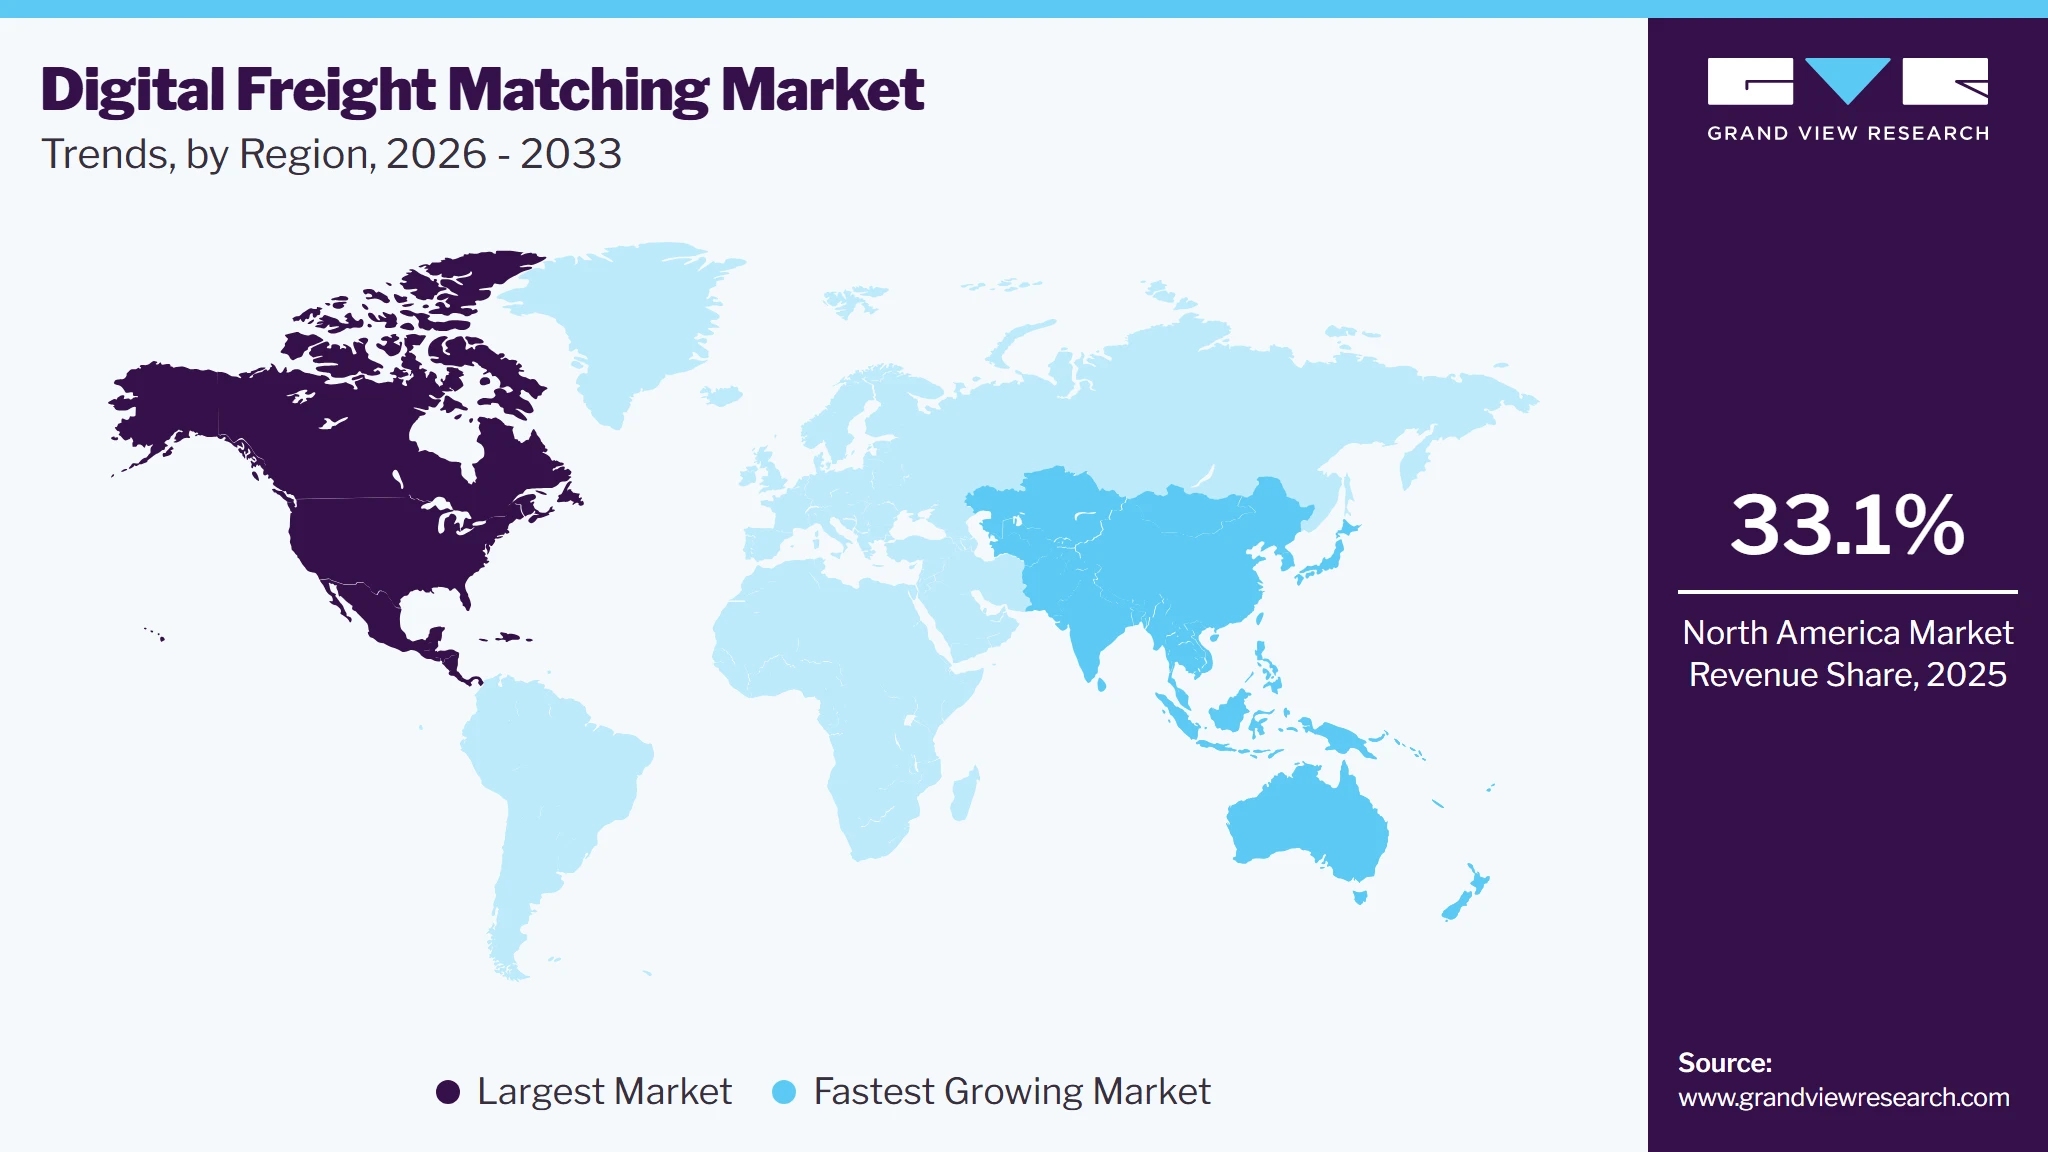
North America dominated the global digital freight matching market with the largest revenue share of 33.1% in 2025. North America has a developed technological infrastructure with high internet and smartphone penetration. Hence, the shippers and carriers in the region can access digital freight matching platforms. The presence of prominent market players such as U.S.-based Uber Freight (Uber Technologies, Inc.) and Convoy, Inc., and high Research and Development (R&D) activity of technologies such as AI and ML in the region is a favorable environment for the growth of the market in the region.
U.S. Digital Freight Matching Market Trends
The digital freight matching market in the U.S. held the largest share in the North America region in 2025. The U.S. digital freight matching industry is expanding rapidly due to the high demand for efficiency, cost reduction, and flexibility driven by e-commerce growth, and a push for sustainability. Investments in logistics technology, along with advancements in AI, IoT, and data analytics, enable digital freight matching platforms to offer smarter, real-time load matching and regulatory compliance support. Smaller carriers are increasingly adopting these accessible digital tools to remain competitive, aligning with a trend toward greater digitalization and sustainable logistics solutions.
Asia Pacific Digital Freight Matching Market Trends
Asia Pacific is expected to grow at the fastest CAGR from 2026 to 2033. Asia Pacific makes up a significant share of the global population, and the e-commerce industry is growing rapidly. Hence, digital freight matching platforms are likely to be adopted at a significant rate to meet consumer demand in the region. According to GSM Association’s 2023 report, about 47% of Asia Pacific’s population doesn’t have mobile internet access. However, smartphone adoption and 5G connections are expected to grow significantly by 2030. Improving technological infrastructure and growing e-commerce sales are driving the market’s growth in the region.
Key Digital Freight Matching Company Insights
Some of the key players operating in the market include Uber Freight (Uber Technologies, Inc.); C.H. Robinson Worldwide, Inc.; and XPO, Inc.
-
Uber Freight (Uber Technologies, Inc.) is one of the leading digital freight matching platforms that connects trucking companies with shippers, enabling more efficient and transparent freight logistics. Launched in 2016 as part of Uber Technologies, Inc.’s broader strategy to disrupt the logistics industry, Uber Freight provides a technology-driven solution to streamline the freight booking process, offering real-time pricing, instant load booking, and end-to-end visibility.
Freight Technologies, Inc. and Freight Tiger are some of the emerging participants in the target market.
-
Freight Technologies, Inc. is a U.S.-based technology-driven logistics company specializing in providing digital freight matching solutions. The company focuses on optimizing the freight management process by connecting shippers with carriers through its platform, which uses advanced algorithms and machine learning to improve route planning, pricing, and logistics efficiency. It has a presence in North America across the U.S. and Mexico.
Key Digital Freight Matching Companies:
The following are the leading companies in the digital freight matching market.
-
XPO, Inc.
-
Freight Tiger
-
Redwood Logistics
-
Convoy (Flexport Freight Tech LLC)
-
Freight Technologies, Inc.
-
Cargomatic Inc.
-
C.H. Robinson Worldwide, Inc.
-
Roper Technologies, Inc.
-
Uber Freight (Uber Technologies, Inc.)
-
Full Truck Alliance (JiangSu ManYun Software Technology Co., Ltd.)
Competitive Benchmarking
Category
Operating Strategies
Competitive Edge
Weakness
Established Players (Uber Freight (Uber Technologies, Inc.), C.H. Robinson Worldwide, Inc., XPO, Inc., Redwood Logistics)
- Established players focus on expanding digital freight networks, integrating AI-driven load matching, enhancing transportation visibility, and strengthening partnerships with shippers and carriers. They invest heavily in technology platforms, analytics, and logistics automation to improve marketplace efficiency.
- Strong carrier networks, extensive shipper relationships, advanced technology infrastructure, large transaction volumes, and established brand recognition provide significant competitive advantages. Their scale enables better pricing, broader geographic coverage, and higher platform liquidity.
- Dependence on freight market conditions, margin pressure from pricing competition, and the need for continuous technology investment can impact profitability. Market volatility may also affect transaction volumes.
Emerging Players (Convoy (Flexport Freight Tech LLC), Freight Technologies, Inc., Freight Tiger)
- Emerging players focus on technology-driven freight matching, real-time visibility, automated booking, dynamic pricing, and regional market expansion. They emphasize innovation, user-friendly platforms, and digital-first logistics models to attract shippers and carriers.
- Greater agility, faster innovation cycles, specialized digital freight expertise, and strong focus on automation enable these companies to address evolving logistics requirements effectively.
- Compared to larger competitors, these companies typically have smaller carrier ecosystems, lower market penetration, limited geographic reach, and fewer resources for large-scale expansion and technology development.
Recent Developments
-
In August 2024, Uber Freight (Uber Technologies, Inc.) announced the launch of Uber Freight Shipping. It is an enhanced platform built on the successful Shipper Platform and offers an easy-to-use, free service for quoting, booking, and tracking shipments. By integrating advanced technology, Uber Freight ensures faster, more reliable freight booking with real-time tracking, 24/7 live support, and expanded ERP integration aimed at improving visibility and efficiency for businesses of all sizes.
-
In August 2024, Freight Technologies, Inc. announced its integration with Tecnomotum, a leading data transmission company in Mexico, to enhance the Fr8App, its AI-powered freight-matching platform. This collaboration improves fleet connectivity, optimizes logistics operations, and provides real-time data, further solidifying Fr8App’s position as a leader in cross-border shipping within the United States-Mexico-Canada Agreement (USMCA) region.
-
In November 2021, Uber Freight (Uber Technologies, Inc.) announced the acquisition of Transplace, a tech-enabled solutions and services platform for transportation and logistics networks, for USD 2.25 billion. With this acquisition, Uber Freight (Uber Technologies, Inc.) aimed to meet the needs of carriers and shippers by using Transplace’s platform.
Digital Freight Matching Market Report Scope
Report Attribute
Details
Market size value in 2025
USD 61.5 billion
Market size value in 2026
USD 80.4 billion
Revenue forecast in 2033
USD 613.8 billion
Growth rate
CAGR of 33.7% from 2026 to 2033
Base year for estimation
2025
Historical data
2021 - 2024
Forecast period
2026 - 2033
Quantitative units
Revenue in USD billion, and CAGR from 2026 to 2033
Report coverage
Revenue forecast, company market share, competitive landscape, growth factors, and trends
Segments covered
Service, platform, transportation mode, industry, region
Regional scope
North America; Europe; Asia Pacific; Latin America; MEA
Country scope
U.S.; Canada; Mexico; Germany; U.K.; France; China; Japan; India; South Korea; Australia; Brazil; Saudi Arabia; UAE; and South Africa
Key companies profiled
Uber Freight (Uber Technologies, Inc.); Redwood Logistics; C.H. Robinson Worldwide, Inc.; XPO, Inc.; Convoy (Flexport Freight Tech LLC); Full Truck Alliance (JiangSu ManYun Software Technology Co., Ltd.); Freight Technologies, Inc.; Freight Tiger; Cargomatic Inc.; Roper Technologies, Inc.
Customization scope
Free report customization (equivalent up to 8 analysts' working days) with purchase. Addition or alteration to country, regional & segment scope.
Pricing and purchase options
Avail customized purchase options to meet your exact research needs. Explore purchase options
Global Digital Freight Matching Market Report Segmentation
This report forecasts revenue growths at global, regional, as well as at country levels and offers qualitative and quantitative analysis of the market trends for each of the segment and sub-segments from 2021 to 2033. For the purpose of this study, Grand View Research has segmented the global digital freight matching market report based on service, platform, transportation mode, industry, and region:
-
Service Outlook (Revenue, USD Million, 2021 - 2033)
-
Freight Matching Services
-
Value Added Services
-
-
Platform Outlook (Revenue, USD Million, 2021 - 2033)
-
Web-based
-
Mobile-based
-
Android
-
iOS
-
-
-
Transportation Mode Outlook (Revenue, USD Million, 2021 - 2033)
-
Full Truckload (FTL)
-
Less-than-Truckload (LTL)
-
Intermodal
-
Others
-
-
Industry Outlook (Revenue, USD Million, 2021 - 2033)
-
Food & Beverages
-
Retail & E-commerce
-
Manufacturing
-
Oil & Gas
-
Automotive
-
Healthcare
-
Others
-
-
Regional Outlook (Revenue, USD Million, 2021 - 2033)
-
North America
-
U.S.
-
Canada
-
Mexico
-
-
Europe
-
UK
-
Germany
-
France
-
-
Asia Pacific
-
India
-
China
-
Japan
-
South Korea
-
Australia
-
-
Latin America
-
Brazil
-
-
Middle East & Africa
-
Kingdom of Saudi Arabia (KSA)
-
U.A.E.
-
South Africa
-
-
Research Methodology
The digital freight matching market figures in this report are based on a proven research process that combines executive interviews with secondary research from proprietary databases, company filings, and recognized regulatory and institutional sources. Market size is built through value-chain sizing - reconciling supply-side and demand-side estimates - and triangulated with bottom-up and top-down approaches. Every estimate passes multiple levels of expert validation before publication, with each digital freight matching segment quantified using the revenue-capture definitions in the table below.
Segment Definition
Segment - Service
Revenue capture definition
Freight Matching Services
This segment captures revenue generated from digital platforms that connect shippers with carriers by matching available freight loads with available transportation capacity in real time.
Value Added Services
Value added services refer to revenue derived from ancillary offerings, including freight visibility subscriptions, digital documentation, payment processing, freight financing, insurance facilitation, analytics dashboards, and sustainability reporting tools.
Segment - Platform
Revenue capture definition
Web Based
This segment captures revenue generated from digital freight matching platforms accessed through web browsers on desktops and laptops.
Mobile-Based
This segment captures revenue generated from freight matching applications designed for smartphones and tablets, enabling users to access freight marketplace services, carrier matching, tracking, and communication capabilities while on the move. The segment includes mobile based such as android and iOS.
- Android: This segment captures revenue generated from mobile-based digital freight matching applications operating on the Android operating system.
- iOS: This segment captures revenue generated from mobile-based digital freight matching applications operating on Apple's iOS platform.
Segment - Transportation Mode
Revenue capture definition
Full Truckload (FTL)
This segment captures revenue generated from digital freight matching services used for shipments that occupy the entire capacity of a truck.
Less-than-Truckload (LTL)
This segment captures revenue generated from freight matching services that consolidate shipments from multiple shippers into a single truck.
Intermodal
This segment captures revenue generated from digital freight matching solutions supporting freight transportation that utilizes multiple transportation modes, such as truck, rail, air, or maritime shipping, within a single shipment journey.
Others
This segment captures revenue generated from freight matching services supporting additional transportation modes and specialized logistics requirements, such as dedicated freight services, expedited transportation, and regional delivery solutions.
Segment - Industry
Revenue capture definition
Food & Beverages
This segment captures revenue generated from digital freight matching platforms used by food and beverage manufacturers, distributors, and retailers to manage transportation of raw materials, packaged foods, beverages, and perishable goods.
Retail & E-commerce
This segment captures revenue generated from freight matching solutions supporting transportation and fulfillment activities for retailers and e-commerce companies.
Manufacturing
This segment captures revenue generated from digital freight matching services used by manufacturers to transport raw materials, components, work-in-progress inventory, and finished goods across production and distribution networks.
Oil & Gas
This segment captures revenue generated from freight matching solutions supporting the transportation of equipment, machinery, materials, chemicals, and supplies required for oil and gas exploration, production, refining, and distribution activities.
Automotive
This segment captures revenue generated from digital freight matching platforms used by automotive manufacturers, suppliers, and distributors for the transportation of vehicle components, spare parts, assemblies, and finished vehicles.
Healthcare
This segment captures revenue generated from freight matching solutions supporting the transportation of pharmaceuticals, medical devices, healthcare supplies, laboratory materials, and other healthcare-related products requiring reliable and compliant logistics services.
Others
This segment captures revenue generated from freight matching services utilized across additional industries including construction, chemicals, agriculture, aerospace, consumer goods, energy, and industrial equipment sectors.
Estimation Model
Layer Name
Key Question
Description
Freight Transportation Demand Base Layer
Which freight movements require shipper-carrier connectivity?
Establishes the total potential demand base by identifying freight transportation activities across road, rail, air, and multimodal logistics networks. It evaluates factors such as freight volumes, trucking activity, shipment frequency, transportation spending, and trade flows across industries.
Addressable Digital Freight Matching Market Layer
Which freight transactions can realistically be digitized through matching platforms?
Refine the total freight ecosystem into the serviceable digital freight matching market by considering factors such as internet penetration, digital logistics adoption, fleet connectivity, cloud infrastructure availability, carrier participation, and transportation marketplace adoption. It determines the share of freight transactions that can potentially be managed through digital freight matching platforms.
Digital Freight Matching Adoption Layer
Who is actively utilizing digital freight matching platforms?
Estimate annual demand generation by analyzing the adoption of digital freight matching solutions among shippers, freight brokers, third-party logistics providers (3PLs), carriers, and fleet operators. It converts the addressable market into measurable platform transactions, freight bookings, carrier matches, and subscription users.
Monetization Layer
How does platform adoption translate into market revenue?
Convert digital freight matching demand into market revenue through transaction fees, subscription charges, platform licensing, and value-added logistics services. Revenue is generated by applying platform pricing models across different user categories and freight transaction volumes.
Delivered Customizations
This report has been delivered with the following In-depth customizations
Client Request
Customization Delivered
Value Adds
Regional Digital Freight Matching Market Opportunity Assessment
Country/region-wise market sizing and forecasts
Analysis of demand, adoption trends, and regulatory landscape
Identification of high-growth regions and investment hotspots
Identified region-specific growth opportunities
Supported expansion and go-to-market strategy
Enabled informed regional investment decisions
Cross-Segmentation Analysis for the Digital Freight Matching Market
Criss-cross market analysis by service, platform, transportation mode and industry
Demand and adoption assessment across key segments
Segment attractiveness and growth potential benchmarking
Identified high-potential market segments
Supported targeted product positioning and marketing strategy
Improved customer and segment prioritization
Competitive Benchmarking and Strategic Positioning in the Digital Freight Matching Market
Benchmarking of key competitors across products, pricing, partnerships, and innovation
Comparative assessment of market share, capabilities, and strategies
Analysis of competitive strengths, gaps, and differentiation areas
Identified competitive white spaces and growth gaps
Supported strategic positioning and differentiation
Enabled data-driven competitive strategy development
Frequently Asked Questions About This Report
Some key players operating in the digital freight matching market include Uber Freight (Uber Technologies, Inc.), Redwood, C.H. Robinson Worldwide, Inc., XPO, Inc., Convoy, Inc, Full Truck Alliance (JiangSu ManYun Software Technology Co., Ltd.), Freight Technologies, Inc., Freight Tiger, Cargomatic Inc., and Roper Technologies, Inc.
North America dominated the global market, accounting for the largest revenue share of 33.1% in 2025.
Asia Pacific is the fastest growing region over the forecast period.
The mobile-based segment led the market with the largest revenue share of 62.6% in 2025, while the web-based is the fastest-growing segment.
The food & beverages led the market with the largest revenue share of 21.5% in 2025, while retail & e-Commerce is the fastest-growing segment.
The global digital freight matching market is expected to grow at a compound annual growth rate of 33.7% from 2026 to 2033, reaching USD 613.8 billion by 2033.
Freight matching services segment dominated the market, accounting for 80.7% of revenue in 2025. The growing innovation in technologies such as AI and ML and their adoption in digital freight matching platforms is driving the growth of this segment.
The growing need for automation and digitization across supply chains is driving the expansion of the digital freight matching industry.
The global digital freight matching market size was valued at USD 61.5 billion in 2025 and is estimated at USD 80.4 billion in 2026.
About the Author(s)
Automotive & Transportation Research Team
Technology · Automotive & TransportationThis report was authored by the automotive & transportation research team at Grand View Research - comprising two research analysts, one senior research analyst, and one industry expert - with specialized expertise in the automotive & transportation segment of the technology industry. All findings are based on proprietary technology databases, executive interviews, and regulatory analysis, subject to internal peer review prior to publication.
Last Updated:
Speak to Analyst


Customize this report to your needs — add regions, segments, or data points, with 20% free customization.
Or view our licence options:


ISO 9001:2015 & 27001:2022 Certified
We are GDPR and CCPA compliant! Your transaction & personal information is safe and secure. For more details, please read our privacy policy.


