- Home
- »
- Communication Services
- »
-
Mobile Application Market Size And Share Report, 2026-2033GVR Report cover
![Mobile Application Market (2026 - 2033)Report]()
Mobile Application Market (2026 - 2033)
Size, Share & Trends Analysis Report By Store (Google Store, Apple Store, Others), By Application (Gaming, Music & Entertainment, Health & Fitness, Social Networking), By Region, And Segment Forecasts
Market Size, 2025
$285.7BMarket Estimate, 2026
$322.6BMarket Forecast, 2033
$885.3BCAGR, 2026–2033
15.5%Mobile Application Market Summary
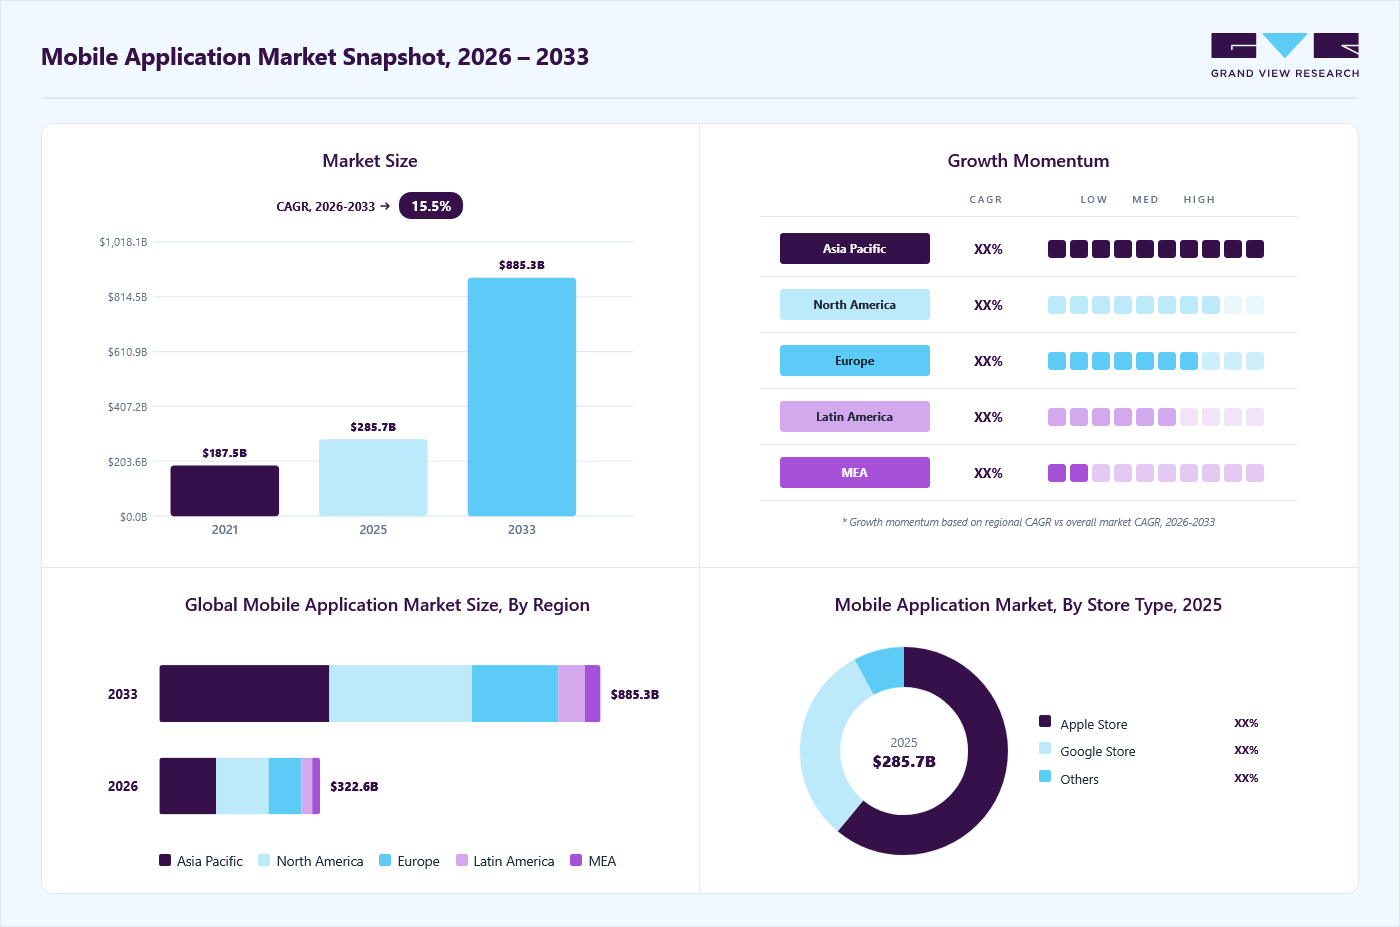
The global mobile application market size was valued at USD 285.7 billion in 2025 and is projected to grow from USD 322.6 billion in 2026 to USD 885.3 billion by 2033, at a CAGR of 15.5% from 2026 to 2033. Asia Pacific dominated the market with the largest revenue share of 34.9% in 2025. The global industry is witnessing steady growth driven by increasing smartphone penetration and rising internet usage across regions.
Key Market Trends & Insights
- By store: Apple store segment held a significant 61.0% revenue share in 2025.
- By application: Gaming segment held the largest revenue share of 46.7% in 2025.
Regional Highlights
- Largest regional market: Asia Pacific (34.9% revenue share, 2025)
- By country: The U.S. held the largest market share in 2025.
Market Size & Forecast
- Market size in 2025: USD 285.7 Billion
- Estimated market size in 2026: USD 322.6 Billion
- Projected market size by 2033: USD 885.3 Billion
- CAGR (2026-2033): 15.5%
Businesses are focusing on mobile-first strategies to enhance customer engagement and service delivery. The expansion of app-based services in sectors such as retail, banking, and entertainment is further supporting market growth. Factors such as the widespread adoption of smartphones, increasing internet usage, and the integration of technologies like artificial intelligence and machine learning in mobile apps indicate a promising future for the demand of mobile applications (apps). Furthermore, these applications are commonly downloaded from platforms such as the Google Play Store and the App Store for iOS.
")
The primary driver for market expansion is the notable surge in internet usage, particularly in emerging economies like Brazil, China, and India. Over the past decade, the internet has emerged as the predominant mode of communication across various devices, including tablets, smartphones, and laptops. The rise in the number of app consumers in recent years can be attributed to the growth of the e-commerce sector, the availability of various discounts and offers, and a diverse range of products exclusively accessible on online platforms. Additionally, the availability of affordable data plans and packages offered by telecom operators, which reduce internet costs and attract more users online, is another factor driving the increased downloads of applications across all platforms.
The combination of increased internet penetration and advancements in gaming technology has led to greater accessibility to games. Games like Pokémon Go utilize sensors such as motion sensors, gyroscopes, and accelerometers in tablets and smartphones to enable Augmented Reality (AR) and Virtual Reality (VR) capabilities through various apps on smartphone devices. Additionally, there are primarily three revenue models that game and app developers adopt, including in-game purchases, paid game applications, and in-app advertisements.
Amidst the recent coronavirus (COVID-19) pandemic, applications focused on social media, gaming, and entertainment experienced the highest number of downloads compared to other categories. Moreover, there has been a notable increase in demand for e-commerce, healthcare, and educational applications. The shift to remote learning in educational apps has created lucrative growth opportunities for online platforms and tech companies such as Google Classroom, Zoom, and Microsoft Teams.
Market Dynamics
The Mobile Application market is witnessing steady growth supported by rising smartphone penetration and increasing internet accessibility across regions. Businesses are shifting toward mobile-first engagement models to strengthen customer interaction and improve service delivery. The expansion of digital ecosystems across sectors such as retail, banking, healthcare, and entertainment is creating a wider application base. At the same time, continuous improvements in mobile platforms and development frameworks are enhancing application capabilities and user experience.
Increasing integration of artificial intelligence and machine learning is enhancing the functionality and efficiency of mobile applications across various use cases. These technologies enable advanced features such as predictive analytics, voice recognition, image processing, and personalized content recommendations, improving overall user engagement. AI-driven automation is also reducing manual effort in app operations, leading to faster and more accurate responses.
At the same time, machine learning models are continuously learning from user behavior, allowing applications to adapt and deliver more relevant experiences over time. This is improving decision-making capabilities within apps, particularly in sectors such as e-commerce, finance, healthcare, and entertainment. In addition, AI-enabled security features such as fraud detection and anomaly identification are strengthening data protection within mobile ecosystems. As a result, mobile applications are becoming more intelligent, responsive, secure, and user centric.
Growing concerns over data privacy and security are limiting the expansion of the Mobile Application market. The increasing use of mobile applications for financial transactions, communication, and storage of sensitive information exposes users to risks such as data breaches and cyberattacks. This creates hesitation among users and enterprises regarding the safety and reliability of mobile platforms. As a result, adoption remains restricted in certain high-risk or regulated use cases. In addition, stricter data protection regulations increase compliance requirements for developers and companies.
High market competition and saturation are also restricting growth in the Mobile Application market. The presence of many applications offering similar services makes it difficult for new and smaller developers to gain visibility and attract users. This leads to intense competition for downloads, user retention, and monetization opportunities. At the same time, frequent changes in operating systems and app store guidelines increase development complexity and maintenance costs. These factors collectively create operational challenges and can slow down innovation and overall market expansion.
Growing demand for digital transformation across industries is creating significant opportunities in the Mobile Application market. Businesses are increasingly adopting mobile platforms to enhance customer engagement, streamline operations, and deliver services in real time. This is driving the development of industry-specific applications across sectors such as retail, healthcare, banking, and education. As organizations continue to shift toward mobile-first strategies, demand for advanced and scalable applications is expected to increase.
The rising adoption of emerging technologies such as artificial intelligence, 5G connectivity, and cloud computing is also opening new growth opportunities. These technologies are enabling the development of more intelligent, high-performance, and feature-rich mobile applications. In addition, the growing popularity of subscription-based and in-app monetization models is creating new revenue streams for developers. Expansion of digital ecosystems in developing regions further supports long-term market growth potential.
Market Concentration & Characteristics
The Mobile Application market is characterized by a fragmented competitive structure with a large and diverse set of participants. It includes independent developers, startups, and established software companies that operate across multiple application categories such as social media, gaming, productivity, entertainment, and enterprise solutions. Low entry barriers, easy access to development tools, and rapid deployment cycles encourage continuous entry of new developers into the market. In addition, evolving consumer preferences and high demand for niche functionalities lead to the creation of highly specialized applications rather than a few standardized offerings. This results in a highly competitive environment where innovation and differentiation are key factors for sustaining user engagement.

In terms of market concentration, the ecosystem demonstrates a mixed structure with partial concentration at the platform and distribution level. While application development remains widely dispersed, a small number of operating systems and app store ecosystems exert strong influence over distribution, visibility, and monetization. These platform providers control key access points for users, which creates a certain level of dependency for developers. However, beyond these platforms, the application landscape itself remains highly competitive and fragmented, with no single application provider dominating across categories. This dual structure creates a balance between platform concentration and application-level fragmentation, shaping the overall market dynamics.
Analyst Perspective
The Mobile Application market is evolving rapidly with strong influence from digital adoption trends and changing consumer behavior. Demand for mobile-based services is increasing as users prefer convenient, real-time access to information and services. Organizations across industries are integrating mobile platforms into their core digital strategies to improve engagement and operational efficiency. The ecosystem is also supported by continuous technological enhancements in development tools, connectivity, and application performance. The market shows sustained expansion with growing emphasis on user-centric and scalable mobile solutions.
Store Insights
Based on Store, the apple store segment led the market with the significant revenue share of 61.0% in 2025. The segment's notable market dominance stems from iOS apps' relatively higher monetization rate, driven by in-app purchases and premium offerings. Additionally, the increasing global user base of iPhone and iPad users contributes to the segment's growth.
The widespread availability of the App Store across multiple countries enables developers to reach a global audience, expanding their potential reach. Continuous innovation within the App Store introduces new functionalities and updates, empowering developers to craft innovative apps and enhance the user experience. Ultimately, the Apple App Store continues to lead in mobile app distribution, fostering engagement and creating opportunities for developers on a global scale.
The Google Play Store's dominance in the market stems from various factors. Its extensive global reach enables access to a diverse audience across numerous countries and regions. Additionally, the widespread adoption of Android devices, which come pre-installed with the Play Store, reinforces its position.
Developer-friendly policies and integration with other Google services enhance its appeal to both developers and users. Moreover, regular updates and improvements ensure the Play Store remains competitive and relevant amidst evolving app trends. In summary, these elements collectively establish the Google Play Store as the foremost player in the market.
Application Insights
Based on application, the gaming segment led the market with the largest revenue share of 46.7% in 2025. Moreover, it is projected that the segment will maintain its leading position in the upcoming forecast period, driven by an anticipated surge in the gaming population and subsequently, the proliferation of gaming applications, particularly in economies like China and India. Additionally, the primary operating systems (OS) utilized for developing games are iOS, Android, and Windows. In 2023, Android OS accounted for a substantial portion of game downloads, while iOS generated greater revenue attributed to the prevalence of paid games on the platform.

The music and entertainment application segment is projected to exhibit a significant CAGR of around 16.3% over the forecast period. the rising preference for streaming services over traditional formats, driven by the convenience and accessibility offered by platforms like Spotify and Netflix. Additionally, the widespread ownership of smartphones, coupled with advancements in mobile technology, has significantly expanded the user base for these apps.
Technological innovations, such as personalized recommendations and high-definition streaming, further enhance the appeal of music and entertainment apps. Furthermore, the globalization of content and diverse monetization opportunities contribute to the segment's growth potential. Overall, these factors collectively position the music and entertainment application segment as a promising sector within the market, poised for substantial expansion in the coming years.
Regional Insights
North America mobile application market is characterized by its significant size and growth fueled by a tech-savvy population and robust economy. Dominated by major players like Apple and Google, the region encompasses diverse app categories ranging from gaming to e-commerce. Innovation and technological advancements thrive in North America, driven by startups and venture capital firms. Regulatory oversight, consumer behavior, and preferences shape the market, emphasizing the importance of compliance and user-centric design. Overall, North America offers a dynamic and competitive landscape ripe with opportunities for those keen on leveraging its diverse mobile app ecosystem.
U.S. Mobile Application Market Trends
The mobile application market of the U.S. is projected to grow at a CAGR of 15.3% from 2026 to 2033. The growth of the market in the country can be attributed to the presence of numerous mobile app development companies and the growing reliance of businesses in the U.S. to engage with customers and increase their reach through mobile apps. Key segments include gaming, social media, e-commerce, fintech, and entertainment, driven by high internet usage and technological advancements like 5G and AI. Popular apps include Facebook, Instagram, Amazon, PayPal, and Netflix. Opportunities arise from innovations in AR/VR and mobile payments, while challenges include regulatory compliance, intense competition, and security and privacy concerns. Success requires continuous innovation, user-focused features, and effective navigation of the regulatory landscape.

Asia Pacific Mobile Application Market Trends
Asia Pacific dominated the Mobile Application Market with the largest revenue share of 34.9% in 2025. Mobile apps have seen widespread adoption across the Asia Pacific region. Factors such as increasing smartphone penetration and internet access, along with a growing middle class, have led to a surge in app usage in the region. In particular, countries like China, India, and Southeast Asian nations have seen significant growth in mobile app usage, with a focus on areas such as e-commerce, gaming, and social media. Additionally, the COVID-19 pandemic has further accelerated the adoption of apps as people have turned to digital platforms for work, education, and entertainment.
The Mobile Application Market in the China held the largest share in the North America region in 2025. It is driven by the growing popularity of short-form videos that are offered by mobile applications such as TikTok (Douyin in China). Moreover, the growing popularity of e-commerce in the country is driving the growth of the market in the country. Key segments include gaming, e-commerce, social media, fintech, and entertainment, driven by high smartphone penetration and innovations such as 5G and AI. Dominant apps like WeChat, Alipay, and Taobao illustrate the market's diversity and integration of services. Opportunities abound with the advent of 5G and AI, but challenges include regulatory compliance, intense competition, and the necessity for localization. Success requires innovation, adaptation to local preferences, and navigating the complex regulatory landscape.
Japan mobile application market is witnessing significant growth owing to the growing adoption of mobile applications across categories, including gaming, social media, and FinTech. Moreover, initiatives by the Japanese government to promote competition and prevent app store monopolization are expected to drive the market’s growth in the country.
Europe Mobile Application Market Trends
The mobile application market in Europe was valued at USD 58.49 billion in 2025. The growing digitalization, accelerated by the COVID-19 pandemic, is driving the market’s growth in the region. Businesses in the region are integrating mobile apps into their operations to offer enhanced services to their customers. For instance, European railway and airline companies offer mobile applications to facilitate booking and travel processes.
The UK mobile application market accounted for over 25.5% share of the European market in 2023. The growing utilization of mobile apps to access various services, such as healthcare, drives the market’s growth in the country. For instance, UK National Health Service (NHS)’s user base crossed over 22 million in December 2021 within three years of its launch in 2018. The app gives users easier access to various digital healthcare services, such as booking appointments.
The mobile application market in Germany is expected to grow at a CAGR of 14.4% from 2026 to 2033. The growing use of mobile applications for shopping and, travel & tourism primarily drives the German market. Key segments include gaming, e-commerce, social media, fintech, and entertainment, driven by increasing mobile internet usage and technological innovations like 5G, AI, and AR/VR. Popular apps include WhatsApp, Amazon, PayPal, and Netflix. The market offers significant opportunities but faces challenges such as stringent regulatory compliance, intense competition, and the need for robust security and privacy measures. Success requires continuous innovation, user-centric features, and effective navigation of the regulatory landscape.
France mobile application market is witnessing significant growth owing to the growing time spent by French users on mobile apps in recent years. Utility, social, and gaming apps are some of the mobile app categories witnessing significant growth in usage in the country. The market is driven by widespread smartphone adoption, high internet penetration, and a vibrant startup ecosystem, particularly in cities like Paris. Popular app categories include social media, gaming, e-commerce, and health & fitness, reflecting diverse consumer usage.
Technological innovation and government support foster a dynamic environment for app development, while regulations like GDPR ensure data protection and user privacy. Despite challenges such as intense competition and regulatory compliance, the market offers significant opportunities for developers and businesses to capitalize on the increasing reliance on mobile applications across various aspects of daily life.
Middle East & Africa Mobile Application Market Trends
The mobile application market of the Middle East and Africa (MEA) is anticipated to reach USD 31.82 billion by 2033. The rapid growth of the Middle East and Africa (MEA) market can be attributed to the rapidly developing technological infrastructure in the region, which is likely to give the MEA population better access to the internet and smartphones, driving the usage of mobile applications. Key markets include the UAE, Saudi Arabia, South Africa, and Nigeria, with popular app categories ranging from social media to fintech. Technological advancements like 4G and 5G networks are enhancing app development and usage, while burgeoning tech hubs in Dubai, Nairobi, and Lagos foster innovation.
Saudi Arabia mobile application market is witnessing significant growth owing to government initiatives to accelerate digital transformation in the country. According to the National Transformation Program’s 2022 report, over 97% of the country’s total government services are digitized. Moreover, the growth of the FinTech sector in the country is likely to drive the use of mobile apps for banking applications.
Key Mobile Application Company Insights
Some of the key vendors operating in the market include Google, Apple Inc., and Microsoft.
-
Apple Inc. is a U.S.-based company that develops and manufactures personal computers, smartphones, tablets, wearables, and accessories. The company’s App Store enables customers to download digital content and applications. The company offers mobile applications, such as Apple Music and Apple Books. It has a global presence with retail stores worldwide.
-
Google, a subsidiary of Alphabet, is a U.S.-based technology company. The company operates in two reportable segments, namely Google Services and Google Cloud. The company operates the Google Play platform and provides various apps, such as YouTube, Google Maps, Gmail, and Chrome, among others. It has a global presence with over 70 offices across 50 countries.
Practo and cult.fit are some of the emerging mobile application companies.
-
Practo is an India-based company that offers an online doctor consultation platform that helps in scheduling doctor appointments. The company’s platform enables online consulting and automated scheduling with doctors across more than 20 specialties. The company’s appointment mobile application is available on Google Play and App Store.
-
cult.fit is an India-based company that offers a fitness-based platform. The company’s mobile application offers services for fitness, healthy food, and mental wellness, enabling customers to manage their health & fitness on a single platform. The users can access gym sessions, group workouts, and sports with the mobile application.
Key Mobile Application Companies:
The following key companies have been profiled for this study on the mobile application market.
-
Apple Inc.
-
Google
-
Microsoft
-
Amazon.com, Inc.
-
Gameloft
-
Netflix, Inc.
-
Practo
-
cult.fit
-
Ubisoft Entertainment
-
Xiaomi
Competitive Benchmarking
Operating Strategies
Competitive Edge
Weaknesses
Mature Players: Apple Inc., Google, Microsoft, Amazon.com, Inc., Netflix, Inc
- Matured players follow an ecosystem-based strategy with diversified revenue streams such as subscriptions, advertising, and cloud services. They focus on innovation, scale, and strong user retention.
- Matured players have strong ecosystems, large user bases, and diversified revenues. Their advantage comes from scale, technology, and brand trust.
- Matured players often face high operational complexity and slower adaptability due to their large-scale structures. Dependence on regulatory environments and market saturation in core regions can also limit incremental growth.
Emerging Players: Gameloft, Practo, cult.fit
- Emerging players use a niche-focused strategy centered on rapid growth, subscriptions, and targeted offerings. They rely on agility, partnerships, and market expansion.
- Emerging players compete through niche focus, agility, and faster innovation. Their strength lies in targeted offerings and quick market response.
- Emerging players face limited resources, weaker brand recognition, and lower scalability. Heavy reliance on funding and narrow market focus can restrict long-term stability and expansion.
Recent Developments
-
In September 2023, Google announced new features on YouTube. The new features would enable creators to edit, develop, and share content in new ways. One of the features, called ‘Dream Screen,’ enables creators to add AI-generated video or image backgrounds in YouTube shorts. With these new features, the company aimed to help creators reach more viewers and reduce time-consuming tasks.
-
In December 2022, Apple Inc. announced the launch of Freeform, a new application available for iPad, Mac, and iPhone. Freeform helps users organize content on a flexible canvas and gives them the ability to share and collaborate on one platform. The application offers numerous color options and brush styles to draw diagrams and add comments.
-
In October 2022, cult.fit and boat (Imagine Marketing Limited), an India-based company, partnered to launch the at-home workout program called ‘Fitness Xtended.’ The program comprises strength, yoga, and conditioning exercises, among others, designed by popular fitness coaches. The content was also made available on the cult.fit app.
Mobile Application Market Report Scope
Report Attribute
Details
Market size value in 2025
USD 285.7 billion
Market size value in 2026
USD 322.6 billion
Revenue forecast in 2033
USD 885.3 billion
Growth rate
CAGR of 15.5% from 2026 to 2033
Base year for estimation
2025
Historical data
2021 - 2024
Forecast period
2026 - 2033
Quantitative units
Revenue in USD million/billion, and CAGR from 2026 to 2033
Report coverage
Revenue forecast, company ranking, competitive landscape, growth factors, and trends
Segments covered
Store, application, region
Regional scope
North America; Europe; Asia Pacific; Latin America; MEA
Country scope
U.S.; Canada; Mexico; Germany; UK; France; Russia; China; Japan; India; Australia; South Korea; Brazil; KSA; UAE; South Africa
Key companies profiled
Apple Inc.; Google; Microsoft; Amazon.com, Inc.; Gameloft; Netflix, Inc.; Practo; cult.fit; Ubisoft Entertainment; Xiaomi
Customization scope
Free report customization (equivalent up to 8 analysts' working days) with purchase. Addition or alteration to country, regional & segment scope.
Pricing and purchase options
Avail customized purchase options to meet your exact research needs. Explore purchase options
Global Mobile Application Market Report Segmentation
This report forecasts revenue growth at global, regional, and country levels and provides an analysis of the latest industry trends in each of the sub-segments from 2021 to 2033. For this study, Grand View Research has segmented the global mobile application market report based on store, application, and region.

-
Store Outlook (Revenue, USD Billion; 2021 - 2033)
-
Google Store
-
Apple Store
-
Others
-
-
Application Outlook (Revenue, USD Billion; 2021 - 2033)
-
Gaming
-
Music & Entertainment
-
Health & Fitness
-
Social Networking
-
Retail & E-commerce
-
Travel & Hospitality
-
Learning & Education
-
Others
-
-
Regional Outlook (Revenue, USD Billion; 2021 - 2033)
-
North America
-
U.S.
-
Canada
-
Mexico
-
-
Europe
-
UK
-
Germany
-
France
-
Russia
-
-
Asia Pacific
-
India
-
China
-
Japan
-
Australia
-
South Korea
-
-
Latin America
-
Brazil
-
-
Middle East & Africa
-
Kingdom of Saudi Arabia (KSA)
-
U.A.E.
-
South Africa
-
-
Research Methodology
The mobile application market figures in this report are based on a proven research process that combines executive interviews with secondary research from proprietary databases, company filings, and recognized regulatory and institutional sources. Market size is built through value-chain sizing - reconciling supply-side and demand-side estimates - and triangulated with bottom-up and top-down approaches. Every estimate passes multiple levels of expert validation before publication, with each mobile application segment quantified using the revenue-capture definitions in the table below.
Segment Definition
Segment - Technology
Revenue capture definition
Google Store
The Google Play Store generates revenue through commission fees applied to app purchases, in-app transactions, and subscription services, along with monetization from advertising across the broader Google network.
Apple Store
Within the Apple App Store ecosystem, revenue is captured through transaction commissions on paid applications, subscriptions, and in-app purchases, supported by a premium distribution model with strict platform guidelines.
Others
For other distribution channels, revenue is earned through alternative app marketplaces and direct developer platforms, where monetization depends on lower or flexible commission structures, direct consumer sales, and advertising-based models.
Segment - Application
Revenue capture definition
Gaming
Revenue in the gaming category is primarily generated through in-app purchases, in-game advertising, and subscription-based access to premium content and features.
Music & Entertainment
The music and entertainment category earns revenue through subscription plans, streaming fees, advertising models, and premium content purchases.
Health & Fitness
Revenue capture in health and fitness applications is driven by subscription-based wellness programs, personalized coaching services, and premium feature access.
Social Networking
Social networking platforms generate revenue mainly through targeted advertising, sponsored content, and premium user subscription features.
Retail & e-Commerce
In retail and e-commerce applications, revenue is captured through transaction commissions, product sales facilitation, and in-app promotional advertising.
Travel & Hospitality
Revenue in travel and hospitality applications is generated via booking commissions, service fees on reservations, and promotional partnerships with service providers.
Learning & Education
The learning and education category earns revenue through course subscriptions, certification fees, and paid access to advanced learning materials and platforms.
Others
Other application categories generate revenue through mixed monetization models, including advertising, subscriptions, and one-time payments depending on the application type.
Estimation Model
Layer Name
Key Question
Description
User Base Layer
Who creates demand for Mobile Application services?
Identifies the total population of smartphone users and connected device users across regions, forming the overall potential demand base for mobile applications.
Active User Layer
Which users actively use mobile applications?
Filters the total user base based on smartphone penetration, internet access, usage frequency, and digital engagement behavior, representing active app users.
Application Consumption Layer
What types of mobile applications and services are used?
Estimates usage across application categories such as gaming, social networking, e-commerce, entertainment, and productivity, reflecting consumption intensity and mix.
Revenue Capture Layer
How is revenue generated in the mobile application ecosystem?
Calculates revenue through in-app purchases, subscriptions, advertising models, and premium app downloads across different application categories and platforms.
Delivered Customizations
This report has been delivered with the following In-depth customizations
Client Objective
Customization Delivered
Value Adds
Market Entry & Expansion Assessment
- Regional demand sizing and forecasting
- Customer segmentation and buying behavior analysis
- Competitive landscape benchmarking
- Identified high-growth market opportunities
- Supported go-to-market strategy development
- Highlighted investment priorities and risks
- Enabled data-driven expansion planning
Product Positioning & Competitive Intelligence
- Product benchmarking and feature comparison
- Pricing and value proposition analysis
- Brand perception and competitor strategy evaluation
- Improved product differentiation strategy
- Supported pricing optimization
- Identified unmet customer needs
- Enhanced competitive positioning
Customer & End-User Insights Study
- Consumer awareness and adoption analysis
- Purchase decision journey mapping
- Usage pattern and pain-point evaluation
- Revealed key adoption drivers and barriers
- Supported customer-centric product development
- Improved targeting and engagement strategy
- Identified retention and upselling opportunities
Frequently Asked Questions About This Report
Asia Pacific is the fastest-growing region over the forecast period.
The Apple store segment led with a 61.0% revenue share in 2025.
The Gaming segment led with a 46.7% revenue share in 2025.
The U.S. accounted for the largest share of the mobile application market.
The global mobile application market is expected to grow at a compound annual growth rate of 15.5% from 2026 to 2033 to reach USD 885.3 billion by 2033.
Asia Pacific was one of the dominating regions in the mobile application market, with a share of around 34.9% in 2025.
Some key players operating in the mobile application market include Apple Inc., Google, Microsoft, Amazon.com, Inc., Gameloft, Netflix, Inc., Practo, cult.fit, Ubisoft Entertainment, Xiaomi
The global mobile application market size was estimated at USD 285.7 billion in 2025 and is expected to reach USD 322.6 billion in 2026.
Key factors that are driving the mobile application market growth include smartphone proliferation, increased internet penetration, and growing use of technologies such as machine learning and artificial intelligence in mobile apps.
About the Author(s)
Communication Services Research Team
Technology · Communication ServicesThis report was authored by the communication services research team at Grand View Research - comprising two research analysts, one senior research analyst, and one industry expert - with specialized expertise in the communication services segment of the technology industry. All findings are based on proprietary technology databases, executive interviews, and regulatory analysis, subject to internal peer review prior to publication.
Last Updated:
Speak to Analyst


Need a Tailored Report?
Customize this report to your needs — add regions, segments, or data points, with 20% free customization.
Or view our licence options:

ISO 9001:2015 & 27001:2022 Certified
We are GDPR and CCPA compliant! Your transaction & personal information is safe and secure. For more details, please read our privacy policy.


