- Home
- »
- Advanced Interior Materials
- »
-
Disposable Gloves Market Size & Share Report, 2026-2033GVR Report cover
![Disposable Gloves Market (2026 - 2033)Report]()
Disposable Gloves Market (2026 - 2033)
Size, Share & Trends Analysis Report By Material (Natural Rubber, Nitrile, Vinyl, Neoprene, Polyethylene), By Product (Powdered, Powder-free), By End Use, By Region, And Segment Forecasts
Market Size, 2025
$13.8BMarket Estimate, 2026
$14.9BMarket Forecast, 2033
$26.8BCAGR, 2026–2033
8.7%Disposable Gloves Market Summary
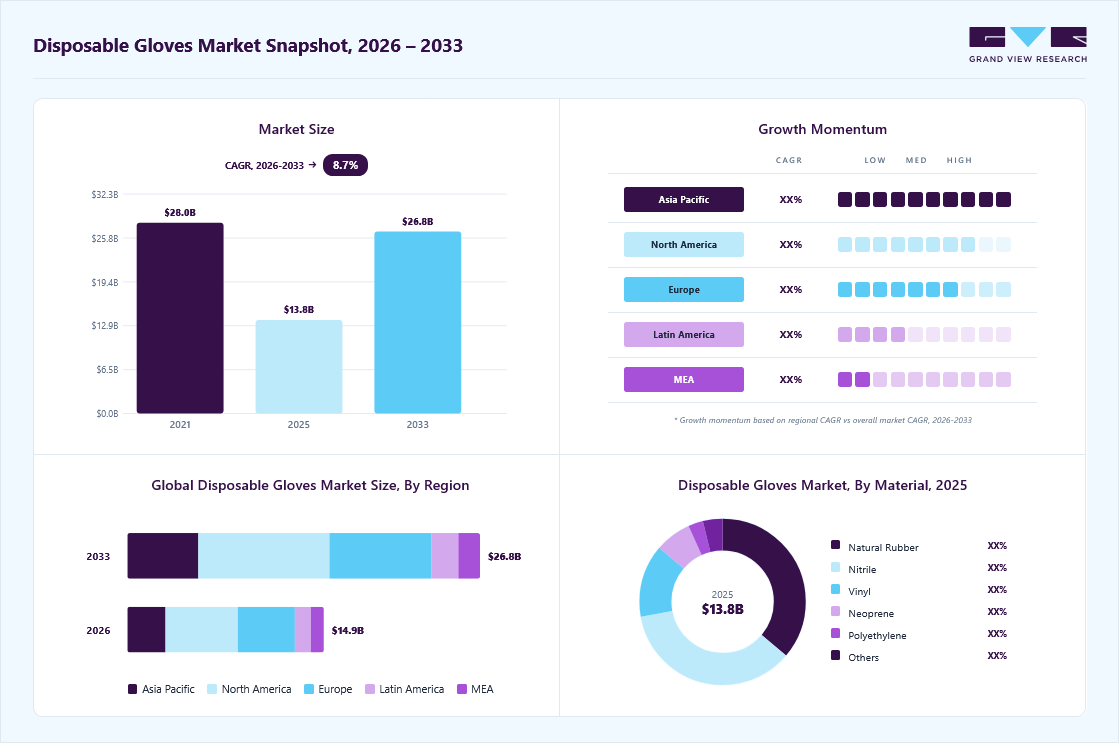
The global disposable gloves market size was valued at USD 13.8 billion in 2025 and is projected to grow from USD 14.9 billion in 2026 to USD 26.8 billion by 2033, at a CAGR of 8.7% from 2026 to 2033. The market in North America dominated with a revenue share of 36.7% in 2025. Rising emphasis on workplace safety and hygiene is a major driving factor for the market.
Key Market Trends & Insights
- By material: Natural rubber segment held the largest market share of 36.1% in 2025.
- By product: Powder-free gloves segment held the largest market share of 75.2% in 2025.
- By end use: Healthcare segment held the largest market share of 78.1% in 2025.
Regional Highlights
- Largest regional market: North America (36.7% revenue share, 2025)
- Fastest-growing regional market: Asia Pacific (highest CAGR, 2026-2033)
- By country: U.S. held the largest market share in 2025
Market Size & Forecast
- Market size in 2025: USD 13.8 Billion
- Estimated market size in 2026: USD 14.9 Billion
- Projected market size by 2033: USD 26.8 Billion
- CAGR (2026-2033): 8.7%
Industries such as healthcare, pharmaceuticals, food processing, and chemicals are enforcing stricter safety protocols to reduce contamination and occupational hazards. Regulatory bodies across regions mandate the use of protective gloves, especially in high-risk environments.")
Another key driver is the growing expansion of healthcare infrastructure and industrial activities worldwide. Increasing hospital admissions, diagnostic procedures, and pharmaceutical production have significantly raised glove usage. At the same time, growth in manufacturing, construction, and chemical processing is boosting demand for durable, chemical-resistant gloves. Continuous product innovation, particularly in nitrile gloves, is further accelerating market adoption.
Industry Concentration & Characteristics
The disposable gloves industry is moderately fragmented, with the presence of several global manufacturers alongside a large number of regional and local players. Leading companies benefit from strong production capacity, established distribution networks, and long-term supply contracts with healthcare and industrial users. However, low entry barriers in certain glove types allow smaller manufacturers to compete on price, especially in emerging markets.
The disposable gloves industry shows a steady level of innovation focused on material performance, comfort, and sustainability. Manufacturers are investing in advanced nitrile formulations to improve strength, tactile sensitivity, and chemical resistance. Growing interest in biodegradable and eco-friendly gloves is also shaping product development. Automation in manufacturing processes is helping companies improve quality, consistency, and reduce production costs.

Regulations play a critical role in shaping the disposable gloves industry, particularly in healthcare, food, and chemical sectors. Strict compliance requirements related to hygiene, worker safety, and contamination control drive mandatory glove usage. Regulatory bans on powdered gloves in several regions have shifted demand toward powder-free alternatives. Frequent audits and certification standards continue to influence product specifications and market entry.
End-user concentration is relatively high, with healthcare and pharmaceuticals accounting for a significant share of total glove consumption. Large hospitals, diagnostic chains, and pharmaceutical manufacturers purchase gloves in bulk, creating stable demand patterns. Industrial sectors such as food processing and chemicals also contribute consistent volumes. This concentration encourages suppliers to focus on long-term contracts and customized offerings for major buyers.
Drivers, Opportunities & Restraints
Rising awareness of personal safety, infection control, and workplace hygiene is a key factor driving the disposable medical gloves market globally. Stringent occupational safety and healthcare regulations across hospitals, diagnostic centers, and pharmaceutical manufacturing mandate the routine use of disposable medical gloves to minimize contamination risks and ensure worker and patient safety. Increasing patient admissions, higher testing volumes, and the growing number of surgical and non-surgical medical procedures are further accelerating demand in the disposable medical gloves market.
The market offers strong opportunities through the development of eco-friendly and biodegradable disposable gloves. Increasing preference for nitrile and latex-free gloves creates scope for product innovation and premium pricing. The rapid growth of healthcare infrastructure in developing regions opens new revenue streams for manufacturers. E-commerce and direct institutional procurement channels also provide opportunities to expand market reach.
Fluctuating raw material prices, particularly for natural rubber and synthetic polymers, remain a key restraint for market growth. High dependence on imports in some regions exposes manufacturers to supply chain disruptions. Environmental concerns related to single-use plastic waste are increasing regulatory scrutiny. These factors can limit adoption and impact long-term profitability.
Material Insights
Natural rubber led the market and accounted for 36.1% of the global revenue demand in 2025, due to its superior elasticity, comfort, and excellent tactile sensitivity. They are widely used in healthcare and food handling applications where precision and fit are essential. Strong barrier protection and cost-effectiveness support their large-scale adoption. Although latex allergy concerns have led to gradual substitution in select end uses, sustained purchasing by hospitals, clinics, and diagnostic centers continues to underpin demand within the latex medical disposables market, maintaining the relevance of the latex gloves market in the broader disposable gloves landscape.
The nitrile gloves market represents the fastest-growing material segment within the disposable gloves industry, supported by superior puncture resistance, high tensile strength, and strong chemical protection compared to latex and vinyl alternatives. As nitrile gloves are latex-free, they are increasingly preferred across healthcare, pharmaceutical manufacturing, and industrial workplaces to mitigate allergy risks and ensure consistent barrier performance. Rising regulatory scrutiny around worker safety, infection control, and chemical exposure is accelerating the shift toward nitrile-based protective solutions.
Product Insights
The powdered product segment is expected to grow at a moderate CAGR of 6.7% from 2025 to 2033 in terms of revenue. Powder-free gloves led the market and accounted for 75.2% share, due to strict hygiene standards across healthcare, pharmaceuticals, and food processing industries. They reduce the risk of contamination, allergic reactions, and post-use residue, making them suitable for critical applications. Regulatory restrictions on powdered gloves have further strengthened demand. Their wide acceptance across both medical and industrial sectors supports continued market leadership.
Powdered gloves are witnessing significant growth in select non-medical and industrial applications due to their ease of donning and cost advantages. They are preferred in environments where frequent glove changes are required and contamination risks are minimal. Growing demand from manufacturing and construction supports usage. Improved powder quality and controlled applications are helping sustain this.
End-Use Insights
The pharmaceuticals segment is expected to grow at a considerable CAGR of 8.9% from 2025 to 2033 in terms of revenue. Healthcare dominated the market and accounted for a 78.1% share in 2025, due to the high frequency of glove usage in hospitals, clinics, and diagnostic centers. Strict infection control protocols and patient safety standards require routine glove replacement. Rising surgical procedures and outpatient visits continue to increase consumption. Continuous focus on preventing cross-contamination sustains strong demand from this sector.

The pharmaceutical segment is growing significantly, driven by expanding drug manufacturing and research activities. Stringent contamination control and cleanroom requirements mandate the use of high-quality disposable gloves. Increased production of biologics and injectable drugs further boosts demand. Compliance with global quality standards continues to accelerate glove adoption across pharmaceutical facilities.
Regional Insights
North America dominated the disposable gloves market and accounted for a 36.7% share in 2025, due to strict workplace safety regulations and high healthcare spending. Widespread adoption across hospitals, laboratories, and food processing facilities supports large-scale consumption. Strong presence of established manufacturers ensures steady supply and innovation. Ongoing focus on infection control continues to sustain regional leadership.

U.S. Disposable Gloves Market Trends
The disposable gloves market in the U.S. dominates North America due to its large healthcare system and strict infection control standards. High volume of surgical procedures and diagnostic testing drives consistent glove consumption. Strong regulatory enforcement across healthcare, food, and industrial sectors supports sustained demand.
Canada disposable gloves market is witnessing steady growth, supported by expanding healthcare services and rising workplace safety awareness. Increasing adoption in food processing, pharmaceuticals, and laboratories is boosting demand. Government regulations promoting worker protection encourage consistent glove usage.
Europe Disposable Gloves Market Trends
The disposable gloves market in Europe shows steady growth due to stringent occupational safety and environmental regulations. High usage in healthcare, pharmaceuticals, and food industries supports consistent demand. Growing emphasis on powder-free and sustainable gloves influences product preferences.
Germany disposable gloves market dominates Europe due to its strong healthcare infrastructure and well-established industrial base. Strict occupational safety and hygiene regulations drive high glove consumption across medical, chemical, and manufacturing sectors. The presence of advanced pharmaceutical and laboratory facilities supports consistent demand.
The disposable gloves market in France is experiencing steady market growth, driven by expanding healthcare services and increasing infection control measures. Rising demand from pharmaceuticals, food processing, and laboratory applications supports market expansion. Government regulations emphasizing worker safety encourage regular glove usage.
Asia Pacific Disposable Gloves Market Trends
The disposable gloves market in the Asia Pacific is the fastest-growing region at a CAGR of 9.3% over the forecast period, driven by the rapid expansion of healthcare infrastructure and manufacturing activities. Rising awareness of worker safety and hygiene standards is boosting glove adoption. Increasing pharmaceutical production and medical tourism further support demand. Cost-effective manufacturing also attracts global sourcing to the region.
China disposable gloves market dominates the Asia Pacific market due to its large manufacturing base and expanding healthcare infrastructure. High domestic consumption, along with strong export activity, supports large-scale production volumes. Increasing enforcement of workplace safety standards across industries drives consistent glove usage.
The disposable gloves market in India is witnessing strong growth, driven by rising healthcare investments and expanding pharmaceutical manufacturing. Increasing awareness of hygiene and worker safety is boosting adoption across hospitals and industrial sectors. Growth in food processing and diagnostic laboratories further supports demand. Government initiatives to strengthen healthcare infrastructure continue to accelerate market expansion.
Middle East & Africa Disposable Gloves Market Trends
The disposable gloves market in the Middle East and Africa is witnessing growth due to a rising awareness of hygiene and safety standards, particularly in healthcare, food handling, and personal care industries. Increasing government regulations on infection control, particularly in hospitals and clinics, are driving the demand for gloves. Additionally, the region's growing population and the healthcare industry's expansion provide significant growth opportunities for glove manufacturers.
Saudi Arabia disposable gloves market is expanding due to increased healthcare investments, rising hygiene awareness, and the implementation of stringent infection control measures. The government's focus on improving healthcare services and infrastructure, along with growth in food safety regulations, is propelling market demand. Furthermore, Saudi Arabia’s efforts toward sustainability and the introduction of eco-friendly glove alternatives are emerging as key trends.
Latin America Disposable Gloves Market Trends
The disposable gloves market in Latin America is expanding, driven by increasing healthcare investments and the demand for personal protective equipment in the wake of the pandemic. Countries such as Argentina and Brazil are seeing heightened demand for gloves in hospitals, clinics, and food processing industries. Moreover, as environmental concerns rise in the region, there is an emerging trend towards sustainable glove alternatives, creating opportunities for manufacturers.
Brazil disposable gloves market is seeing growth due to increasing healthcare requirements, including the expansion of medical facilities and heightened hygiene awareness. The rise in the food processing and manufacturing industries is also contributing to glove demand. Additionally, Brazil’s growing focus on sustainable products and eco-friendly alternatives in healthcare and industry is expected to drive future market trends.
Key Disposable Gloves Company Insights
Some prominent players in the market include: Top Glove Corporation Bhd, Ansell Ltd, and Kossan Rubber Industries Bhd.
-
Ansell Ltd provides high-performance disposable gloves for chemical, industrial, and healthcare environments. The company differentiates itself through advanced barrier technologies and application-specific glove design rather than volume-driven production. Its TouchNTuff and Microflex ranges are positioned for regulated and high-risk use cases. Ansell emphasizes premium pricing supported by certification, compliance, and performance testing. Continuous R&D investment allows faster rollout of specialty and chemical-resistant disposable gloves.
-
Top Glove Corporation Bhd is a volume-driven market leader with large-scale disposable glove manufacturing capacity. The company benefits from vertically integrated operations that support cost efficiency and supply stability. Its portfolio spans latex, nitrile, and vinyl gloves across medical and industrial segments. Strong export orientation enables wide geographic market penetration. Capacity expansion and automation remain central to its competitive strategy.
Key Disposable Gloves Companies:
The following key companies have been profiled for this study on the disposable gloves market.
- Ansell Ltd.
- Top Glove Corporation Bhd
- Hartalega Holdings Berhad
- Unigloves (UK) Limited
- The Glove Company
- Superior Gloves
- MAPA Professional
- Adenna LLC
- MCR Safety
- Atlantic Safety Products, Inc.
- Globus (Shetland) Ltd.
- Supermax Corporation Berhad
- Kossan Rubber Industries Bhd
- Ammex Corporation
- Sempermed USA, Inc.
- Halyard Health, Inc.
- PIP
Recent Developments
-
In January 2026, Ansell introduced the TouchNTuff 93-800 disposable glove to address high-risk chemical handling applications. The glove is designed to provide improved resistance against harsh solvents while maintaining durability and comfort. Its advanced barrier construction supports safer use in industrial and laboratory environments. This launch strengthens Ansell’s position in high-performance chemical-resistant disposable gloves.
-
In May 2025, PIP strengthened its market position by acquiring Honeywell’s personal protective equipment business. The deal expanded PIP’s product portfolio beyond hand protection into multiple safety categories. It also improved the company’s global reach and distribution capabilities. This acquisition supports PIP’s strategy to serve a wider range of industrial and workplace safety needs.
Disposable Gloves Market Report Scope
Report Attribute
Details
Market size in 2025
USD 13.8 billion
Estimated Market size in 2026
USD 14.9 billion
Projected Market size by 2033
USD 26.8 billion
Growth rate
CAGR of 8.7% from 2026 to 2033
Base year for estimation
2025
Historical data
2021 - 2024
Forecast period
2026 - 2033
Quantitative units
Revenue in USD million/billion and CAGR from 2026 to 2033
Report coverage
Revenue forecast, company ranking, competitive landscape, growth factors, and trends
Segments covered
Material, product, end use, region
Regional scope
North America; Europe; Asia Pacific; Latin America; MEA
Country scope
U.S.; Canada; Mexico; Germany; France; Italy; Russia; Spain; UK; China; India; Japan; South Korea; Indonesia; Australia; Thailand; Malaysia; Brazil; Argentina; UAE; Saudi Arabia; South Africa
Key companies profiled
Ansell Ltd; Top Glove Corporation Bhd; Hartalega Holdings Berhad; Unigloves (UK) Limited; The Glove Company; Superior Gloves; MAPA Professional; Adenna LLC; MCR Safety; Atlantic Safety Products, Inc; Globus (Shetland) Ltd.; Supermax Corporation Berhad; Kossan Rubber Industries Bhd; Ammex Corporation; PIP (Protective Industrial Products); Sempermed USA, Inc; Halyard Health, Inc.
Customization scope
Free report customization (equivalent up to 8 analysts working days) with purchase. Addition or alteration to country, regional & segment scope.
Pricing and purchase options
Avail customized purchase options to meet your exact research needs. Explore purchase options
Global Disposable Gloves Market Report Segmentation
This report forecasts revenue growth at global, regional & country levels and provides an analysis of the industry trends in each of the sub-segments from 2021 to 2033. For this study, Grand View Research has segmented the global disposable gloves market based on material, product, end use, and region:

-
Material Outlook (Revenue, USD Billion, 2021 - 2033)
-
Natural Rubber
-
Nitrile
-
Vinyl
-
Neoprene
-
Polyethylene
-
Others
-
-
Product Outlook (Revenue, USD Billion, 2021 - 2033)
-
Powdered
-
Powder-free
-
-
End Use Outlook (Revenue, USD Billion, 2021 - 2033)
-
Construction
-
Manufacturing
-
Oil & Gas
-
Chemicals
-
Food
-
Pharmaceuticals
-
Healthcare
-
Transportation
-
Mining
-
Others
-
-
Regional Outlook (Revenue, USD Billion, 2021 - 2033)
-
North America
-
U.S.
-
Canada
-
Mexico
-
-
Europe
-
Germany
-
UK
-
France
-
Russia
-
Italy
-
Spain
-
-
Asia Pacific
-
China
-
India
-
Japan
-
Australia
-
South Korea
-
Indonesia
-
Thailand
-
Malaysia
-
-
Central & South America
-
Brazil
-
Argentina
-
-
Middle East & Africa
-
Saudi Arabia
-
UAE
-
South Africa
-
-
Frequently Asked Questions About This Report
The key factors that are driving the disposable gloves market include the increasing product demand from numerous end-use industries including medical & healthcare, pharmaceutical, automotive finishing, chemical, and oil & gas.
The global disposable gloves market size was estimated at USD 13.8 billion in 2025 and is expected to reach USD 14.9 billion in 2026.
Pharmaceuticals held the largest share (over 78.1%) in 2025.
North America dominated with a 36.7% revenue share in 2025.
Powder-free gloves held the largest revenue share 75.2% in 2025.
The global disposable gloves market is expected to grow at a compound annual growth rate of 8.7% from 2026 to 2033 to reach USD 26.8 billion by 2033.
Natural rubber led the market and accounted for 36.1% of the global revenue demand in 2025.
Some of the key players operating in the disposable gloves market include Ansell Ltd; Top Glove Corporation Bhd; Hartalega Holdings Berhad; Unigloves (UK) Limited; The Glove Company; Superior Gloves; MAPA Professional; Adenna LLC; MCR Safety; Atlantic Safety Products, Inc; Globus (Shetland) Ltd.; Supermax Corporation Berhad; Kossan Rubber Industries Bhd; Ammex Corporation; PIP (Protective Industrial Products); Sempermed USA, Inc; Halyard Health, Inc.
About the Author(s)
Advanced Interior Materials Research Team
Advanced Materials · Advanced Interior MaterialsThis report was authored by the advanced interior materials research team at Grand View Research - comprising two research analysts, one senior research analyst, and one industry expert - with specialized expertise in the advanced interior materials segment of the advanced materials industry. All findings are based on proprietary advanced materials databases, executive interviews, and regulatory analysis, subject to internal peer review prior to publication.
Last Updated:
Speak to Analyst


Need a Tailored Report?
Customize this report to your needs — add regions, segments, or data points, with 20% free customization.
Or view our licence options:

ISO 9001:2015 & 27001:2022 Certified
We are GDPR and CCPA compliant! Your transaction & personal information is safe and secure. For more details, please read our privacy policy.


