GVR Report cover Engineering Services Outsourcing Market Size, Share & Trends Report

Engineering Services Outsourcing Market Size, Share & Trends Analysis Report By Service (Designing, Prototyping, System Integration, Testing), By Location, By Application, By Region, And Segment Forecasts, 2024 - 2030

  • Report ID: 978-1-68038-236-5
  • Number of Pages: 300
  • Format: Electronic (PDF)
  • Historical Range: 2018 - 2023
  • Industry: Technology

Market Size & Trends

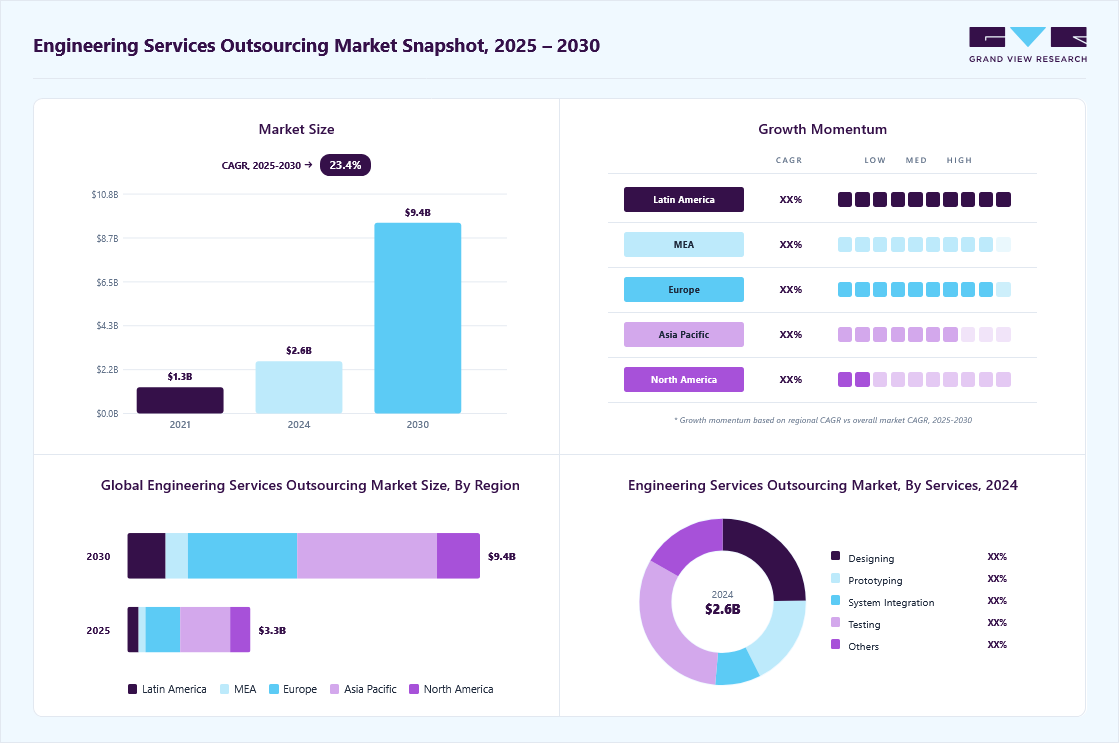
The global engineering services outsourcing market size was valued at USD 2,039.60 billion in 2023 and is expected to grow at a compound annual growth rate (CAGR) of 24.4% from 2023 to 2030. The growing alliance between Engineering Service Providers (ESP) and Original Equipment Manufacturers (OEM) is predicted to be one of the direct factors propelled by the increase in the acceptance of engineering services outsourcing (ESO). The global R&D developments, the rising demand for incorporating the most delinquent technologies in the product offerings, and the increasing need to trim the product lifecycles, and trim costs are also anticipated to contribute to the market growth. The engineering services outsourcing market has constantly been growing in line with the substantial passion for the customers to outsource different services as part of the measures to cut costs.

U.S. engineering services outsourcing market size and growth rate, 2024 - 2030

The engineering services outsourcing model has also been developed subsequently to deliver smart solutions to customers. The ESO industry has noticed a paradigm transformation from core engineering services to embedded engineering solutions, combining automation, analytics, and the Internet of Things (IoT), among others. Furthermore, technological advancements have opened the way for Platform-as-a-Service (PaaS) plans with combined IT solutions.

Global R&D activities have made the major engineering services outsourcing industry players include global systems of delivery in their business strategies. The market has witnessed a remarkable shift in engineering service requirements from mechanical and non-core needs to center competencies in place markets. The change in approach toward product lifecycle development focuses on the position of ESPs in the OEMs’ supply chains.

As the ESO delivers and continues to evolve, ESPs are making service delivery standards, which combine much more comprehensive engagement portfolios and a licensing framework that encourages innovation and accelerates both bottom-line and top-line growth. Furthermore, the rapid digitalization among various industries to increase their productivity is also impacting the market growth significantly.

The execution of Industry 4.0 is enabling intelligent manufacturing and propelling the demand for the most delinquent industrial solutions based on robotics, artificial intelligence (AI), and machine learning (ML), thereby extending possibilities for IT combining with the service offerings of ESPs. End application enterprises and industry verticals, specifically automotive and aerospace industries, among others, which need reliable hardware manufacturing qualifications, appear as possible clients for providing digital conversion services.

Also, the increasing need for automation tools in the available system architecture is anticipated to open tremendous opportunities for ESPs. On the other hand, new players may find it contesting to establish a foothold in the ESO market concerning a lack of project expertise, technology expertise, and business operations. Nevertheless, global digitization also shows cybersecurity issues.

The binding of various end application enterprises and industry verticals trade large magnitudes of information, containing data connected with observing, freight management, and grade assurance with assistance providers, OEMs, and customers. Also, service providers, OEMs, and suppliers often trade personal data on technology, implementation, and points of services or equipment to improve collaboration on design, development, and support.

Consequently, manufacturers are embarking on preventive measures, such as setting the network operations, saving important information with key codes, and including the original arrangements of the design or the original code, as part of the efforts to save the Intellectual Property (IP). As the result of the eruption of the COVID-19 pandemic and the following lockdowns in different nations across the globe, the market changed, relying on the end application enterprises and industry verticals.

Market Concentration & Characteristics

The engineering services outsourcing market is expected to exhibit a high degree of innovation. As industries increasingly leverage engineering outsourcing for cost-centric solutions and specialized expertise, service providers are compelled to stay at the forefront of technological advancements. The nature of engineering services, encompassing fields such as product design, research and development, and technology integration, demands continuous innovation. Companies within the ESO market are expected to invest in advanced technologies such as artificial intelligence, digital twin simulations, and automation to enhance their service offerings.

Engineering Services Outsourcing Market Concentration & Characteristics

The market is anticipated to experience a moderate to high level of merger and acquisition (M&A) activities. As companies seek to expand their service portfolios, global presence, and technological capabilities, strategic partnerships and acquisitions become viable pathways for growth. Larger engineering service providers may engage in acquisitions to broaden their industry expertise or enter new geographical markets, while smaller firms could pursue M&A to enhance their technological capabilities or achieve economies of scale.

The impact of regulations on competition within the engineering services outsourcing market is expected to be moderate to high. ESO involves handling sensitive data, intellectual property, and compliance with industry standards, making it subject to various regulatory frameworks. Regulations related to data security, intellectual property protection, and compliance with quality and safety standards can significantly influence the competitive landscape. Compliance requirements may add complexity to operations and create barriers to entry, affecting the competitive dynamics within the market.

The competition from service substitutes in the engineering services outsourcing market is expected to be moderate to low. ESO involves highly specialized engineering services such as product design, research and development, and technical expertise, making direct substitutes less prevalent. While some companies may choose to handle engineering tasks in-house, the intricate nature of engineering services often necessitates specialized knowledge and resources. However, advancements in technology such as digital twin, 5G, and the emergence of alternative solutions, such as software tools for specific engineering tasks, could present indirect substitutes.

The end-user concentration in the engineering services outsourcing market is expected to be moderate to high. ESO caters to a diverse range of industries, including automotive, aerospace, electronics, and manufacturing, leading to a varied end-user base. However, within specific sectors with intricate engineering solution needs, concentration may be higher, as companies within those industries seek specialized engineering services. Large enterprises with complex projects may dominate certain segments, influencing competition dynamics.

Application Insights

The manufacturing segment accounted for the highest revenue share in 2022 and is expected to continue to dominate the market over the forecast period. Digitalization is increasingly embraced in different probe services, including the drilling process, blasting process, crushing, and tunneling processes.

Industrial goods manufacturing companies are significantly embracing cloud infrastructure to contemporize their information technology-driven infrastructure, drive automation, and streamline inheritance processes through the execution of the private, public, and hybrid clouds. The performance of the industrial internet of things to decrease downtimes, catch and control faults, and cut supervision costs is especially anticipated to drive the growth of the industrial segment.

The healthcare segment is projected to grow at a compounded annual growth rate of more than 18% from 2023 to 2030. The growth can be propelled through aggressive investments in cutting-edge medical equipment, laboratories, and medications. The ESPs noticed sustainment in their sales as they are precisely favored by the healthcare industry, particularly in the past few months, to produce drugs and vaccines that will eradicate the harmful consequences of coronavirus.

Healthcare companies are increasingly collaborating to improve clinical ability and cut operating costs. For instance, in August 2023, Wipro Limited declared its collaboration with Amazon Web Services (AWS) for the upcoming evolution of laboratory procedures in the life sciences sector. This inventive solution aims to tackle the fundamental challenges affecting the industry by introducing a comprehensive, cloud-based platform. This platform is designed to streamline laboratory processes and foster improved collaboration among various stakeholders. This, in turn, is expected to fuel the growth of the engineering services outsourcing market over the forecast period.

Service Insights

Based on services, the ‘testing’ sub-segment is anticipated to record the largest revenue share in 2022. The necessity to create and redesign product prototypes with higher optimization and error-free processes has been propelling the growth of the testing part over the past years. OEMs are specifically engaging with software testing assistance from ESPs to establish easy usage for users and error-free software. Also, the increasing demand for outsourcing testing services to facilitate manual intervention and about-face time is predicted to contribute to the development of the testing segment.

Designing, based on services, is expected to witness growth at a notable CAGR over the forecast period. The increase can propel the growing sophistication of designs and the demand to reduce costs by outsourcing design to a professional but somewhat low-cost workforce. The increasing vogue of industrial, graphic, and architectural designing for next-generation logistics solutions and tools is predicted to initiate the demand for innovation engineering over the projection period.

Location Insights

The on-shore part accounted for the highest revenue share of over 57% in 2022 and is anticipated to dominate the market from 2023 to 2030. The political and geopolitical boundaries, time zone fences, and language & cultural boundaries are some of the obstacles that encourage OEMs to opt for outsourcing on-shore engineering services. On-shore outsourcing significantly rejects language obstacles and aids in improving communication between OEMs and service providers, which additionally enhances the delivery of products and services.

Global engineering services outsourcing market share and size, 2023

The off-shore part is expected to witness significant growth corresponding to the on-shore part due to the international inflation rates, high mixed rates, training costs, and increasing preference for outsourcing to on-shore partners. Further, ESPs need to accept various rules in outsourcing contracts while catering to customers present in other countries. The segment growth can be propelled through the availability of optimal cost resources and effortless adequacy of a qualified skill pool in countries such as China, India, Malaysia, and Mexico.

Regional Insights

Asia Pacific registered the highest revenue share in the global market share of over 41% in 2022. The region is a home for industrial goods manufacturing and cost-effective hiring assistance supplied by highly proficient engineering professionals. The countries including South Korea, Australia, Indonesia, Philippines etc. have emerged as significant contributors to this regional dominance. South Korea's advanced technological infrastructure and expertise, particularly in industries like electronics and automotive, have attracted substantial outsourcing contracts. Australia's thriving engineering sector, coupled with its stable business environment, has positioned it as a preferred destination for outsourcing. The growing demand for technological invention and the persistent combination of embedded software into the current models is foreseen to drive the development of the Asia Pacific regional market.

Engineering Services Outsourcing Market Trends, by Region, 2024 - 2030

The engineering services outsourcing (ESO) market in Europe has witnessed a significant CAGR positioning it for substantial future growth. This growth is attributed to the region’s strategic geographical location, coupled with its well-developed infrastructure and skilled workforce, has attracted a surge in outsourcing activities.Additionally, Spain's competitive cost structure compared to other Western European countries has made it an appealing destination for outsourcing contracts. Moreover, the strong industrial base, technological innovation, and a focus on sustainable practices, contribute to the overall growth of the ESO market in the region.

South America is expected to witness the fastest growth registering a CAGR of over 28.9% during the forecast period. The area has emerged among the numerous preferred off-shore outsourcing establishments for manufacturers and suppliers based in the U.S. As a result, several major companies are attempting to achieve hold in South America. Another critical factor driving the growth of the South American local market is the steady salary inflation reached in other off-shore locations. Also, the paperwork needed for outsourcing activity in the area is highly detailed, which acts as a benefit, thus making it an attractive market for both parties.

Key Companies & Market Share Insights

Major incumbents of the market include Alten Group, Altair Engineering, Inc.; Infosys Limited; Tata Consultancy Services Limited; Boston Engineering Corporation; and Altran. Major industry performers have been developing solutions to help manufacturers implement cutting-edge technologies in their engineering projects. The ever-changing customer demand have raised the stress on the OEMs for proper and faster delivery, thereby making it essential to indulge in outsourcing in their operations.

Many companies are investing heavily in advanced technologies such as artificial intelligence, data analytics, and automation to provide pioneering engineering solutions. Additionally, a strong emphasis on sustainable practices, collaboration with niche technology partners, and the development of client-centric service models are key strategies. Companies are also exploring diversified service offerings to cater to evolving client needs, aiming for agility and resilience in the rapidly changing engineering landscape.

Furthermore, the top ESO vendors are also creating an invasion into full-time consultation and setting strategic relationships with the end-applicants by helping them with their service offerings, thereby improving their operational performance.

Key Engineering Services Outsourcing Companies:

  • AKKA
  • Alten Group
  • Capgemini Engineering
  • Entelect
  • HCL Technologies Limited
  • Infosys Limited
  • Tata Elxsi
  • Tata Consultancy Services Limited.
  • Tech Mahindra Limited
  • Wipro Limited

Recent Developments

  • In January 2024, Albertsons Media Collective partnered with Capgemini Engineering for services, including media planning, media operations, and content creation. Utilizing Capgemini's intelligent process automation technology, supported by artificial intelligence (AI) and robotic process automation, Albertsons Media Collective aims to enhance its operations significantly. As part of this collaboration, Capgemini will integrate cutting-edge technology to automate various aspects, including media planning, activation workflows, creative versioning, and providing insights for live campaign optimizations.

  • In September 2023, the Alten Group completed the acquisition of Accord Global Technology Solutions, an engineering services company located in India. This strategic merger brings together ALTEN's extensive scale and technological diversity with Accord Global Technology Solutions' digital innovation and expertise. The primary focus of this acquisition is to harness technologies and enhance engineering capabilities for further development.

  • In August 2023, BrainChip and Tata Elxsi joined forces to offer intelligent, ultralow-power solutions. The primary objective of this partnership is to integrate Akida technology into medical devices and industrial applications, utilizing BrainChip's pioneering fully digital neuromorphic technology. The goal is to deliver intelligent and energy-efficient solutions tailored to the specific demands of these target markets.

  • In April 2023, Marks and Spencer PLC (M&S) extended its partnership with Tata Consultancy Services (TCS) to revamp M&S's core technology stack. The goal is to enhance innovation speed and resilience and foster sustainable growth. The modernization program aims to improve speed to market, reduce technological debt, and enhance operating model efficiency for M&S.

  • In February 2023, Tech Mahindra and the Ministry of Communication and Information Technology (MCIT) of Saudi Arabia signed a Memorandum of Understanding (MoU) to establish a Data & AI and a Cloud Centre of Excellence (CoE). The CoE is designed to integrate academic and socioeconomic goals, aiming to propel the growth of small and medium businesses, enhance the nation's capabilities in high-tech expertise, and generate high-quality employment opportunities.

Engineering Services Outsourcing Market Report Scope

Report Attribute

Details

Market size value in 2023

USD 2,039.60 billion

Revenue forecast in 2030

USD 9,398.95 billion

Growth Rate

CAGR of 24.4% from 2023 to 2030

Actual data

2018 - 2023

Forecast period

2024 - 2030

Quantitative units

Revenue in USD billion and CAGR from 2023 to 2030

Report coverage

Revenue forecast, company ranking, competitive landscape, growth factors, and trends

Segments covered

Services, location, application, region

Regional scope

North America; Europe; Asia Pacific; South America; Middle East & Africa (MEA)

Country scope

U.S.; Canada; Mexico; U.K.; Germany; France; Italy; China; Japan; India; Brazil; Argentina; UAE; Saudi Arabia; South Africa; Spain; South Korea; Australia; Indonesia; Philippines.

Key companies profiled

AKKA; Alten Group; Capgemini Engineering; Entelect; HCL Technologies Limited; Infosys Limited; Tata Elxsi; Tata Consultancy Services Limited.; Tech Mahindra Limited; Wipro Limited

Customization scope

Free report customization (equivalent up to 8 analysts working days) with purchase. Addition or alteration to country, regional & segment scope.

Pricing and purchase options

Avail customized purchase options to meet your exact research needs. Explore purchase options


GLobal Engineering Services Outsourcing Market Report Segmentation

This report forecasts revenue growth at global, regional, and country levels and provides an analysis of the latest industry trends in each of the sub-segments from 2018 to 2030. For this study, Grand View Research has segmented the global engineering services outsourcing market report based on services, location, application, and region:

Global Engineering Services Outsourcing Market Report Segmentation

  • Service Outlook (Revenue, USD Billion, 2018 - 2030)

    • Designing

    • Prototyping

    • System Integration

    • Testing

    • Others

  • Location Outlook (Revenue, USD Billion, 2018 - 2030)

    • On-shore

    • Off-shore

  • Application Outlook (Revenue, USD Billion, 2018 - 2030)

    • Aerospace

    • Automotive

    • Manufacturing

    • Consumer Electronics

    • Semiconductors

    • Healthcare

    • Telecom

    • Energy & Utilities

    • Construction & Infrastructure

    • Others

  • Regional Outlook (Revenue, USD Million, 2018 - 2030)

    • North America

      • U.S.

      • Canada

      • Mexico

    • Europe

      • UK

      • Germany

      • France

      • Italy

      • Spain

    • Asia Pacific

      • China

      • India

      • Japan

      • South Korea

      • Australia

      • Indonesia

      • Philippines
    • South America

      • Brazil

      • Argentina

    • Middle East and Africa (MEA)

      • Saudi Arabia

      • UAE

      • South Africa

Frequently Asked Questions About This Report

Table of Contents

Chapter 1 Engineering Services Outsourcing Market: Methodology and Scope
                   1.1 Market Segmentation & Scope
                   1.2 Market Definitions
                   1.3 Information Procurement
                       1.3.1 Purchased database
                       1.3.2 GVR’S internal database
                       1.3.3 Secondary sources & third party perspective
                       1.3.4 Primary research
                   1.4 Information Analysis
                       1.4.1 Data analysis models
                   1.5 Market Formulation and Data Visualization
                   1.6 Data Validation and Publishing
Chapter 2 Engineering Services Outsourcing Market: Executive Summary
                   2.1 Market Outlook
                   2.2 Segmental Outlook
                   2.3 Competitive Insights
Chapter 3 Engineering Services Outsourcing Market: Variables, Trends & Scope
                   3.1 Market Introduction
                   3.2 Industry Value Chain Analysis
                   3.3 Market Dynamics
                       3.3.1 Market driver analysis
                       3.3.2 Market restraint/challenges analysis
                       3.3.3 Industry opportunities
                   3.4 Penetration & Growth Prospect Mapping
                   3.5 Business Environment Analysis Tools
                       3.5.1 Porter’s five forces analysis
                       3.5.2 Pest analysis
Chapter 4 Service Estimates and Trend Analysis
                   4.1 Market Size Estimates & Forecasts and Trend Analysis, 2018 - 2030 (USD Billion)
                   4.2 Service Movement Analysis & Market Share, 2022 & 2030
                   4.3 Designing
                       4.3.1 Market size estimates and forecasts, 2018 - 2030 (USD Billion)
                   4.4 Prototyping
                       4.4.1 Market size estimates and forecasts, 2018 - 2030 (USD Billion)
                   4.5 System Integration
                       4.5.1 Market size estimates and forecasts, 2018 - 2030 (USD Billion)
                   4.6 Testing
                       4.6.1 Market size estimates and forecasts, 2018 - 2030 (USD Billion)
                   4.7 Others
                       4.7.1 Market size estimates and forecasts, 2018 - 2030 (USD Billion)
Chapter 5 Location Estimates and Trend Analysis
                   5.1 Market Size Estimates & Forecasts and Trend Analysis, 2018 - 2030 (USD Billion)
                   5.2 Location Movement Analysis & Market Share, 2022 & 2030
                   5.3 Onshore
                       5.3.1 Market size estimates and forecasts, 2018 - 2030 (USD Billion)
                   5.4 Offshore
                       5.4.1 Market size estimates and forecasts, 2018 - 2030 (USD Billion)
Chapter 6 Application Estimates and Trend Analysis
                   6.1 Market Size Estimates & Forecasts and Trend Analysis, 2018 - 2030 (USD Billion)
                   6.2 Application Movement Analysis & Market Share, 2022 & 2030
                   6.3 Aerospace
                       6.3.1 Market size estimates and forecasts, 2018 - 2030 (USD Billion)
                   6.4 Automotive
                       6.4.1 Market size estimates and forecasts, 2018 - 2030 (USD Billion)
                   6.5 Manufacturing
                       6.5.1 Market size estimates and forecasts, 2018 - 2030 (USD Billion)
                   6.6 Consumer electronics
                       6.6.1 Market size estimates and forecasts, 2018 - 2030 (USD Billion)
                   6.7 Semiconductors
                       6.7.1 Market size estimates and forecasts, 2018 - 2030 (USD Billion)
                   6.8 Healthcare
                       6.8.1 Market size estimates and forecasts, 2018 - 2030 (USD Billion)
                   6.9 Telecom
                       6.9.1 Market size estimates and forecasts, 2018 - 2030 (USD Billion)
                   6.10 Energy & Utilities
                       6.10.1 Market size estimates and forecasts, 2018 - 2030 (USD Billion)
                   6.11 Construction & Infrastructure
                       6.11.1 Market size estimates and forecasts, 2018 - 2030 (USD Billion)
                   6.12 Others
                       6.12.1 Market size estimates and forecasts, 2018 - 2030 (USD Billion)
Chapter 7 Regional Estimates & Trend Analysis
                   7.1 Engineering Services Outsourcing market by region, 2022 & 2030
                   7.2 Regional Movement Analysis & Market Share, 2022 & 2030
                   7.3 North America
                       7.3.1 Market estimates and forecast, 2018 - 2030 (USD Billion)
                       7.3.2 Market estimates and forecast, 2018 - 2030 (USD Billion)
                       7.3.3 Market estimates and forecast, 2018 - 2030 (USD Billion)
                       7.3.4 U.S.
                           7.3.4.1 Market estimates and forecast, 2018 - 2030 (USD Billion)
                           7.3.4.2 Market estimates and forecast, 2018 - 2030 (USD Billion)
                           7.3.4.3 Market estimates and forecast, 2018 - 2030 (USD Billion)
                       7.3.5 Canada
                           7.3.5.1 Market estimates and forecast, 2018 - 2030 (USD Billion)
                           7.3.5.2 Market estimates and forecast, 2018 - 2030 (USD Billion)
                           7.3.5.3 Market estimates and forecast, 2018 - 2030 (USD Billion)
                       7.3.6 Mexico
                           7.3.6.1 Market estimates and forecast, 2018 - 2030 (USD Billion)
                           7.3.6.2 Market estimates and forecast, 2018 - 2030 (USD Billion)
                           7.3.6.3 Market estimates and forecast, 2018 - 2030 (USD Billion)
                   7.4 Europe
                       7.4.1 Market estimates and forecast, 2018 - 2030 (USD Billion)
                       7.4.2 Market estimates and forecast, 2018 - 2030 (USD Billion)
                       7.4.3 Market estimates and forecast, 2018 - 2030 (USD Billion)
                       7.4.4 U.K.
                           7.4.4.1 Market estimates and forecast, 2018 - 2030 (USD Billion)
                           7.4.4.2 Market estimates and forecast, 2018 - 2030 (USD Billion)
                           7.4.4.3 Market estimates and forecast, 2018 - 2030 (USD Billion)
                       7.4.5 Germany
                           7.4.5.1 Market estimates and forecast, 2018 - 2030 (USD Billion)
                           7.4.5.2 Market estimates and forecast, 2018 - 2030 (USD Billion)
                           7.4.5.3 Market estimates and forecast, 2018 - 2030 (USD Billion)
                       7.4.6 France
                           7.4.6.1 Market estimates and forecast, 2018 - 2030 (USD Billion)
                           7.4.6.2 Market estimates and forecast, 2018 - 2030 (USD Billion)
                           7.4.6.3 Market estimates and forecast, 2018 - 2030 (USD Billion)
                       7.4.7 Italy
                           7.4.7.1 Market estimates and forecast, 2018 - 2030 (USD Billion)
                           7.4.7.2 Market estimates and forecast, 2018 - 2030 (USD Billion)
                           7.4.7.3 Market estimates and forecast, 2018 - 2030 (USD Billion)
                       7.4.8 Spain
                           7.4.8.1 Market estimates and forecast, 2018 - 2030 (USD Billion)
                           7.4.8.2 Market estimates and forecast, 2018 - 2030 (USD Billion)
                           7.4.8.3 Market estimates and forecast, 2018 - 2030 (USD Billion)
                   7.5 Asia Pacific
                       7.5.1 Market estimates and forecast, 2018 - 2030 (USD Billion)
                       7.5.2 Market estimates and forecast, 2018 - 2030 (USD Billion)
                       7.5.3 Market estimates and forecast, 2018 - 2030 (USD Billion)
                       7.5.4 China
                           7.5.4.1 Market estimates and forecast, 2018 - 2030 (USD Billion)
                           7.5.4.2 Market estimates and forecast, 2018 - 2030 (USD Billion)
                           7.5.4.3 Market estimates and forecast, 2018 - 2030 (USD Billion)
                       7.5.5 India
                           7.5.5.1 Market estimates and forecast, 2018 - 2030 (USD Billion)
                           7.5.5.2 Market estimates and forecast, 2018 - 2030 (USD Billion)
                           7.5.5.3 Market estimates and forecast, 2018 - 2030 (USD Billion)
                       7.5.6 Japan
                           7.5.6.1 Market estimates and forecast, 2018 - 2030 (USD Billion)
                           7.5.6.2 Market estimates and forecast, 2018 - 2030 (USD Billion)
                           7.5.6.3 Market estimates and forecast, 2018 - 2030 (USD Billion)
                       7.5.7 South Korea
                           7.5.7.1 Market estimates and forecast, 2018 - 2030 (USD Billion)
                           7.5.7.2 Market estimates and forecast, 2018 - 2030 (USD Billion)
                           7.5.7.3 Market estimates and forecast, 2018 - 2030 (USD Billion)
                       7.5.8 Australia
                           7.5.8.1 Market estimates and forecast, 2018 - 2030 (USD Billion)
                           7.5.8.2 Market estimates and forecast, 2018 - 2030 (USD Billion)
                           7.5.8.3 Market estimates and forecast, 2018 - 2030 (USD Billion)
                       7.5.9 Indonesia
                           7.5.9.1 Market estimates and forecast, 2018 - 2030 (USD Billion)
                           7.5.9.2 Market estimates and forecast, 2018 - 2030 (USD Billion)
                           7.5.9.3 Market estimates and forecast, 2018 - 2030 (USD Billion)
                       7.5.10 Philippines
                           7.5.10.1 Market estimates and forecast, 2018 - 2030 (USD Billion)
                           7.5.10.2 Market estimates and forecast, 2018 - 2030 (USD Billion)
                           7.5.10.3 Market estimates and forecast, 2018 - 2030 (USD Billion)
                   7.6 South America
                       7.6.1 Market estimates and forecast, 2018 - 2030 (USD Billion)
                       7.6.2 Market estimates and forecast, 2018 - 2030 (USD Billion)
                       7.6.3 Market estimates and forecast, 2018 - 2030 (USD Billion)
                       7.6.4 Brazil
                           7.6.4.1 Market estimates and forecast, 2018 - 2030 (USD Billion)
                           7.6.4.2 Market estimates and forecast, 2018 - 2030 (USD Billion)
                           7.6.4.3 Market estimates and forecast, 2018 - 2030 (USD Billion)
                       7.6.5 Argentina
                           7.6.5.1 Market estimates and forecast, 2018 - 2030 (USD Billion)
                           7.6.5.2 Market estimates and forecast, 2018 - 2030 (USD Billion)
                           7.6.5.3 Market estimates and forecast, 2018 - 2030 (USD Billion)
                   7.7 Middle East & Africa (MEA)
                       7.7.1 Market estimates and forecast, 2018 - 2030 (USD Billion)
                       7.7.2 Market estimates and forecast, 2018 - 2030 (USD Billion)
                       7.7.3 Market estimates and forecast, 2018 - 2030 (USD Billion)
                       7.7.4 UAE
                           7.7.4.1 Market estimates and forecast, 2018 - 2030 (USD Billion)
                           7.7.4.2 Market estimates and forecast, 2018 - 2030 (USD Billion)
                           7.7.4.3 Market estimates and forecast, 2018 - 2030 (USD Billion)
                       7.7.5 Saudi Arabia
                           7.7.5.1 Market estimates and forecast, 2018 - 2030 (USD Billion)
                           7.7.5.2 Market estimates and forecast, 2018 - 2030 (USD Billion)
                           7.7.5.3 Market estimates and forecast, 2018 - 2030 (USD Billion)
                       7.7.6 South Africa
                           7.7.6.1 Market estimates and forecast, 2018 - 2030 (USD Billion)
                           7.7.6.2 Market estimates and forecast, 2018 - 2030 (USD Billion)
                           7.7.6.3 Market estimates and forecast, 2018 - 2030 (USD Billion)
Chapter 8 Competitive Analysis
                   8.1 Key Global Players, Recent Developments & Their Impact on the Industry
                   8.2 Key Company/Competition Categorization (Key Innovators, Market Leaders, Emerging Players)
                   8.3 Key Company Ranking Analysis, 2022
Chapter 9 Competitive Landscape
                   9.1 AKKA
                       9.1.1 Company overview
                       9.1.2 Financial performance
                       9.1.3 Service benchmarking
                       9.1.4 Recent developments
                   9.2 Alten Group
                       9.2.1 Company overview
                       9.2.2 Financial performance
                       9.2.3 Service benchmarking
                       9.2.4 Recent developments
                   9.3 Capgemini Engineering
                       9.3.1 Company overview
                       9.3.2 Financial performance
                       9.3.3 Service benchmarking
                       9.3.4 Recent developments
                   9.4 Entelect
                       9.4.1 Company overview
                       9.4.2 Financial performance
                       9.4.3 Service benchmarking
                       9.4.4 Recent developments
                   9.5 HCL Technologies Limited
                       9.5.1 Company overview
                       9.5.2 Financial performance
                       9.5.3 Service benchmarking
                       9.5.4 Recent developments
                   9.6 Infosys Limited
                       9.6.1 Company overview
                       9.6.2 Financial performance
                       9.6.3 Service benchmarking
                       9.6.4 Recent developments
                   9.7 Tata Elxsi
                       9.7.1 Company overview
                       9.7.2 Financial performance
                       9.7.3 Service benchmarking
                       9.7.4 Recent developments
                   9.8 Tata Consultancy Services Limited.
                       9.8.1 Company overview
                       9.8.2 Financial performance
                       9.8.3 Service benchmarking
                       9.8.4 Recent developments
                   9.9 Tech Mahindra Limited
                       9.9.1 Company overview
                       9.9.2 Financial performance
                       9.9.3 Service benchmarking
                       9.9.4 Recent developments
                   9.10 Wipro Limited
                       9.10.1 Company overview
                       9.10.2 Financial performance
                       9.10.3 Service benchmarking
                       9.10.4 Recent developments


List of Tables

Table 1 Engineering services outsourcing market size estimates & forecasts, 2018 - 2030 (USD Billion)
Table 2 Engineering services outsourcing market, by region, 2018 - 2030 (USD Billion)
Table 3 Engineering services outsourcing market, by services, 2018 - 2030 (USD Billion)
Table 4 Engineering services outsourcing market, by location, 2018 - 2030 (USD Billion)
Table 5 Engineering services outsourcing market, by application, 2018 - 2030 (USD Billion)
Table 6 Key market driver impact
Table 7 Key market restraint/challenges impact
Table 9 Global designing engineering services outsourcing market by region, 2018 - 2030 (USD Billion)
Table 10 Global prototyping engineering services outsourcing market by region, 2018 - 2030 (USD Billion)
Table 11 Global system integration engineering services outsourcing market by region, 2018 - 2030 (USD Billion)
Table 12 Global testing engineering services outsourcing market by region, 2018 - 2030 (USD Billion)
Table 13 Global other services market by region, 2018 - 2030 (USD Billion)
Table 14 Global onshore engineering services outsourcing market by region, 2018 - 2030 (USD Billion)
Table 15 Global offshore engineering services outsourcing market by region, 2018 - 2030 (USD Billion)
Table 16 Global aerospace engineering services outsourcing market by region, 2018 - 2030 (USD Billion)
Table 17 Global automotive engineering services outsourcing market by region, 2018 - 2030 (USD Billion)
Table 18 Global manufacturing engineering services outsourcing market by region, 2018 - 2030 (USD Billion)
Table 19 Global consumer electronics engineering services outsourcing market by region, 2018 - 2030 (USD Billion)
Table 20 Global semiconductors engineering services outsourcing market by region, 2018 - 2030 (USD Billion)
Table 21 Global healthcare engineering services outsourcing market by region, 2018 - 2030 (USD Billion)
Table 22 Global telecom engineering services outsourcing market by region, 2018 - 2030 (USD Billion)
Table 23 Global engineering services outsourcing market for other sectors by region, 2018 - 2030 (USD Billion)
Table 24 North America engineering services outsourcing market by services, 2018 - 2030 (USD Billion)
Table 25 North America engineering services outsourcing market by location, 2018 - 2030 (USD Billion)
Table 26 North America engineering services outsourcing market by application, 2018 - 2030 (USD Billion)
Table 27 U.S. engineering services outsourcing market by services, 2018 - 2030 (USD Billion)
Table 28 U.S. engineering services outsourcing market by location, 2018 - 2030 (USD Billion)
Table 29 U.S. engineering services outsourcing market by application, 2018 - 2030 (USD Billion)
Table 30 Canada engineering services outsourcing market by services, 2018 - 2030 (USD Billion)
Table 31 Canada engineering services outsourcing market by location, 2018 - 2030 (USD Billion)
Table 32 Canada engineering services outsourcing market by application, 2018 - 2030 (USD Billion)
Table 33 Mexico engineering services outsourcing market by services, 2018 - 2030 (USD Billion)
Table 34 Mexico engineering services outsourcing market by location, 2018 - 2030 (USD Billion)
Table 35 Mexico engineering services outsourcing market by application, 2018 - 2030 (USD Billion)
Table 36 Europe engineering services outsourcing market by services, 2018 - 2030 (USD Billion)
Table 37 Europe engineering services outsourcing market by location, 2018 - 2030 (USD Billion)
Table 38 Europe engineering services outsourcing market by application, 2018 - 2030 (USD Billion)
Table 36 U.K. engineering services outsourcing market by services, 2018 - 2030 (USD Billion)
Table 39 U.K. engineering services outsourcing market by location, 2018 - 2030 (USD Billion)
Table 40 U.K. engineering services outsourcing market by application, 2018 - 2030 (USD Billion)
Table 41 Germany engineering services outsourcing market by services, 2018 - 2030 (USD Billion)
Table 42 Germany engineering services outsourcing market by location, 2018 - 2030 (USD Billion)
Table 43 Germany engineering services outsourcing market by application, 2018 - 2030 (USD Billion)
Table 44 France engineering services outsourcing market by services, 2018 - 2030 (USD Billion)
Table 45 France engineering services outsourcing market by location, 2018 - 2030 (USD Billion)
Table 46 France engineering services outsourcing market by application, 2018 - 2030 (USD Billion)
Table 47 Italy engineering services outsourcing market by services, 2018 - 2030 (USD Billion)
Table 48 Italy engineering services outsourcing market by location, 2018 - 2030 (USD Billion)
Table 49 Italy engineering services outsourcing market by application, 2018 - 2030 (USD Billion)
Table 50 Spain engineering services outsourcing market by services, 2018 - 2030 (USD Billion)
Table 51 Spain engineering services outsourcing market by location, 2018 - 2030 (USD Billion)
Table 52 Spain engineering services outsourcing market by application, 2018 - 2030 (USD Billion)
Table 53 Asia Pacific engineering services outsourcing market by services, 2018 - 2030 (USD Billion)
Table 54 Asia Pacific engineering services outsourcing market by location, 2018 - 2030 (USD Billion)
Table 55 Asia Pacific engineering services outsourcing market by application, 2018 - 2030 (USD Billion)
Table 56 China engineering services outsourcing market by services, 2018 - 2030 (USD Billion)
Table 57 China engineering services outsourcing market by location, 2018 - 2030 (USD Billion)
Table 58 China engineering services outsourcing market by application, 2018 - 2030 (USD Billion)
Table 59 India engineering services outsourcing market by services, 2018 - 2030 (USD Billion)
Table 60 India engineering services outsourcing market by location, 2018 - 2030 (USD Billion)
Table 61 India engineering services outsourcing market by application, 2018 - 2030 (USD Billion)
Table 62 Japan engineering services outsourcing market by services, 2018 - 2030 (USD Billion)
Table 63 Japan engineering services outsourcing market by location, 2018 - 2030 (USD Billion)
Table 64 Japan engineering services outsourcing market by application, 2018 - 2030 (USD Billion)
Table 65 South Korea engineering services outsourcing market by services, 2018 - 2030 (USD Billion)
Table 66 South Korea engineering services outsourcing market by location, 2018 - 2030 (USD Billion)
Table 67 South Korea engineering services outsourcing market by application, 2018 - 2030 (USD Billion)
Table 68 Australia engineering services outsourcing market by services, 2018 - 2030 (USD Billion)
Table 69 Australia engineering services outsourcing market by location, 2018 - 2030 (USD Billion)
Table 70 Australia engineering services outsourcing market by application, 2018 - 2030 (USD Billion)
Table 71 Indonesia engineering services outsourcing market by services, 2018 - 2030 (USD Billion)
Table 72 Indonesia engineering services outsourcing market by location, 2018 - 2030 (USD Billion)
Table 73 Indonesia engineering services outsourcing market by application, 2018 - 2030 (USD Billion)
Table 74 Philippines engineering services outsourcing market by services, 2018 - 2030 (USD Billion)
Table 75 Philippines engineering services outsourcing market by location, 2018 - 2030 (USD Billion)
Table 76 Philippines engineering services outsourcing market by application, 2018 - 2030 (USD Billion)
Table 77 South America engineering services outsourcing market by services, 2018 - 2030 (USD Billion)
Table 78 South America engineering services outsourcing market by location, 2018 - 2030 (USD Billion)
Table 79 South America engineering services outsourcing market by application, 2018 - 2030 (USD Billion)
Table 80 Brazil engineering services outsourcing market by services, 2018 - 2030 (USD Billion)
Table 81 Brazil engineering services outsourcing market by location, 2018 - 2030 (USD Billion)
Table 82 Brazil engineering services outsourcing market by application, 2018 - 2030 (USD Billion)
Table 83 Argentina engineering services outsourcing market by services, 2018 - 2030 (USD Billion)
Table 84 Argentina engineering services outsourcing market by location, 2018 - 2030 (USD Billion)
Table 85 Argentina engineering services outsourcing market by application, 2018 - 2030 (USD Billion)
Table 86 MEA engineering services outsourcing market by services, 2018 - 2030 (USD Billion)
Table 87 MEA engineering services outsourcing market by location, 2018 - 2030 (USD Billion)
Table 88 MEA engineering services outsourcing market by application, 2018 - 2030 (USD Billion)
Table 89 UAE engineering services outsourcing market by services, 2018 - 2030 (USD Billion)
Table 90 UAE engineering services outsourcing market by location, 2018 - 2030 (USD Billion)
Table 91 UAE engineering services outsourcing market by application, 2018 - 2030 (USD Billion)
Table 92 Saudi Arabia engineering services outsourcing market by services, 2018 - 2030 (USD Billion)
Table 93 Saudi Arabia engineering services outsourcing market by location, 2018 - 2030 (USD Billion)
Table 94 Saudi Arabia engineering services outsourcing market by application, 2018 - 2030 (USD Billion)
Table 95 South Africa engineering services outsourcing market by services, 2018 - 2030 (USD Billion)
Table 96 South Africa engineering services outsourcing market by location, 2018 - 2030 (USD Billion)
Table 97 South Africa engineering services outsourcing market by application, 2018 - 2030 (USD Billion)


List of Figures

Fig. 1 Market segmentation & scope
Fig. 2 Information procurement
Fig. 3 Primary research pattern
Fig. 4 Primary research process
Fig. 5 Market formulation and data visualization
Fig. 6 Industry snapshot
Fig. 7 Value chain analysis
Fig. 8 Market dynamics
Fig. 9 Market dynamics
Fig. 10 Penetration & growth prospect mapping
Fig. 11 Industry Analysis-Porter’s
Fig. 12 PEST Analysis
Fig. 13 ESO market- Services outlook key takeaways, Revenue 2018 - 2030 (USD Billion)
Fig. 14 Services movement analysis & market share, 2022 & 2030, Revenue (USD Billion)
Fig. 15 ESO Market - Location outlook key takeaways, Revenue 2018 - 2030 (USD Billion)
Fig. 16 Location movement analysis & market share, 2022 & 2030, Revenue (USD Billion)
Fig. 17 ESO Market - Application outlook key takeaways, Revenue 2018 - 2030 (USD Billion)
Fig. 18 Application movement analysis & market share, 2022 & 2030, Revenue (USD Billion)
Fig. 19 ESO market by region, 2022 & 2030
Fig. 20 Regional movement analysis & market share, 2022 & 2030, Revenue (USD Billion)
Fig. 21 North America engineering services outsourcing market - Key takeaways, 2022 & 2030
Fig. 22 North America engineering services outsourcing market by services, 2018 - 2030 (USD Billion)
Fig. 23 North America engineering services outsourcing market by location, 2018 - 2030 (USD Billion)
Fig. 24 North America engineering services outsourcing market by application, 2018 - 2030 (USD Billion)
Fig. 25 U.S. engineering services outsourcing market by services, 2018 - 2030 (USD Billion)
Fig. 26 U.S. engineering services outsourcing market by location, 2018 - 2030 (USD Billion)
Fig. 27 U.S. engineering services outsourcing market by application, 2018 - 2030 (USD Billion)
Fig. 28 Canada engineering services outsourcing market by services, 2018 - 2030 (USD Billion)
Fig. 29 Canada engineering services outsourcing market by location, 2018 - 2030 (USD Billion)
Fig. 30 Canada engineering services outsourcing market by application, 2018 - 2030 (USD Billion)
Fig. 31 Mexico engineering services outsourcing market by services, 2018 - 2030 (USD Billion)
Fig. 32 Mexico engineering services outsourcing market by location, 2018 - 2030 (USD Billion)
Fig. 33 Mexico engineering services outsourcing market by application, 2018 - 2030 (USD Billion)
Fig. 34 Europe engineering services outsourcing market - Key takeaways, 2022 & 2030
Fig. 35 Europe engineering services outsourcing market by services, 2018 - 2030 (USD Billion)
Fig. 36 Europe engineering services outsourcing market by location, 2018 - 2030 (USD Billion)
Fig. 37 Europe engineering services outsourcing market by application, 2018 - 2030 (USD Billion)
Fig. 38 U.K. engineering services outsourcing market by services, 2018 - 2030 (USD Billion)
Fig. 39 U.K. engineering services outsourcing market by location, 2018 - 2030 (USD Billion)
Fig. 40 U.K. engineering services outsourcing market by application, 2018 - 2030 (USD Billion)
Fig. 41 Germany engineering services outsourcing market by services, 2018 - 2030 (USD Billion)
Fig. 42 Germany engineering services outsourcing market by location, 2018 - 2030 (USD Billion)
Fig. 43 Germany engineering services outsourcing market by application, 2018 - 2030 (USD Billion)
Fig. 44 France engineering services outsourcing market by services, 2018 - 2030 (USD Billion)
Fig. 45 France engineering services outsourcing market by location, 2018 - 2030 (USD Billion)
Fig. 46 France engineering services outsourcing market by application, 2018 - 2030 (USD Billion)
Fig. 47 Italy engineering services outsourcing market by services, 2018 - 2030 (USD Billion)
Fig. 48 Italy engineering services outsourcing market by location, 2018 - 2030 (USD Billion)
Fig. 49 Italy engineering services outsourcing market by application, 2018 - 2030 (USD Billion)
Fig. 50 Spain engineering services outsourcing market by services, 2018 - 2030 (USD Billion)
Fig. 51 Spain engineering services outsourcing market by location, 2018 - 2030 (USD Billion)
Fig. 52 Spain engineering services outsourcing market by application, 2018 - 2030 (USD Billion)
Fig. 53 Asia Pacific engineering services outsourcing market - Key takeaways, 2022 & 2030
Fig. 54 Asia Pacific engineering services outsourcing market by services, 2018 - 2030 (USD Billion)
Fig. 55 Asia Pacific engineering services outsourcing market by location, 2018 - 2030 (USD Billion)
Fig. 56 Asia Pacific engineering services outsourcing market by application, 2018 - 2030 (USD Billion)
Fig. 57 China engineering services outsourcing market by services, 2018 - 2030 (USD Billion)
Fig. 58 China engineering services outsourcing market by location, 2018 - 2030 (USD Billion)
Fig. 59 China engineering services outsourcing market by application, 2018 - 2030 (USD Billion)
Fig. 60 India engineering services outsourcing market by services, 2018 - 2030 (USD Billion)
Fig. 61 India engineering services outsourcing market by location, 2018 - 2030 (USD Billion)
Fig. 62 India engineering services outsourcing market by application, 2018 - 2030 (USD Billion)
Fig. 63 Japan engineering services outsourcing market by services, 2018 - 2030 (USD Billion)
Fig. 64 Japan engineering services outsourcing market by location, 2018 - 2030 (USD Billion)
Fig. 65 Japan engineering services outsourcing market by application, 2018 - 2030 (USD Billion)
Fig. 66 South Korea engineering services outsourcing market by services, 2018 - 2030 (USD Billion)
Fig. 67 South Korea engineering services outsourcing market by location, 2018 - 2030 (USD Billion)
Fig. 68 South Korea engineering services outsourcing market by application, 2018 - 2030 (USD Billion)
Fig. 69 Australia engineering services outsourcing market by services, 2018 - 2030 (USD Billion)
Fig. 70 Australia engineering services outsourcing market by location, 2018 - 2030 (USD Billion)
Fig. 71 Australia engineering services outsourcing market by application, 2018 - 2030 (USD Billion)
Fig. 72 Indonesia engineering services outsourcing market by services, 2018 - 2030 (USD Billion)
Fig. 73 Indonesia engineering services outsourcing market by location, 2018 - 2030 (USD Billion)
Fig. 74 Indonesia engineering services outsourcing market by application, 2018 - 2030 (USD Billion)
Fig. 75 Philippines engineering services outsourcing market by services, 2018 - 2030 (USD Billion)
Fig. 76 Philippines engineering services outsourcing market by location, 2018 - 2030 (USD Billion)
Fig. 77 Philippines engineering services outsourcing market by application, 2018 - 2030 (USD Billion)
Fig. 78 South America engineering services outsourcing market - Key takeaways, 2022 & 2030
Fig. 79 South America engineering services outsourcing market by services, 2018 - 2030 (USD Billion)
Fig. 80 South America engineering services outsourcing market by location, 2018 - 2030 (USD Billion)
Fig. 81 South America engineering services outsourcing market by application, 2018 - 2030 (USD Billion)
Fig. 82 Brazil engineering services outsourcing market by services, 2018 - 2030 (USD Billion)
Fig. 83 Brazil engineering services outsourcing market by location, 2018 - 2030 (USD Billion)
Fig. 84 Brazil engineering services outsourcing market by application, 2018 - 2030 (USD Billion)
Fig. 85 Argentina engineering services outsourcing market by services, 2018 - 2030 (USD Billion)
Fig. 86 Argentina engineering services outsourcing market by location, 2018 - 2030 (USD Billion)
Fig. 87 Argentina engineering services outsourcing market by application, 2018 - 2030 (USD Billion)
Fig. 88 MEA engineering services outsourcing market - Key takeaways, 2022 & 2030
Fig. 89 MEA engineering services outsourcing market by services, 2018 - 2030 (USD Billion)
Fig. 90 MEA engineering services outsourcing market by location, 2018 - 2030 (USD Billion)
Fig. 91 MEA engineering services outsourcing market by application, 2018 - 2030 (USD Billion)
Fig. 92 UAE engineering services outsourcing market by services, 2018 - 2030 (USD Billion)
Fig. 93 UAE engineering services outsourcing market by location, 2018 - 2030 (USD Billion)
Fig. 94 UAE engineering services outsourcing market by application, 2018 - 2030 (USD Billion)
Fig. 95 Saudi Arabia engineering services outsourcing market by services, 2018 - 2030 (USD Billion)
Fig. 96 Saudi Arabia engineering services outsourcing market by location, 2018 - 2030 (USD Billion)
Fig. 97 Saudi Arabia engineering services outsourcing market by application, 2018 - 2030 (USD Billion)
Fig. 98 South Africa engineering services outsourcing market by services, 2018 - 2030 (USD Billion)
Fig. 99 South Africa engineering services outsourcing market by location, 2018 - 2030 (USD Billion)
Fig. 100 South Africa engineering services outsourcing market by application, 2018 - 2030 (USD Billion)
Fig. 110 Key company ranking analysis, 2022

What questions do you have? Get quick response from our industry experts. Request a Free Consultation

Market Segmentation

  • ESO Service Outlook (Revenue, USD Billion, 2018 - 2030)
    • Designing
    • Prototyping
    • System Integration
    • Testing
    • Others
  • ESO Location Outlook (Revenue, USD Billion, 2018 - 2030)
    • On-shore
    • Off-shore
  • ESO Application Outlook (Revenue, USD Billion, 2018 - 2030)
    • Aerospace
    • Automotive
    • Manufacturing
    • Consumer Electronics
    • Semiconductors
    • Healthcare
    • Telecom
    • Energy & Utilities
    • Construction & Infrastructure
    • Others
  • ESO Regional Outlook (Revenue, USD Billion, 2018 - 2030)
    • North America
      • North America ESO Market, By Service
        • Designing
        • Prototyping
        • System Integration
        • Testing
        • Others
      • North America ESO Market, By Location
        • On-shore
        • Off-shore
      • North America ESO Market, By Application
        • Aerospace
        • Automotive
        • Manufacturing
        • Consumer Electronics
        • Semiconductors
        • Healthcare
        • Telecom
        • Energy & Utilities
        • Construction & Infrastructure
        • Others
      • U.S.
        • U.S. ESO Market, By Service
          • Designing
          • Prototyping
          • System Integration
          • Testing
          • Others
        • U.S. ESO Market, By Location
          • On-shore
          • Off-shore
        • U.S. ESO Market, By Application
          • Aerospace
          • Automotive
          • Manufacturing
          • Consumer Electronics
          • Semiconductors
          • Healthcare
          • Telecom
          • Energy & Utilities
          • Construction & Infrastructure
          • Others
      • Canada
        • Canada ESO Market, By Service
          • Designing
          • Prototyping
          • System Integration
          • Testing
          • Others
        • Canada ESO Market, By Location
          • On-shore
          • Off-shore
        • Canada ESO Market, By Application
          • Aerospace
          • Automotive
          • Manufacturing
          • Consumer Electronics
          • Semiconductors
          • Healthcare
          • Telecom
          • Energy & Utilities
          • Construction & Infrastructure
          • Others
      • Mexico
        • Mexico ESO Market, By Service
          • Designing
          • Prototyping
          • System Integration
          • Testing
          • Others
        • Mexico ESO Market, By Location
          • On-shore
          • Off-shore
        • Mexico ESO Market, By Application
          • Aerospace
          • Automotive
          • Manufacturing
          • Consumer Electronics
          • Semiconductors
          • Healthcare
          • Telecom
          • Energy & Utilities
          • Construction & Infrastructure
          • Others
    • Europe
      • Europe ESO Market, By Service
        • Designing
        • Prototyping
        • System Integration
        • Testing
        • Others
      • Europe ESO Market, By Location
        • On-shore
        • Off-shore
      • Europe ESO Market, By Application
        • Aerospace
        • Automotive
        • Manufacturing
        • Consumer Electronics
        • Semiconductors
        • Healthcare
        • Telecom
        • Energy & Utilities
        • Construction & Infrastructure
        • Others
      • U.K.
        • U.K. ESO Market, By Service
          • Designing
          • Prototyping
          • System Integration
          • Testing
          • Others
        • U.K. ESO Market, By Location
          • On-shore
          • Off-shore
        • U.K. ESO Market, By Application
          • Aerospace
          • Automotive
          • Manufacturing
          • Consumer Electronics
          • Semiconductors
          • Healthcare
          • Telecom
          • Energy & Utilities
          • Construction & Infrastructure
          • Others
      • Germany
        • Germany ESO Market, By Service
          • Designing
          • Prototyping
          • System Integration
          • Testing
          • Others
        • Germany ESO Market, By Location
          • On-shore
          • Off-shore
        • Germany ESO Market, By Application
          • Aerospace
          • Automotive
          • Manufacturing
          • Consumer Electronics
          • Semiconductors
          • Healthcare
          • Telecom
          • Energy & Utilities
          • Construction & Infrastructure
          • Others
      • France
        • France ESO Market, By Service
          • Designing
          • Prototyping
          • System Integration
          • Testing
          • Others
        • France ESO Market, By Location
          • On-shore
          • Off-shore
        • France ESO Market, By Application
          • Aerospace
          • Automotive
          • Manufacturing
          • Consumer Electronics
          • Semiconductors
          • Healthcare
          • Telecom
          • Energy & Utilities
          • Construction & Infrastructure
          • Others
      • Italy
        • Italy ESO Market, By Service
          • Designing
          • Prototyping
          • System Integration
          • Testing
          • Others
        • Italy ESO Market, By Location
          • On-shore
          • Off-shore
        • Italy ESO Market, By Application
          • Aerospace
          • Automotive
          • Manufacturing
          • Consumer Electronics
          • Semiconductors
          • Healthcare
          • Telecom
          • Energy & Utilities
          • Construction & Infrastructure
          • Others
      • Spain
        • Spain ESO Market, By Service
          • Designing
          • Prototyping
          • System Integration
          • Testing
          • Others
        • Spain ESO Market, By Location
          • On-shore
          • Off-shore
        • Spain ESO Market, By Application
          • Aerospace
          • Automotive
          • Manufacturing
          • Consumer Electronics
          • Semiconductors
          • Healthcare
          • Telecom
          • Energy & Utilities
          • Construction & Infrastructure
          • Others
    • Asia Pacific
      • Asia Pacific ESO Market, By Service
        • Designing
        • Prototyping
        • System Integration
        • Testing
        • Others
      • Asia Pacific ESO Market, By Location
        • On-shore
        • Off-shore
      • Asia Pacific ESO Market, By Application
        • Aerospace
        • Automotive
        • Manufacturing
        • Consumer Electronics
        • Semiconductors
        • Healthcare
        • Telecom
        • Energy & Utilities
        • Construction & Infrastructure
        • Others
      • China
        • China ESO Market, By Service
          • Designing
          • Prototyping
          • System Integration
          • Testing
          • Others
        • China ESO Market, By Location
          • On-shore
          • Off-shore
        • China ESO Market, By Application
          • Aerospace
          • Automotive
          • Manufacturing
          • Consumer Electronics
          • Semiconductors
          • Healthcare
          • Telecom
          • Energy & Utilities
          • Construction & Infrastructure
          • Others
      • India
        • India ESO Market, By Service
          • Designing
          • Prototyping
          • System Integration
          • Testing
          • Others
        • India ESO Market, By Location
          • On-shore
          • Off-shore
        • India ESO Market, By Application
          • Aerospace
          • Automotive
          • Manufacturing
          • Consumer Electronics
          • Semiconductors
          • Healthcare
          • Telecom
          • Energy & Utilities
          • Construction & Infrastructure
          • Others
      • Japan
        • Japan ESO Market, By Service
          • Designing
          • Prototyping
          • System Integration
          • Testing
          • Others
        • Japan ESO Market, By Location
          • On-shore
          • Off-shore
        • Japan ESO Market, By Application
          • Aerospace
          • Automotive
          • Manufacturing
          • Consumer Electronics
          • Semiconductors
          • Healthcare
          • Telecom
          • Energy & Utilities
          • Construction & Infrastructure
          • Others
      • South Korea
        • South Korea ESO Market, By Service
          • Designing
          • Prototyping
          • System Integration
          • Testing
          • Others
        • South Korea ESO Market, By Location
          • On-shore
          • Off-shore
        • South Korea ESO Market, By Application
          • Aerospace
          • Automotive
          • Manufacturing
          • Consumer Electronics
          • Semiconductors
          • Healthcare
          • Telecom
          • Energy & Utilities
          • Construction & Infrastructure
          • Others
      • Australia
        • Australia ESO Market, By Service
          • Designing
          • Prototyping
          • System Integration
          • Testing
          • Others
        • Australia ESO Market, By Location
          • On-shore
          • Off-shore
        • Australia ESO Market, By Application
          • Aerospace
          • Automotive
          • Manufacturing
          • Consumer Electronics
          • Semiconductors
          • Healthcare
          • Telecom
          • Energy & Utilities
          • Construction & Infrastructure
          • Others
      • Indonesia
        • Indonesia ESO Market, By Service
          • Designing
          • Prototyping
          • System Integration
          • Testing
          • Others
        • Indonesia ESO Market, By Location
          • On-shore
          • Off-shore
        • Indonesia ESO Market, By Application
          • Aerospace
          • Automotive
          • Manufacturing
          • Consumer Electronics
          • Semiconductors
          • Healthcare
          • Telecom
          • Energy & Utilities
          • Construction & Infrastructure
          • Others
      • Philippines
        • Philippines ESO Market, By Service
          • Designing
          • Prototyping
          • System Integration
          • Testing
          • Others
        • Philippines ESO Market, By Location
          • On-shore
          • Off-shore
        • Philippines ESO Market, By Application
          • Aerospace
          • Automotive
          • Manufacturing
          • Consumer Electronics
          • Semiconductors
          • Healthcare
          • Telecom
          • Energy & Utilities
          • Construction & Infrastructure
          • Others
    • South America
      • South America ESO Market, By Service
        • Designing
        • Prototyping
        • System Integration
        • Testing
        • Others
      • South America ESO Market, By Location
        • On-shore
        • Off-shore
      • South America ESO Market, By Application
        • Aerospace
        • Automotive
        • Manufacturing
        • Consumer Electronics
        • Semiconductors
        • Healthcare
        • Telecom
        • Energy & Utilities
        • Construction & Infrastructure
        • Others
      • Brazil
        • Brazil ESO Market, By Service
          • Designing
          • Prototyping
          • System Integration
          • Testing
          • Others
        • Brazil ESO Market, By Location
          • On-shore
          • Off-shore
        • Brazil ESO Market, By Application
          • Aerospace
          • Automotive
          • Manufacturing
          • Consumer Electronics
          • Semiconductors
          • Healthcare
          • Telecom
          • Energy & Utilities
          • Construction & Infrastructure
          • Others
      • Argentina
        • Argentina ESO Market, By Service
          • Designing
          • Prototyping
          • System Integration
          • Testing
          • Others
        • Argentina ESO Market, By Location
          • On-shore
          • Off-shore
        • Argentina ESO Market, By Application
          • Aerospace
          • Automotive
          • Manufacturing
          • Consumer Electronics
          • Semiconductors
          • Healthcare
          • Telecom
          • Energy & Utilities
          • Construction & Infrastructure
          • Others
    • Middle East and Africa (MEA)
      • MEA ESO Market, By Service
        • Designing
        • Prototyping
        • System Integration
        • Testing
        • Others
      • MEA ESO Market, By Location
        • On-shore
        • Off-shore
      • MEA ESO Market, By Application
        • Aerospace
        • Automotive
        • Manufacturing
        • Consumer Electronics
        • Semiconductors
        • Healthcare
        • Telecom
        • Energy & Utilities
        • Construction & Infrastructure
        • Others
      • UAE
        • UAE ESO Market, By Service
          • Designing
          • Prototyping
          • System Integration
          • Testing
          • Others
        • UAE ESO Market, By Location
          • On-shore
          • Off-shore
        • UAE ESO Market, By Application
          • Aerospace
          • Automotive
          • Manufacturing
          • Consumer Electronics
          • Semiconductors
          • Healthcare
          • Telecom
          • Energy & Utilities
          • Construction & Infrastructure
          • Others
      • Saudi Arabia
        • Saudi Arabia ESO Market, By Service
          • Designing
          • Prototyping
          • System Integration
          • Testing
          • Others
        • Saudi Arabia ESO Market, By Location
          • On-shore
          • Off-shore
        • Saudi Arabia ESO Market, By Application
          • Aerospace
          • Automotive
          • Manufacturing
          • Consumer Electronics
          • Semiconductors
          • Healthcare
          • Telecom
          • Energy & Utilities
          • Construction & Infrastructure
          • Others
      • South Africa
        • South Africa ESO Market, By Service
          • Designing
          • Prototyping
          • System Integration
          • Testing
          • Others
        • South Africa ESO Market, By Location
          • On-shore
          • Off-shore
        • South Africa ESO Market, By Application
          • Aerospace
          • Automotive
          • Manufacturing
          • Consumer Electronics
          • Semiconductors
          • Healthcare
          • Telecom
          • Energy & Utilities
          • Construction & Infrastructure
          • Others

Engineering Services Outsourcing Market Dynamics

Increased tie-ups between automotive OEMs and suppliers

Automotive engineering services have undergone significant development due to the rapid orientation of original equipment manufacturers (OEMs) with global mega trends such as improved emphasis on superior performance, safety, fuel efficiency, and self-driving. There is also a greater need for innovation, adherence to high environmental sustainability and safety standards, and the design of automobiles for diverse market segments with shorter time-to-market. In response to these trends, automobile manufacturers worldwide have increased collaborations and partnerships with firms specializing in engineering services. Usually automotive innovation has been concerted around the R&D hubs of tier one suppliers and leading automobile manufacturers, including the largest OEMs making the substantial R&D investment. An automotive development where OEMs lacks the necessary skills set has been observed by the modern model which is not a cost effective to be invested in technologies with lack of relevant skills and abilities. Key ESO providers who invest in the developing technologies are involved in filling these gaps.

Cost reduction pressures

A survey conducted by Accenture found that aerospace and defense (A&D) companies are exploring the option of external engineering services to reduce costs due to growing global competition and post-recession pressure. Vendors are realizing that they can augment their capabilities with resources provided by IT services firms specializing in engineering design, instead of using expensive in-house resources.  Companies can get the most out of the limited budgets and surge concentration on more crucial matters due to outsourcing engineering services. In addition, the companies can be aided by outsourcing towards saving the employee training expenses that consume excess of trainer cost, material cost as well as the opportunity cost.

Market restraint analysis

Intellectual Property (IP) confidentiality and security threats

From a legal perspective, Intellectual Property (IP) encompasses patents, trademarks, copyrights, and trade secrets. When companies outsource their R&D to engineering firms, they must take several precautions to protect their IP, such as:

  • Inspecting security procedures,

  • Securing networks,

  • Understanding the legal system of involved countries,

  • Ensuring the contracted company is liable for its employees' actions.

Maintaining an original copy of the IP is also crucial to prevent theft, as prosecuting firms for IP misuse in some offshore locations can be challenging, potentially leading to significant losses.

What Does This Report Include?

This section will provide insights into the contents included in this engineering services outsourcing market report and help gain clarity on the structure of the report to assist readers in navigating smoothly.

Engineering services outsourcing market qualitative analysis

  • Industry overview

  • Industry trends

  • Market drivers and restraints

  • Market size

  • Growth prospects

  • Porter’s analysis

  • PESTEL analysis

  • Key market opportunities prioritized

  • Competitive landscape

    • Company overview

    • Financial performance

    • Product benchmarking

    • Latest strategic developments

Engineering services outsourcing market quantitative analysis

  • Market size, estimates, and forecast from 2018 to 2030

  • Market estimates and forecast for product segments up to 2030

  • Regional market size and forecast for product segments up to 2030

  • Market estimates and forecast for application segments up to 2030

  • Regional market size and forecast for application segments up to 2030

  • Company financial performance

What questions do you have? Get quick response from our industry experts. Request a Free Consultation

Research Methodology

A three-pronged approach was followed for deducing the engineering services outsourcing market estimates and forecasts. The process has three steps: information procurement, analysis, and validation. The whole process is cyclical, and steps repeat until the estimates are validated. The three steps are explained in detail below:

Information procurement: Information procurement is one of the most extensive and important stages in our research process, and quality data is critical for accurate analysis. We followed a multi-channel data collection process for engineering services outsourcing market to gather the most reliable and current information possible.

  • We buy access to paid databases such as Hoover’s and Factiva for company financials, industry information, white papers, industry journals, SME journals, and more.
  • We tap into Grand View’s proprietary database of data points and insights from active and archived monitoring and reporting.
  • We conduct primary research with industry experts through questionnaires and one-on-one phone interviews.
  • We pull from reliable secondary sources such as white papers and government statistics, published by organizations like WHO, NGOs, World Bank, etc., Key Opinion Leaders (KoL) publications, company filings, investor documents, and more.
  • We purchase and review investor analyst reports, broker reports, academic commentary, government quotes, and wealth management publications for insightful third-party perspectives.

Analysis: We mine the data collected to establish baselines for forecasting, identify trends and opportunities, gain insight into consumer demographics and drivers, and so much more. We utilized different methods of engineering services outsourcing market data depending on the type of information we’re trying to uncover in our research.

  • Market Research Efforts: Bottom-up Approach for estimating and forecasting demand size and opportunity, top-down Approach for new product forecasting and penetration, and combined approach of both Bottom-up and Top-down for full coverage analysis.

  • Value-Chain-Based Sizing & Forecasting: Supply-side estimates for understanding potential revenue through competitive benchmarking, forecasting, and penetration modeling.

  • Demand-side estimates for identifying parent and ancillary markets, segment modeling, and heuristic forecasting.

  • Qualitative Functional Deployment (QFD) Modelling for market share assessment.

Market formulation and validation: We mine the data collected to establish baselines for forecasting, identify trends and opportunities, gain insight into consumer demographics and drivers, and so much more. We utilize different methods of data analysis depending on the type of information we’re trying to uncover in our research.

  • Market Formulation: This step involves the finalization of market numbers. This step on an internal level is designed to manage outputs from the Data Analysis step.

  • Data Normalization: The final market estimates and forecasts are then aligned and sent to industry experts, in-panel quality control managers for validation.

  • This step also entails the finalization of the report scope and data representation pattern.

  • Validation: The process entails multiple levels of validation. All these steps run in parallel, and the study is forwarded for publishing only if all three levels render validated results.

Engineering Services Outsourcing Market Categorization:

The engineering services outsourcing market was categorized into four segments, namely service (Designing, Prototyping, System Integration, Testing), location (On-shore, Off-shore), application (Aerospace, Automotive, Industrial, Consumer Electronics, Semiconductors, Healthcare, Telecom), and regions (North America, Europe, Asia Pacific, South America, Middle East & Africa).

Segment Market Methodology:

The engineering services outsourcing market was segmented into service, location, application, and regions. The demand at a segment level was deduced using a funnel method. Concepts like the TAM, SAM, SOM, etc., were put into practice to understand the demand. We at GVR deploy three methods to deduce market estimates and determine forecasts. These methods are explained below:

Market research approaches: Bottom-up

  • Demand estimation of each product across countries/regions summed up to from the total market.

  • Variable analysis for demand forecast.

  • Demand estimation via analyzing paid database, and company financials either via annual reports or paid database.

  • Primary interviews for data revalidation and insight collection.

Market research approaches: Top-down

  • Used extensively for new product forecasting or analyzing penetration levels.

  • Tool used invoice product flow and penetration models Use of regression multi-variant analysis for forecasting Involves extensive use of paid and public databases.

  • Primary interviews and vendor-based primary research for variable impact analysis.

Market research approaches: Combined

  • This is the most common method. We apply concepts from both the top-down and bottom-up approaches to arrive at a viable conclusion.

Regional Market Methodology:

The engineering services outsourcing market was analyzed at a regional level. The globe was divided into North America, Europe, Asia Pacific, South America, and Middle East & Africa, keeping in focus variables like consumption patterns, export-import regulations, consumer expectations, etc. These regions were further divided into ten countries, namely, the U.S.; Canada; Mexico; the UK.; Germany; France; China; Japan; India; Brazil.

All three above-mentioned market research methodologies were applied to arrive at regional-level conclusions. The regions were then summed up to form the global market.

Engineering services outsourcing market companies & financials:

The engineering services outsourcing market was analyzed via companies operating in the sector. Analyzing these companies and cross-referencing them to the demand equation helped us validate our assumptions and conclusions. Key market players analyzed include:

  • Alten GmbH - The ALTEN Group, established in 1988 and headquartered in Munich, Germany, is a leading provider of technology consulting and engineering services in Europe. Alten GmbH, based in Coburg, Germany, operates as a subsidiary of Alten SA. The company has a presence at 22 locations in Germany and offers integrated IT security solutions. Key services provided by the company include electrical/electronic hardware/software, mechanical design, production and process planning, quality management and project management (3P) for original equipment manufacturers (OEMs) in various industries ALTEN GmbH specializes in providing engineering services to key industries such as automotive, power engineering, semiconductors, aerospace, medical technology, and telecommunications. The company employs around 24,000 employees globally and has branches in Spain, Brazil, France, and the Benelux region.

  • HCL Technologies - HCL Technologies Pvt. Ltd. is an Indian multinational information technology (IT) consulting company headquartered in Noida, Uttar Pradesh, India. It provides IT and engineering services and solutions, including ER&D services, custom application services, business services, enterprise application services, enterprise transformation services, IT infrastructure and management services, and Gen 2.0 outsourcing. HCL’s Engineering Services unit engages in the development of engineering products, solutions, and platforms across various industries, including office automation, networking and telecom, medical devices, industrial manufacturing, consumer electronics, software, online, aerospace and defense, servers and storage for customers and semiconductors. HCL's engineering and R&D services business unit offers a wide array of solutions, including application test factory, electronic device automation testing, intelligent sustenance engineering, intelligent tech support, interactive electronic technical manuals, platform acceleration suite, product intelligence, and value analysis/value engineering.

  • Infosys Ltd. - Infosys is a global company that provides consulting, technology, and outsourcing solutions. Established in 1981, the company is headquartered in Bangalore, India, and has a global presence with offices and development centers worldwide. Infosys caters to more than 30 countries and provides strategic insights through consulting, operation leadership, and co-creation of solutions across mobility, big data, sustainability, and cloud computing. As of 2018, the company had 82 sales and marketing offices and 123 development centers across the world, with major locations in the United States, China, Australia, Japan, the Middle East, and Europe.

  • Tata Elxsi -A subsidiary of the Tata Group, Tata Elxsi is an India-based company headquartered in Bangalore, Karnataka. The company combines engineering, technology, and creativity to assist customers in translating ideas into solutions and products. Tata Elxsi functions in various sectors, including transportation, semiconductor, media & entertainment, healthcare, defense, consumer products, and communications. The company's operations are divided into four business divisions: embedded product design, industrial design, visual computing labs, and systems integration. Tata Elxsi has offices in the UK, UAE, U.S., South Africa, Singapore, Malaysia, Japan, Germany, France, and Dubai.

  • Tata Consultancy Services - Tata Consultancy Services (TCS) is an Indian multinational company that provides IT services, consultancy, and business solutions to clients across various industries. TCS is headquartered in Mumbai, Maharashtra, and is a part of the Tata Group. The company operates in 150 locations across 46 countries and has over 616,000 employees worldwide as of September 2023. TCS offers a consulting-led, integrated portfolio of engineering, business process services (BPS), infrastructure, IT, and assurance services. The company provides engineering and industrial services in multiple verticals, including aerospace & defense, automotive, life sciences, high tech, telecom, energy, metals & mining, utilities, earth moving & farm equipment, power machinery, retail, consumer packaged goods, and transportation. TCS has alliances with 31 academics, industrial, and technology partners, including Microsoft, Siemens, Intel, IBM, Google, and Automotive Research Association of India (ARAI), among others.

  • Tech Mahindra - Tech Mahindra is an India-based company headquartered in Pune, Maharashtra, which offers innovative customer-centric information technology services and solutions to associates, enterprises and society. Tech Mahindra is a part of the Mahindra Group. The company provides services to 632 global customers which include Fortune 500 companies. The company’s telecom, consulting and enterprise solutions connect across numerous technologies to deliver tangible business value to its stakeholders. Tech Mahindra offers integrated engineering solutions to multiple verticals which include energy & utilities, rail, medical devices, industrial, hi-tech, energy & utilities, aerospace & defense, consumer appliances and automotive. The company offers support for every phase of product development ranging from conceptual design and validation to manufacturing and aftermarket support.

  • Wipro Ltd. - Wipro Ltd. is an India-based information technology (IT), outsourcing and consulting company headquartered in Bangalore, Karnataka. The company’s product engineering solutions help in quick manufacturing through technology expertise in electronics and mechanical engineering, software, industry specific knowledge, partnerships and efficient processes. They help clients to manufacture consumer & retail products such as 3D cinemascope smart TVs, point of sale terminals, smart energy meters and portable dishwashers among others. Additionally, they enable the creation of enterprise/industrial products such as high performance computers, workforce management terminals, industrial grade wireless routers and base station controllers.

  • Furthermore, Wipro delivers custom engineered tele-health solutions, multi-screen TVs, managed printing solutions and automotive telematics & infotainment solutions. Wipro’s product compliance and certification labs help in minimizing post-deployment defects by carrying out rigorous tests on products designed for extreme conditions. Numerous industries benefit from the services provided by Wipro, such as operational real time data monitoring, product lifecycle management, plant visualization and engineering data management. The company serves clients in more than 175 cities across six continents.

  • Altair Engineering, Inc. - Altair Engineering, Inc. is a global technology company that provides software and cloud solutions in the areas of product development, high-performance computing (HPC), and data analytics. It was founded in 1985 and is headquartered in Troy, Michigan, U.S. Altair Engineering GmbH is a subsidiary of Altair Engineering, Inc., and is based in Boblingen, Germany. The company is segmented into three business divisions: Product Design (PD), HyperWorks CAE Software (HW), and PBS Works (PBS). It provides services such as industrial design, product engineering, technical staffing, analytics solutions, and HyperWorks solutions to OEMs and suppliers spread across the automotive, aerospace, defense & government, and consumer product segments. Altair Engineering, Inc. specializes in CAE Simulation and Optimization Technology, Product Engineering and Development, HPC and On-demand Computing, Industrial Design and Product Strategy Consulting, Business and Engineering Analytics Solutions, Technical Staffing Services, and the Internet of Things. It employs more than 2,800 employees and has more than 45 regional offices spread across 24 countries in the U.S., Europe, South America, and Asia. Its key clients include BMW, Fiat, Ford Motor Company, General Motors, Jaguar, Toyota, and Volkswagen.

  • P3 Automotive GmbH - P3 Automotive GmbH is a subsidiary of the P3 Group, which was founded in 1996 and is headquartered in Aachen, Germany. The P3 Group has around 3,000 employees worldwide and serves OEMs at over 40 locations across 15 countries. P3 Automotive GmbH has more than 900 employees globally and offers consulting services such as process optimization, strategy consulting, technology consulting services, and quality management. The company also provides management support services, including configuration, cost and complexity management services, and engineering solutions for use in the automotive market. P3 Automotive GmbH tests the entire electronics systems in Germany, U.S., Europe, Asia, Mexico, and other global centers.

  • Gigatronik - Gigatronik, founded in 2001, is a German company headquartered in Stuttgart, specializing in IT and electronics. The company provides domain-specific services to the automotive sector and has expanded its business to other industries such as construction machinery, agriculture, air and rail, electromobility, mobile work machines, medical technology, and building technology. In 2009, Gigatronik and Audi Electronics Venture GmbH formed a joint venture, establishing Fahrfahrksysteme GmbH (EFS), an electronic company that develops system software for chassis electronics for Volkswagen and AUDI AG. In 2015, an innovation and development center (IEZ) was established at Gaimersheim, which serves as the joint headquarter for Gigatronik and Fahrfahrksysteme GmbH. The company has been organized under two divisions: embedded solutions and IT solutions. In March 2017, AKKA Technologies, a key engineering and technology consulting provider in the mobility domain, acquired Gigatronik. The acquisition gave AKKA a new dimension in Germany, where it now generates €500 million in revenue, consolidating its position as a leading multi-segment engineering consulting firm. Gigatronik employs 1,000 people across 14 sites in Germany, Austria, and Switzerland, and reported total revenue of €119 million in 2016

Value chain-based sizing & forecasting

Supply Side Estimates

  • Company revenue estimation via referring to annual reports, investor presentations, and Hoover’s.

  • Segment revenue determination via variable analysis and penetration modeling.

  • Competitive benchmarking to identify market leaders and their collective revenue shares.

  • Forecasting via analyzing commercialization rates, pipelines, market initiatives, distribution networks, etc.

Demand side estimates

  • Identifying parent markets and ancillary markets

  • Segment penetration analysis to obtain pertinent

  • revenue/volume

  • Heuristic forecasting with the help of subject matter experts

  • Forecasting via variable analysis

Engineering Services Outsourcing Market Report Objectives:

  • Understanding market dynamics (in terms of drivers, restraints, & opportunities) in the countries.

  • Understanding trends & variables in the individual countries & their impact on growth and using analytical tools to provide high-level insights into the market dynamics and the associated growth pattern.

  • Understanding market estimates and forecasts (with the base year as 2021, historic information from 2018 to 2020, and forecast from 2022 to 2030). Regional estimates & forecasts for each category are available and are summed up to form the global market estimates.

Engineering Services Outsourcing Market Report Assumptions:

  • The report provides market value for the base year 2022 and a yearly forecast till 2030 in terms of revenue/volume or both. The market for each of the segment outlooks has been provided on region & country basis for the above-mentioned forecast period.

  • The key industry dynamics, major technological trends, and application markets are evaluated to understand their impact on the demand for the forecast period. The growth rates were estimated using correlation, regression, and time-series analysis.

  • We have used the bottom-up approach for market sizing, analyzing key regional markets, dynamics, & trends for various products and end-users. The total market has been estimated by integrating the country markets.

  • All market estimates and forecasts have been validated through primary interviews with the key industry participants.

  • Inflation has not been accounted for to estimate and forecast the market.

  • Numbers may not add up due to rounding off.

  • Europe consists of EU-8, Central & Eastern Europe, along with the Commonwealth of Independent States (CIS).

  • Asia Pacific includes South Asia, East Asia, Southeast Asia, and Oceania (Australia & New Zealand).

  • Latin America includes Central American countries and the South American continent

  • Middle East includes Western Asia (as assigned by the UN Statistics Division) and the African continent.

Primary Research

GVR strives to procure the latest and unique information for reports directly from industry experts, which gives it a competitive edge. Quality is of utmost importance to us, therefore every year we focus on increasing our experts’ panel. Primary interviews are one of the critical steps in identifying recent market trends and scenarios. This process enables us to justify and validate our market estimates and forecasts to our clients. With more than 8,000 reports in our database, we have connected with some key opinion leaders across various domains, including healthcare, technology, consumer goods, and the chemical sector. Our process starts with identifying the right platform for a particular type of report, i.e., emails, LinkedIn, seminars, or telephonic conversation, as every report is unique and requires a differentiated approach.

We send out questionnaires to different experts from various regions/ countries, which is dependent on the following factors:

  • Report/Market scope: If the market study is global, we send questionnaires to industry experts across various regions, including North America, Europe, Asia Pacific, Latin America, and MEA.

  • Market Penetration: If the market is driven by technological advancements, population density, disease prevalence, or other factors, we identify experts and send out questionnaires based on region or country dominance.

The time to start receiving responses from industry experts varies based on how niche or well-penetrated the market is. Our reports include a detailed chapter on the KoL opinion section, which helps our clients understand the perspective of experts already in the market space.

What questions do you have? Get quick response from our industry experts. Request a Free Consultation
gvr icn

GET A FREE SAMPLE

gvr icn

This FREE sample includes data points, ranging from trend analyses to estimates and forecasts. See for yourself.

gvr icn

NEED A CUSTOM REPORT?

We can customize every report - free of charge - including purchasing stand-alone sections or country-level reports, as well as offer affordable discounts for start-ups & universities. Contact us now

Certified Icon

We are GDPR and CCPA compliant! Your transaction & personal information is safe and secure. For more details, please read our privacy policy.