- Home
- »
- Next Generation Technologies
- »
-
In-app Purchase Market Size, Share & Growth Report, 2030GVR Report cover
![In-app Purchase Market Size, Share & Trends Report]()
In-app Purchase Market (2023 - 2030) Size, Share & Trends Analysis Report By Operating System (Android, iOS), By Type (Consumable, Non-Consumable, Auto-Renewable Subscription, Non-Renewing Subscriptions), By Application, By Region, And Segment Forecasts
- Report ID: GVR-4-68040-165-2
- Number of Report Pages: 150
- Format: PDF
- Historical Range: 2018 - 2021
- Forecast Period: 2023 - 2030
- Industry: Technology
- Report Summary
- Table of Contents
- Interactive Charts
- Methodology
- Download FREE Sample
-
Download Sample Report
In-app Purchase Market Summary
The global in-app purchase market size was estimated at USD 166.85 billion in 2022 and is projected to reach USD 449.90 billion by 2030, growing at a CAGR of 12.9% from 2023 to 2030. The market growth can be attributed to the increase in the downloads of video streaming, gaming, and health and fitness applications.
Key Market Trends & Insights
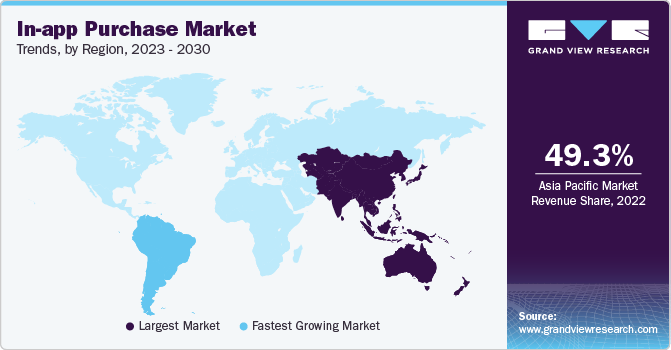
- Asia Pacific accounted for a significant market share of 49.3% in 2022.
- Latin America is anticipated to grow at a CAGR of over 16.0% during the forecast period.
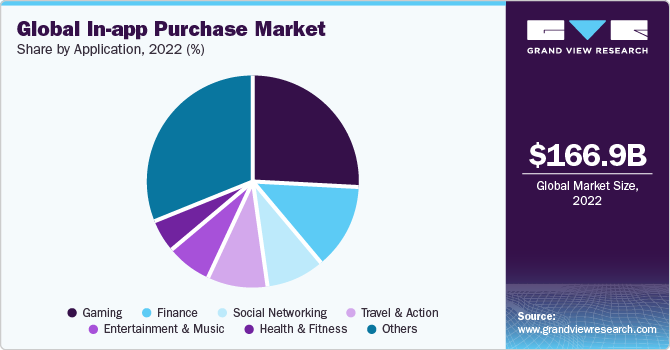
- Based on application, the gaming segment accounted for the largest market share in 2022.
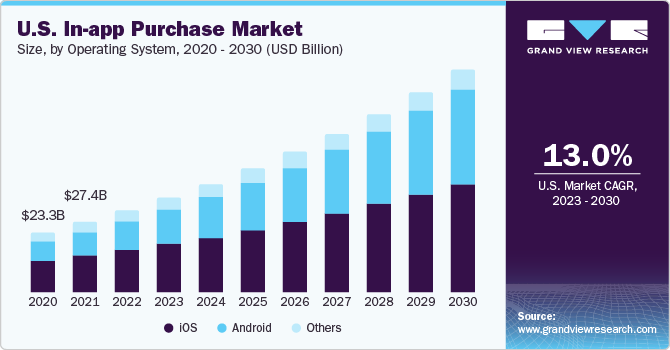
- In terms of operating system, the iOS segment accounted for a significant market share in 2022.
- On the basis of operating system, the Android segment is anticipated to grow at a CAGR of over 15.0% during the forecast period.
Market Size & Forecast
- 2022 Market Size: USD 166.85 billion
- 2030 Projected Market Size: USD 449.90 billion
- CAGR (2023-2030): 12.9%
- Asia Pacific: Largest market in 2022
Further, key market players operating in in-app purchases (IAP) are focusing on developing advanced technological solutions to meet consumer demand. For instance, in April 2022, Google LLC, a technology company, launched a new billing system, to force developers to use the company’s own payment system for in-app purchases. The updates redirect users to buy premium subscriptions from the company’s site or alternative sources. These factors would further drive the market during the forecast period.

Emerging technologies such as Artificial Intelligence (AI) and machine learning aid companies in analyzing customer behavior and purchase pattern through different analytics. AI and related technologies are rapidly adopted in various industry verticals to optimize their most essential aspects. Furthermore, machine learning and AI technologies have the potential to change the loyalty industry. This ability of AI allows businesses to offer personalized products and services to their customers. For instance, HSBC Holding, U.K. based company, leveraged AI to offer reward points for customers aligned with their purchase behavior. This predictive analysis is used to attract customers to augment user experience, which in turn is expected to boost the demand for the market in the forecast period.
Concerns over the collection and potential use of personal data by websites are emerging as one of the factors potentially restraining the growth of the market. It can particularly include the entire history of interactions with customers, responses from customers, changes in purchase decisions, outright defections, acquisitions, credit defaults. Hence, government bodies worldwide have introduced various regulations as part of the efforts to arrest the number of data breach events. Having realized that cloud-based deployment would emerge as the most preferred mode of deployment for e-commerce businesses, several governments have particularly put in place stringent regulatory frameworks to ensure the protection of privacy and security of data stored on the cloud.
The growing demand for real-time analytics presents a significant opportunity for the market. Businesses across several industry verticals are recognizing the value of immediate insights and actionable data to drive their decision-making processes. Real-time analytics solutions allow businesses to monitor and track app performance, engagement metrics, and user behavior. It enables businesses to make timely interventions and streamline app experiences. Further, real-time analytics also provides organizations with a competitive advantage by allowing them to respond quickly to changing consumer needs and market trends.
Application Insights
The gaming segment accounted for largest market share in 2022. Mobile gaming has become a global phenomenon, with billions of people playing games on their smartphones and tablets. Since the popularity of mobile gaming has expanded, game creators have discovered new ways to commercialize their products. People across the world are using smartphones and installing various gaming applications for personal and professional purposes, based on their age, gender, and other demographic factors. In-app purchases provide players with the chance to get virtual goods and services within the game, such as premium content, power-ups, and extra lives.

The health & fitness segment is expected to grow at a CAGR of more than 15.0% during the forecast period. In-app purchases are gaining importance in the health & fitness sector owing to the growing need to establish and maintain brand reputation & brand equity and improve customer loyalty. Companies are operating in the sector partnering with loyalty management companies to improve their relations with customers. For instance, in June 2022, Rexall Pharmacy Group partnered with loyalty solution provider, Exchange Solutions, to provide personalized offers and rewards & incentives programs to Be Well members in the Be Well app. These opportunities in the health & fitness sector would further drive the demand for in-app purchases during the forecast period.
Operating System Insights
The iOS segment dominated accounted for significant market share in 2022. With iOS operating system, in-app purchases provide better user experience, as they do not obstruct the user’s application use with advertisements. Further, with iOS, StoreKit enables the purchase of digital products or services in user’s apps across all Apple, Inc. platforms, which allows them to play, game, read, and other activities. Moreover, it enables the user to provide a consistent experience that allows users to manage or cancel subscriptions without leaving the app.
The Android segment is anticipated to grow at a CAGR of over 15.0% during the forecast period. It is a system that allows the user’s application's users to sell digital products and content. Google Play supports the implementation of in-app purchases in Android applications via the Google Play in-app billing API and the play console. Further, the operating system allows connection with the Google Play Services layer, which provides the product offering available to each user in their application, and methods for managing other required user tasks, such as beginning the purchase flow.
Regional Insights
Asia Pacific accounted for significant market share 49.3% in 2022, with the U.S. at the forefront. The growth of internet usage and the continued growth of retail, consumer goods and e-commerce in countries, such as Japan, India, and China are expected to drive the growth of the in-app purchase market in Asia Pacific. In addition, advanced in-app purchase solutions can be available at an affordable price, which drives their demand among consumers in various industries such as hospitality, tourism, retail, and consumer goods. Further, the acceleration of digitalization across Asia Pacific is encouraging brands and retailers to adopt advanced loyalty programs, supporting the industry trend.

Latin America is anticipated to grow at a CAGR of over 16.0% during the forecast period. The rising integration of advanced solutions to monitor & track consumer behavior and improve customer engagement is anticipated to drive the growth of the Latin American market over the forecast period. As the competition rivalry intensifies, the adoption of customer loyalty programs to retain existing customers and attract new ones increases significantly for greater customer satisfaction and enhanced brand loyalty. Furthermore, the proliferation of various digital payment options to improve consumers' experience is anticipated to create a positive outlook for the market in Latin America.
Type Insights
The auto-renewable segment accounted for highest market share in 2022. Auto-renewable subscriptions enable continued access to services, content, and premium features in the users’ applications. They automatically renew at the end of their term unless the user cancels. Members no longer need to remember renewal dates or go through lengthy renewal procedures, providing convenient and uninterrupted service. These subscriptions are supported by iOS, iPadOS, macOS, watchOS, and tvOS.
The consumable segment is anticipated to grow at a CAGR of over 15.0% during the forecast period. Consumption can be implemented for products that can be purchased several times. For instance, the user's in-game character may earn more life points or gold money in their inventory. Provisioning the in-app product is the process of dispensing the advantages or impacts of a paid item in your application. Further, user is the in- charge of monitoring and tracking how in-app products are delivered to users.
Key Companies & Market Share Insights
The key players operating in the market include Apple Inc., Disney, King.com Ltd., Netflix, Inc., Roblox Corporation, and Google LLC, among others to broaden their product offering, companies utilize a variety of inorganic growth tactics, such as regular mergers acquisitions, and partnerships.
In September 2023, Roblox Corporation, a gaming platform, introduced new features in its gaming platform, to develop and manage subscriptions. Roblox users who subscribe to the company's advanced premium plans can create and sell 3D products and are allowed to sell more traditional 2D assets that were previously only on the platform's marketplace.
Key In-app Purchase Companies:
- Apple Inc.
- Disney
- Google LLC
- King.com Ltd.
- Netflix, Inc.
- Creative Clicks
- AdMaven
- POCKETGUARD
- PubMatic
- Roblox
- InMobi
- Brainly
- Recurly
- Propeller Ads
- Tango
In-app Purchase Market Report Scope
Report Attribute
Details
Market size value in 2023
USD 192.16 billion
Revenue forecast in 2030
USD 449.90 billion
Growth Rate
CAGR of 12.9% from 2023 to 2030
Base year for estimation
2022
Historical data
2018 - 2021
Forecast period
2023 - 2030
Quantitative units
Revenue in USD Billion and CAGR from 2023 to 2030
Report coverage
Revenue forecast, company ranking, consumer behavior analysis, leading regional games, competitive landscape, growth factors, and trends
Segments covered
Operating system, type, application, region
Regional scope
North America, Europe, Asia Pacific, Latin America, and MEA
Country scope
U.S.; Canada; Germany; UK; France; Italy; Spain; China; Japan; India; South Korea; Brazil; Mexico; UAE; Saudi Arabia; South Africa
Key companies profiled
Apple Inc.; Disney; Google LLC; King.com Ltd.; Netflix, Inc.; Creative Clicks; AdMaven; POCKETGUARD; PubMatic; Roblox; InMobi; Brainly; Recurly; Propeller Ads; and Tango
Customization scope
Free report customization (equivalent up to 8 analyst’s working days) with purchase. Addition or alteration to country, regional & segment scope.
Pricing and purchase options
Avail customized purchase options to meet your exact research needs. Explore purchase options.
Global In-app Purchase Market Report Segmentation
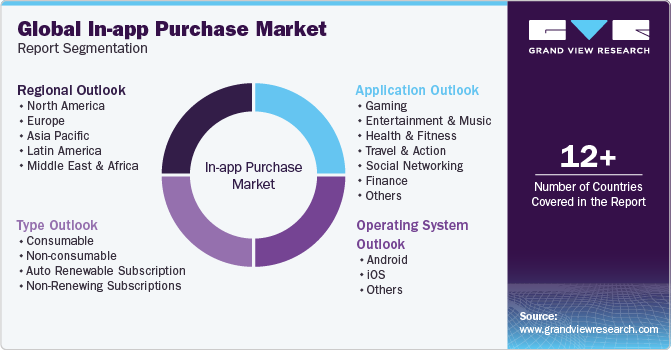
This report forecasts revenue growth at the global, regional, and country levels and provides an analysis of the latest industry trends in each of the sub-segments from 2018 to 2030. For this study, Grand View Research has segmented the global in-app purchase market report based on operating system, type, application, and region:

-
Operating System Outlook (Revenue, USD Billion, 2018 - 2030)
-
Android
-
iOS
-
Others
-
-
Type Outlook (Revenue, USD Billion, 2018 - 2030)
-
Consumable
-
Non-consumable
-
Auto Renewable Subscription
-
Non-Renewing Subscriptions
-
-
Application Outlook (Revenue, USD Billion, 2018 - 2030)
-
Gaming
-
Entertainment & Music
-
Health & Fitness
-
Travel & Action
-
Social Networking
-
Finance
-
Others
-
-
Regional Outlook (Revenue, USD Billion, 2018 - 2030)
-
North America
-
U.S.
-
Canada
-
-
Europe
-
Germany
-
U.K.
-
France
-
Italy
-
Spain
-
-
Asia Pacific
-
China
-
Japan
-
India
-
South Korea
-
-
Latin America
-
Brazil
-
Mexico
-
-
Middle East and Africa
-
UAE
-
Saudi Arabia
-
South Africa
-
-
Frequently Asked Questions About This Report
b. The global in-app purchase market size was estimated at USD 166.85 billion in 2022 and is expected to reach USD 192.16 billion in 2023.
b. The global in-app purchase market is expected to grow at a compound annual growth rate of 12.9% from 2023 to 2030 to reach USD 449.90 billion by 2030.
b. Based on the operating system, the iOS segment dominated the market in 2022 with a share of over 48.9% due to the iOS operating system; in-app purchases provide a better user experience, as they don’t obstruct the user’s application use with advertisements.
b. Some key players operating in the in-app purchase market include Apple Inc., Disney, King.com Ltd., Netflix Inc., Roblox Corporation, and Google LLC, among others.
b. Key factors that are driving the in-app purchase market growth are an increase in the downloads of video streaming, gaming, and health and fitness applications, a rise in the use of various promotional strategies, such as loyalty programs, and a surge in expenditure on digital expenditure.
Share this report with your colleague or friend.
Need a Tailored Report?
Customize this report to your needs — add regions, segments, or data points, with 20% free customization.

ISO 9001:2015 & 27001:2022 Certified
We are GDPR and CCPA compliant! Your transaction & personal information is safe and secure. For more details, please read our privacy policy.
Trusted market insights - try a free sample
See how our reports are structured and why industry leaders rely on Grand View Research. Get a free sample or ask us to tailor this report to your needs.


