- Home
- »
- Renewable Chemicals
- »
-
Levulinic Acid Market Size And Share Report, 2025-2030GVR Report cover
![Levulinic Acid Market (2025 - 2030)Report]()
Levulinic Acid Market (2025 - 2030)
Size, Share & Trends Analysis Report By Process (Acid Hydrolysis), By Application (Plasticizers, Pharmaceuticals, Agriculture, Cosmetics, Food Additive), By Region, And Segment Forecasts
Market Size, 2024
$84.6MMarket Estimate, 2026
$97.0MMarket Forecast, 2030
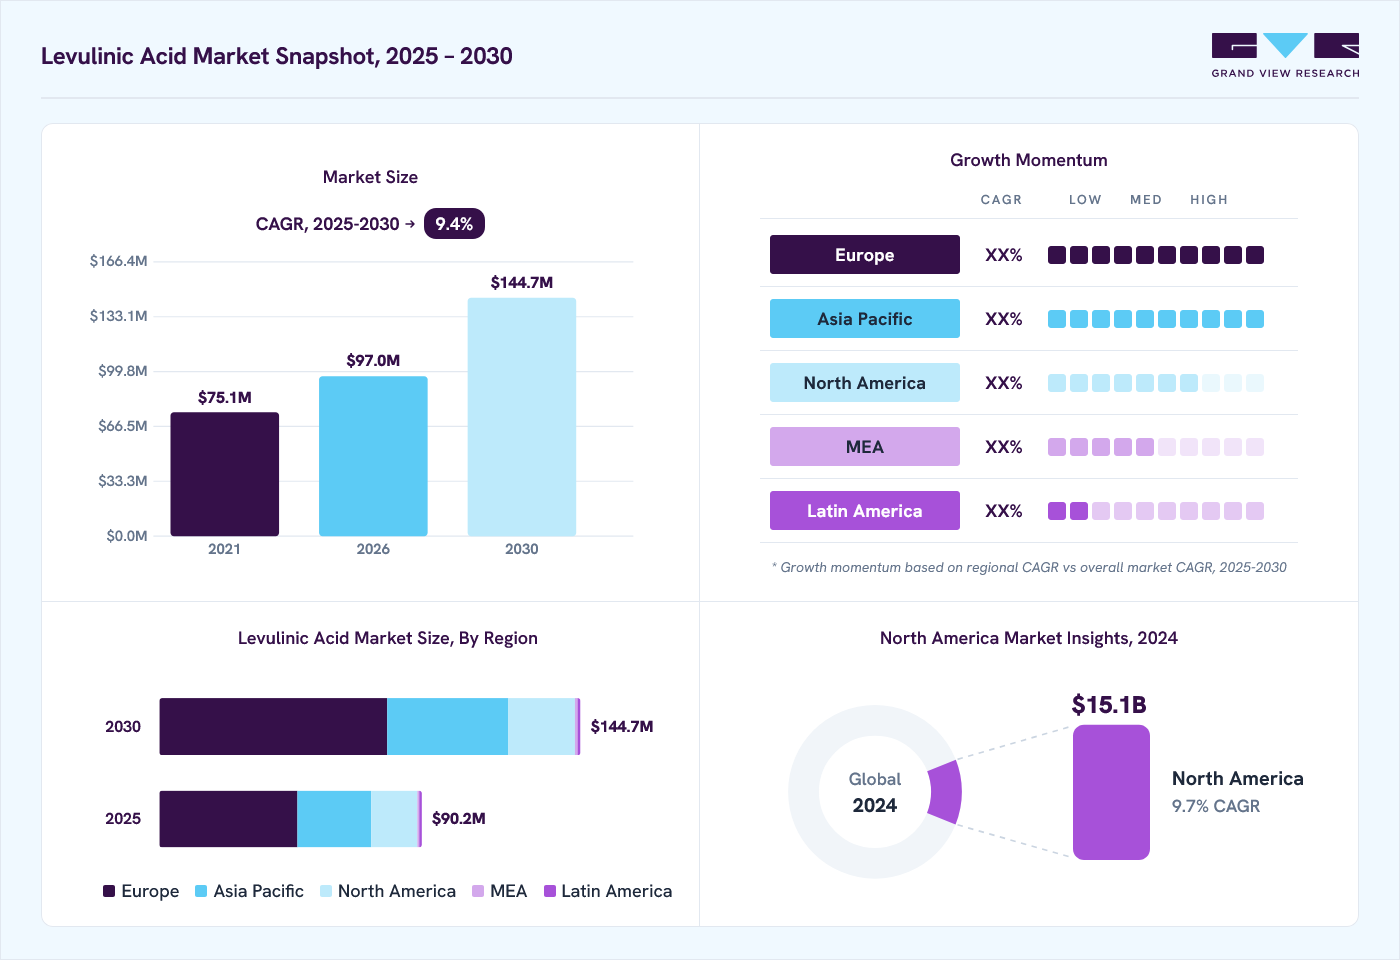
$144.7MCAGR, 2025–2030
9.4%Levulinic Acid Market Summary
The global levulinic acid market size was valued at USD 84.6 million in 2024 and is projected to grow from USD 97.0 million in 2026 to USD 144.7 million by 2030, at a CAGR of 9.4% from 2025 to 2030. Europe dominated the market, accounting for a revenue share of 51.8% in 2024. The market growth is primarily driven by the increasing preference for levulinic acid derivatives over synthetic counterparts due to their superior properties.
Key Market Trends & Insights
- North America levulinic acid market is anticipated to grow at a CAGR of 7.1% from 2024 to 2030.
- By process, the acid hydrolysis process segment accounted for a revenue share of 67.1% in 2023.
- By application, the food additive segment dominated the market in 2023.
Market Size & Forecast
- 2024 Market Size: USD 84.6 Million
- 2030 Projected Market Size: USD 144.7 Million
- CAGR (2025-2030): 9.4%
- North America: Largest market in 2023
Moreover, rising consumer adoption of levulinic acid-containing products is anticipated to fuel market expansion. A key factor contributing to this growth is the emergence of cost-effective levulinic acid production capabilities, particularly in the Asia Pacific and European regions.
")
The push towards renewable chemistry and biotechnology has catalyzed the development of bio-derived products. Among these, levulinic acid has emerged as a pivotal platform chemical. Its versatility is evident in its role as a precursor to a range of specialty chemicals, including fuel additives such as MTHF and pesticides such as DALA and DPA. The relatively straightforward production process of levulinic acid further enhances its market appeal.
Currently, levulinic acid is used for diverse applications across multiple industries. It is prominently utilized in the production of cosmetics, pesticides, and pharmaceuticals. Additionally, it serves as a food additive and finds more limited use in the manufacturing of plastics, synthetic rubbers, and nylons. In the cosmetics market, levulinic acid is incorporated in approximately 98 formulations, and sodium levulinate in approximately 295 products. The maximum reported concentration of levulinic acid is approximately 4.5% in hair dyes, and sodium levulinate at a maximum of 0.62% concentration.
Government policies are increasingly supportive of levulinic acid production, reflecting a broader shift towards environmental sustainability and economic growth. These initiatives align with Europe’s bioeconomy strategy, emphasizing public sector investment, job creation, and circular economy principles.
Process Insights
The acid hydrolysis process segment accounted for a revenue share of 67.1% in 2023 attributed to the efficiency and reliability of the acid hydrolysis process in producing levulinic acid. The process involves the breakdown of cellulose, a complex carbohydrate found in all plant structures, into simpler compounds using an acid catalyst. This method is widely used due to its ability to yield a high volume of levulinic acid, thereby meeting the increasing demand in various industries such as agriculture, pharmaceuticals, and food additives.
The bio-fine process segment is anticipated to grow at a CAGR of 8.1% from 2024 to 2030. The bio-fine process is a newer method that uses biomass as a feedstock to produce levulinic acid. This process is gaining traction due to its eco-friendly nature and the global shift towards sustainable and green chemistry. The significant growth rate indicates that industries are starting to adopt this process, recognizing its potential benefits not only in terms of levulinic acid production but also in contributing to environmental sustainability.
Application Insights
The food additive segment dominated the market in 2023. Levulinic acid is often used as a food additive due to its ability to enhance flavors and act as a preservative. Its dominance in the market can be attributed to the growing demand for processed and convenience foods, where such additives are extensively used. The continuous expansion of food industry, coupled with the consumers’ increasing awareness about food safety and quality, has likely contributed to the significant market share of this segment.
")
The plasticizer application segment is projected to witness the fastest growth from 2024 to 2030. Plasticizers are substances added to materials to increase their plasticity, and levulinic acid serves this purpose effectively. The anticipated rapid growth of this segment can be linked to the increasing demand for flexible PVC (Polyvinyl Chloride) in various applications such as flooring, wall coverings, and wire and cable insulation. Furthermore, the shift towards bio-based plasticizers due to environmental concerns provides a significant growth opportunity for the use of levulinic acid in this segment.
Regional Insights
North American levulinic acid market is anticipated to grow at a CAGR of 7.1% from 2024 to 2030. This growth is driven by increasing consumer demand for sustainable products, technological advancements in production processes, substantial investments in R&D activities, a focus on sustainable packaging solutions, and strategic collaborations among industry players to increase their market share.
U.S. Levulinic Acid Market Trends
The U.S. levulinic acid market dominated North America in 2023 attributed to the advanced technological capabilities, robust industrial infrastructure, and a strong focus on sustainable and bio-based products. Furthermore, the U.S. Department of Agriculture's BioPreferred program has been a pivotal catalyst in shaping the domestic levulinic acid market.
Canada levulinic acid market is expected to grow at the fastest CAGR from 2024 to 2030. The growth of the market in this region is influenced by the rising demand for biofuels to reduce greenhouse emissions, expanding applications of the product across industries such as agrochemicals, food additives, cosmetics, and others, and shifting consumer preferences towards natural products.
Europe Levulinic Acid Market Trends
Europe levulinic acid market dominated with a market share of 52.1% in 2023 driven by supportive government policies, substantial domestic production capacity, readily available feedstocks, and early market adoption of bio-based chemicals.

Italy levulinic acid market held a significant revenue share in Europe in 2023 driven by collaborations and partnerships between industries to enhance their product offerings and production procedures, the growing popularity of these products in cosmetics and personal care products, and a shift towards circular economic practices where waste materials are repurposed into valuable products.
The levulinic acid market in Germany is expected to see significant growth in the coming years due to the increasing focus on bio-based plasticizers, rising investments in R&D for exploring new applications for levulinic acids in various industries and expanding production facilities to meet domestic product demands.
Asia Pacific Levulinic Acid Market Trends
Asia Pacific levulinic acid market is anticipated to grow at a CAGR of 9.8% from 2024 to 2030 driven by the increasing demand for sustainable products and the expansion of various industries that utilize levulinic acid.
China levulinic acid market held a substantial market share in 2023 attributed to increased production capacity, sustainability initiatives leading to the adoption of sustainable practices, growing competition resulting in innovative products with price competitiveness, and international collaborations to improve market share.
The levulinic acid market in India is expected to grow at a significant CAGR over the forecast period. The growth drivers are expected to be the expanding agriculture and agrochemical industries, where levulinic acids have significant applications in fertilizers and pesticides, the growth of the personal care and cosmetics industry impacting the demand for levulinic acids, and international investments and collaborations with local manufacturers to enhance production and expand market reach.
Key Levulinic Acid Company Insights
Some of the key companies in the levulinic acid market include Dupont, Hebei Langfang, Segetis, Jiangsu, and many other companies. Organizations are focusing on increasing customer base to gain a competitive edge in the industry. Therefore, key players are taking several strategic initiatives, such as mergers and acquisitions and partnerships with other major companies.
-
DuPont, a global science and technology company, has a rich history of innovation and is known for its diverse portfolio of products that span multiple industries, including the levulinic acid market. DuPont offers advanced biobased solutions that leverage its expertise in chemical manufacturing and sustainable practices, aiming to provide environmentally friendly alternatives for various applications such as solvents, plasticizers, and biofuels.
-
Segetis is a pioneering company focused on developing sustainable biochemicals, particularly known for its innovative production of levulinic acid, a versatile platform chemical derived from biomass. Their product offerings include not only levulinic acid but also its derivatives, which serve various applications in industries such as food, pharmaceuticals, and biofuels, thereby positioning Segetis as a key player in the growing market for renewable chemicals.
Key Levulinic Acid Companies:
The following are the leading companies in the levulinic acid market. These companies collectively hold the largest market share and dictate industry trends.
- DuPont
- Biofine Technology LLC
- Segetis
- Jiangsu Yancheng China Flavor Chemicals Co. Ltd
- Shanghai Apple Flavor & Fragrance Co. Ltd
- Hebei Langfang Triple Well Chemicals Co. Ltd
- Shijiazhuang Pharmaceutical Group Ouyi Pharmaceutical Co. Ltd
- Hebei Shijiazhuang Worldwide Furfural & Furfuryl Alcohol Furan Resin Co. Ltd.
Recent Developments
-
In May 2022, GFBiochemicals, known for its sustainable chemical solutions based on the biobased levulinic molecule, secured a USD 16.4 million Series A funding round led by Sofinnova Partners.
-
In May 2022, BTC Europe GmbH and NXTLEVVEL Biochem established a partnership to distribute biobased and biodegradable solvents derived from Levulinic Acid throughout Europe. This strategic move aims to strengthen the company's foothold in the European market.
Levulinic Acid Market Report Scope
Report Attribute
Details
Market size in 2024
USD 84.6 million
Estimated Market size in 2026
USD 97.0 million
Projected Market size by 2030
USD 144.7 million
Growth Rate
CAGR of 9.4% from 2025 to 2030
Base year for estimation
2024
Historical data
2018 - 2023
Forecast period
2025 - 2030
Quantitative units
Volume in Kilo Tons, Revenue in USD thousand, and CAGR from 2025 to 2030
Report coverage
Revenue forecast, company ranking, competitive landscape, growth factors, and trends
Segments covered
Process, Application, Region
Regional scope
North America, Europe, Asia Pacific, Latin America, MEA
Country scope
U.S., Canada, Mexico, Germany, UK, France, Italy, Spain, China, Japan, India, Brazil, Argentina, Saudi Arabia, UAE
Key companies profiled
Segetis; Biofine Technology LLC; DuPont; Hebei Langfang Triple Well Chemicals Co. Ltd; Hebei Shijiazhuang Worldwide Furfural & Furfuryl Alcohol Furan Resin Co. Ltd.; Jiangsu Yancheng China Flavor Chemicals Co. Ltd; Shijiazhuang Pharmaceutical Group Ouyi Pharmaceutical Co. Ltd; Shanghai Apple Flavor & Fragrance Co. Ltd
Customization scope
Free report customization (equivalent up to 8 analysts working days) with purchase. Addition or alteration to country, regional & segment scope.
Pricing and purchase options
Avail customized purchase options to meet your exact research needs. Explore purchase options
Global Levulinic Acid Market Report Segmentation
This report forecasts revenue growth at global, regional, and country levels and provides an analysis of the latest industry trends in each of the sub-segments from 2018 to 2030. For this study, Grand View Research has segmented the global levulinic acid market report based on process, application, and region.

-
Process Outlook (Volume, Kilo Tons, Revenue, USD Thousand, 2018 - 2030)
-
Acid Hydrolysis
-
Bio fine
-
Others
-
-
Application Outlook (Volume, Kilo Tons, Revenue, USD Thousand, 2018 - 2030)
-
Plasticizers
-
Pharmaceuticals
-
Agriculture
-
Cosmetics
-
Food Additive
-
Others
-
-
Regional Outlook (Volume, Kilo Tons, Revenue, USD Thousand, 2018 - 2030)
-
North America
-
U.S.
-
Canada
-
Mexico
-
-
Europe
-
Germany
-
UK
-
France
-
Italy
-
Spain
-
-
Asia Pacific
-
China
-
Japan
-
India
-
-
Latin America
-
Brazil
-
Argentina
-
-
Middle East and Africa (MEA)
-
Saudi Arabia
-
UAE
-
-
About the Author(s)
Renewable Chemicals Research Team
Specialty & Chemicals · Renewable ChemicalsThis report was authored by the renewable chemicals research team at Grand View Research - comprising two research analysts, one senior research analyst, and one industry expert - with specialized expertise in the renewable chemicals segment of the specialty & chemicals industry. All findings are based on proprietary specialty & chemicals databases, executive interviews, and regulatory analysis, subject to internal peer review prior to publication.
Last Updated:
Speak to Analyst


Need a Tailored Report?
Customize this report to your needs — add regions, segments, or data points, with 20% free customization.
Or view our licence options:

ISO 9001:2015 & 27001:2022 Certified
We are GDPR and CCPA compliant! Your transaction & personal information is safe and secure. For more details, please read our privacy policy.


