- Home
- »
- Display Technologies
- »
-
Quantum Dot Display Market Size, Industry Report, 2030GVR Report cover
![Quantum Dot Display Market Size, Share & Trends Report]()
Quantum Dot Display Market (2024 - 2030) Size, Share & Trends Analysis Report By Component (Tube, Film, LED), By Material, By Application (Consumer Electronics, Healthcare), By Region, And Segment Forecasts
- Report ID: 978-1-68038-787-2
- Number of Report Pages: 80
- Format: PDF
- Historical Range: 2018 - 2022
- Forecast Period: 2024 - 2030
- Industry: Semiconductors & Electronics
- Report Summary
- Table of Contents
- Segmentation
- Methodology
- Download FREE Sample
-
Download Sample Report
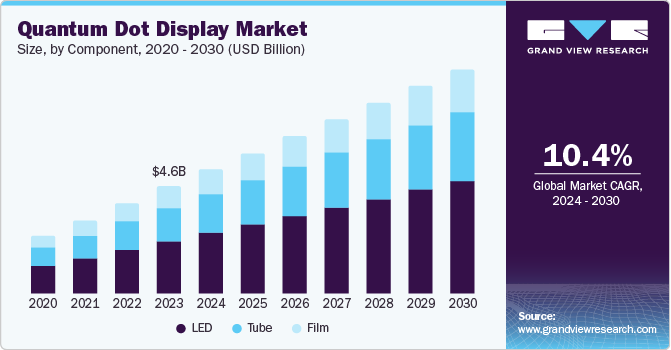
The global quantum dot display market size was estimated at USD 4.57 billion in 2023 and is projected to reach USD 9.57 billion by 2030, growing at a CAGR of 10.4% from 2024 to 2030. Consumers globally are increasingly seeking high-resolution displays with superior picture quality and vibrant colors, particularly in their televisions and smartphones, which has proven to be a leading factor for market growth.
Key Market Trends & Insights
- North America held the highest market share of 43.9% in 2023.
- The U.S. holds a notable share in the North American market for quantum dot displays.
- By component, the LED segment accounted for the largest share of 48.6% of the market revenue in 2023.
- By material, cadmium containing QD displays accounted for a larger market share of 52.4% in 2023.
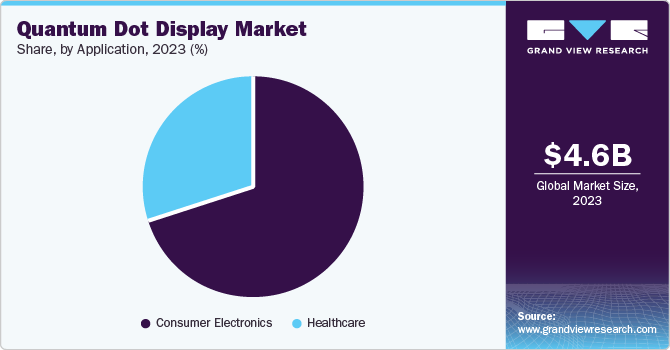
- By application, the consumer electronics segment dominated the market with a revenue share of 69.8% in 2023.
Market Size & Forecast
- 2023 Market Size: USD 4.57 Billion
- 2030 Projected Market Size: USD 9.57 Billion
- CAGR (2024-2030): 10.4%
- North America: Largest market in 2023
- Asia Pacific: Fastest growing market
Quantum dots are tiny nanoparticles that produce monochromatic lights of red, blue, and green colors. Display panels made with quantum dot (QD) technology offer color precision even at peak brightness levels, thus providing an enhanced viewing experience for consumers. This technology delivers a wider color gamut, enabling more accurate color reproduction, which leads to a more immersive experience for viewers. This drives significant demand for QD displays in the consumer electronics sector.
Quantum dot displays offer improved energy efficiency and better brightness compared to traditional displays such as LCD and OLED. This results in energy-cost savings for both manufacturers and consumers. Manufacturers can create thinner, lighter devices with longer battery life, while consumers can enjoy reduced energy consumption and significantly lower operating costs. Additionally, quantum dot display panels are developed using latest technologies, which leads to longer lifespan and reduced burn-in of the products. These factors have helped in ensuring a substantial market expansion.
The demand for high-resolution displays is increasing across the world owing to increased consumer expenditure on luxury and Veblen goods. Consumers are increasingly opting for home-based entertainment solutions for viewing video content, as well as for gaming purposes. A substantial demand growth can especially be seen in developing countries, which leads to enhanced expenditure on research and development for cost-efficient production methods. This R&D is expected to lead to further advancements in QD technology in the coming years, unlocking new applications and enhancing performance, which is expected to ultimately stimulate market growth.
Component Insights
The LED segment accounted for the largest share of 48.6% of the market revenue in 2023. LEDs form the fundamental light source in most quantum dot display technologies. Quantum dots enhance the color performance of existing light sources such as LEDs. Moreover, LEDs offer greater design flexibility and efficient integration with quantum dot films. This allows for a more compact and potentially lower-cost display construction, when compared to bulky glass tubes.
Quantum dot tubes are expected to grow at the CAGR of 10.4% over the forecast period. They offer an alternative approach to LEDs and provide better viewing angles. On the other hand, films act as color conversion layers, receiving light from the LED backlight and emitting it with enhanced color properties. Films offer advantages such as lower weight and potentially better energy efficiency, leading to their increased use in smaller display devices such as smartphones and tablets. However, their market share is limited by the established dominance of LEDs. LEDs are expected to maintain their leading position owing to their established functionality, integration advantages, and current cost-effectiveness.
Material Insights
Cadmium containing QD displays accounted for a larger market share of 52.4% in 2023. Cadmium-based quantum dots have exceptional capabilities in replicating a wide color gamut. This results in displays with vibrant, highly accurate colors, which has become a crucial factor for manufacturers of high-definition televisions and other premium displays. Furthermore, these quantum dots have superior light-emitting efficiency, which leads to a higher brightness level of display without consuming extra power. This energy efficiency plays a crucial role in market demand, benefitting both consumers as well as manufacturers.
The cadmium-free segment is anticipated to expand at a higher CAGR of 14.1% during the forecast period. With rising environment-related concerns, cadmium-free quantum dots are increasingly being adopted by consumers. Cadmium-free alternatives use different materials such as indium phosphide or cesium lead halide, reducing environmental and health concerns that are posed by cadmium usage. Eliminating the use of cadmium reduces the environmental impact that results from display production and disposal. The use of cadmium-free technologies aligns with the rapidly growing consumer demand for sustainable products.
Application Insights
The consumer electronics segment dominated the market with a revenue share of 69.8% in 2023. With changing consumer lifestyles, urbanization, and increasing disposable income levels, consumers are seeking superior visual experiences from their products. Quantum dot displays deliver these requirements by offering a wider color gamut, improved picture quality, and better energy efficiency. In addition, the technology is utilized for major applications such as high-resolution TVs, smartphones and tablet displays, and highly color-accurate monitors for video editors and gamers.

The healthcare sector is expected to register a higher growth rate compared to the consumer electronics segment from 2024 to 2030. Quantum dot technology is useful in a range of medical applications; for instance, quantum dots can be used as super-bright, long-lasting fluorescent labels for biomolecules and tissues. This allows for high-resolution and detailed imaging in fluorescence imaging techniques. They can also be designed to work with different imaging modalities such as MRI and PET, providing more comprehensive information to doctors. Furthermore, the initiation of various research & development activities to understand other potential uses of this technology is expected to drive steady market growth.
Regional Insights
North America held the highest market share of 43.9% in 2023. This region is home to a significant number of leading technology companies that are at the forefront of developing innovative display technologies. These companies invest heavily in research and development (R&D), nurturing innovation and early adoption of new technologies in quantum dot displays. Additionally, consumer preference for high-quality displays such as 4K, UHD, QLED, and 8K drives substantial market expansion in North America.

U.S. Quantum Dot Display Market Trends
The U.S. holds a notable share in the North American market for quantum dot displays. This is owing to the presence of a high-income consumer population in the economy, which spends heavily on luxury goods such as expensive television sets for entertainment purposes such as watching movies, TV series, and playing online games. Quantum dot displays are not limited to being used solely in consumer electronics applications in the U.S., as they offer potential uses in defense and security monitoring as well, leading to their widespread demand in the economy.
Europe Quantum Dot Display Market Trends
Europe quantum dot display market held a substantial market revenue share in 2023. This is owing to the rising focus of regional authorities regarding the adoption of sustainable and energy-efficient alternatives in every industry. For instance, several governments in northern Europe are focusing on renewable energy solutions and seeking lower energy-consuming electronic items, irrespective of their initial costs. Furthermore, Europe has strict regulations regarding the movement and disposal of hazardous materials, such as the Basel Convention treaty that was signed in 1989. The development and adoption of cadmium-free quantum dots is expected to be particularly attractive to European manufacturers and consumers, driving growth.
UK Quantum Dot Display Market Trends
The UK has a strong research and development infrastructure for modern-day technologies. The thriving regional economy and high disposable income lead to favorable market adoption for innovative technologies such as quantum dot displays. Additionally, the country is experiencing a growing culture of online gaming among the youth population, which highlights the need for high-end displays that can operate for a longer duration. Quantum dot displays can easily address these needs, which is another reason for market expansion in the country.
Asia Pacific Quantum Dot Display Market Trends
The Asia Pacific region is expected to register the fastest CAGR during the forecast period, owing to a significant rise in disposable income among the working population, leading to a growing appetite for advanced consumer electronics devices such as smartphones, televisions, and tablets. These devices are the primary applications for quantum dot displays due to their superior picture quality and energy efficiency. Governments in this region are actively promoting energy-saving technologies. Quantum dot displays, with their lower power consumption compared to traditional displays, align perfectly with these initiatives, incentivizing their adoption and market growth.
China Quantum Dot Display Market Trends
China is a major global manufacturing hub for electronics products. The presence of favorable government policies, a readily available skilled workforce, a robust logistics and supply chain, and economies of scale are some advantages that have driven strong growth of the electronics industry in the country. This proximity to production facilities allows for faster and more cost-effective integration of quantum dot technology into consumer electronics products, accelerating market penetration.
Key Quantum Dot Display Company Insights
Some key companies involved in the quantum dot display market include Nanoco Group plc, QD Laser, and The Dow Chemical Company, among others.
-
Nanoco Group plc is a UK-based nanotechnology research and manufacturing firm. The company is a prominent name in the manufacturing of various nanomaterials for commercial as well as research purposes. It offers CFQD quantum dot nanoparticles of 10 to 100 atom diameter and HEATWAVE quantum dots for use in the sensor industry. Products offered by the company find applications in major areas such as biometric facial recognition system, optical diagnostics, and night vision.
-
QD Laser, Inc. is a Japanese manufacturer of semiconductor lasers. The company offers a wide range of laser products such as compact visible lasers, high-power Fabry-Perot lasers, DFB lasers, and quantum dot lasers. Quantum dot lasers of range 1240nm-1330nm for various applications such as optical communication, silicon photonics, and underground resource exploration are offered by the company.
Key Quantum Dot Display Companies:
The following are the leading companies in the quantum dot display market. These companies collectively hold the largest market share and dictate industry trends.
- The Dow Chemical Company
- InVisage Technologies (Apple)
- Nanoco Group plc
- Shoei Electronic Materials, Inc.
- NN-Labs (NNCrystal US Corporation)
- Ocean NanoTech
- SAMSUNG
- QD Laser
- QLight Nanotech
- Quantum Materials Corporation
Recent Developments
-
In September 2023, Shoei Chemical, Inc., along with Shoei Electronic Materials, Inc., the company’s North America-based subsidiary, announced the acquisition of Nanosys, Inc., which specializes in the field of quantum dot technology. This strategic initiative by Shoei is expected to strengthen the position of the company in the advanced materials industry.
-
In May 2023, Nanoco Technologies announced a licensing and collaboration agreement with Guangdong Poly Optoelectronics Co., Ltd. As per this agreement, the two companies would collaborate and develop cadmium-free quantum dot solutions for a range of applications, such as advanced displays and lighting films, among others. Nanoco would further be able to market its environment-friendly CFQD quantum dots in China through this deal.
Quantum Dot Display Market Report Scope
Report Attribute
Details
Market size value in 2024
USD 5.29 billion
Revenue Forecast in 2030
USD 9.57 billion
Growth rate
CAGR of 10.4% from 2024 to 2030
Base year for estimation
2023
Historical data
2018 - 2022
Forecast period
2024 - 2030
Quantitative units
Revenue in USD million/billion, and CAGR from 2024 to 2030
Report Coverage
Revenue forecast, company ranking, competitive landscape, growth factors, and trends
Segments Covered
Component, material, application, region
Regional scope
North America, Europe, Asia Pacific, Latin America, MEA
Country scope
U.S., Canada, Mexico, Germany, UK, China, Japan, South Korea, Taiwan, Brazil
Key companies profiled
The Dow Chemical Company; InVisage Technologies (Apple); Nanoco Group plc; Shoei Electronic Materials, Inc.; NN-Labs (NNCrystal US Corporation); Ocean NanoTech; SAMSUNG; QD Laser; QLight Nanotech; Quantum Materials Corporation
Customization scope
Free report customization (equivalent up to 8 analysts working days) with purchase. Addition or alteration to country, regional & segment scope.
Pricing and purchase options
Avail customized purchase options to meet your exact research needs. Explore purchase options
Global Quantum Dot Display Market Report Segmentation
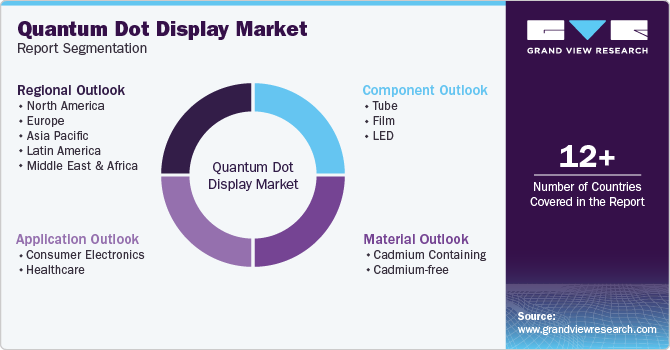
This report forecasts revenue growth at the global, regional, and country levels and provides an analysis of the latest industry trends in each of the sub-segments from 2018 to 2030. For this study, Grand View Research has segmented the global quantum dot display market report based on component, material, application, and region:

-
Component Outlook (Revenue, USD Million, 2018 - 2030)
-
Tube
-
Film
-
LED
-
-
Material Outlook (Revenue, USD Million, 2018 - 2030)
-
Cadmium Containing
-
Cadmium-free
-
-
Application Outlook (Revenue, USD Million, 2018 - 2030)
-
Consumer Electronics
-
Healthcare
-
-
Regional Outlook (Revenue, USD Million, 2018 - 2030)
-
North America
-
U.S.
-
Canada
-
Mexico
-
-
Europe
-
UK
-
Germany
-
-
Asia Pacific
-
Japan
-
Taiwan
-
China
-
South Korea
-
-
Latin America
-
Brazil
-
-
Middle East & Africa
-
Share this report with your colleague or friend.
Need a Tailored Report?
Customize this report to your needs — add regions, segments, or data points, with 20% free customization.

ISO 9001:2015 & 27001:2022 Certified
We are GDPR and CCPA compliant! Your transaction & personal information is safe and secure. For more details, please read our privacy policy.
Trusted market insights - try a free sample
See how our reports are structured and why industry leaders rely on Grand View Research. Get a free sample or ask us to tailor this report to your needs.


