
Simulation Software Market (2026 - 2033) Size, Share & Trends Analysis Report By Component (Software, Services), By Deployment (On-premise, Cloud), By Application (Engineering, Research, Modeling & Simulated Testing, High Fidelity Experiential 3D Training), By End Use, By Region, And Segment Forecasts
Our Research Methodology
A glimpse at our time-tested and proven information gathering, analysis, formulation, and validation process.
Throughout each step of the research and reporting process, we institute industry best practices and international standards of data collection, analysis, and reporting, to provide comprehensive, validated insights to our clients. Our process is rigorous and iterative, and specific to the industry and questions we're trying to answer. We continue to validate our work as we uncover new data points and derive new insights, and we work with clients to clearly define research goals and agree upon the methodology we'll apply to each project.

Information Procurement
Information procurement is one of the most extensive and important stages in our research process, and quality data is absolutely critical for accurate analysis. We follow a Multi-Channel Data Collection Process to gather the most reliable and current information possible.
- We buy access to paid databases such as Hoover's and Factiva for company financials, industry information, white papers, industry journals, SME journals, and more.
- We tap into Grand View's proprietary database of data points and insights from active and archived monitoring and reporting.
- We conduct primary research with industry experts through questionnaires and one-on- one phone interviews.
- We pull from reliable secondary sources such as white papers and government statistics, published by organizations like WHO, NGOs, World Bank etc., Key Opinion Leaders (KoL) publications, company filings, investor documents, and more.
- We purchase and review investor analyst reports, broker reports, academic commentary, government quotes, and wealth management publications for insightful third-party perspectives.
Information
Analysis
We mine the data collected to establish baselines for forecasting, identify trends and opportunities, gain insight into consumer demographics and drivers, and so much more. We utilize different methods of data analysis depending on the type of information we're trying to uncover in our research.
Market Research Efforts:
- Bottom-up Approach for estimating and forecasting demand size and opportunity
- Top-down Approach for new product forecasting and penetration
- Combined Approach of both Bottom-up and Top-down for full coverage analysis
Value-Chain-Based Sizing & Forecasting
- Supply-Side Estimates for understanding potential revenue through competitive benchmarking, forecasting, and penetration modeling
- Demand-Side Estimates for identifying parent and ancillary markets, segment modeling, and heuristic forecasting
- QualitativeFunctional Deployment (QFD) Modelling for market share assessment
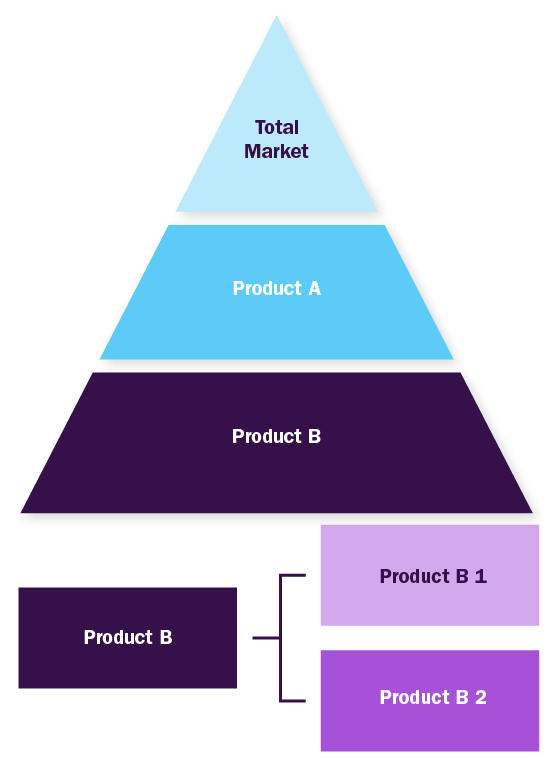
Market Research Approaches:
Bottom-up Approach
- Demand estimation of each product across countries/regions summed to from the total market
- Variable analysis for demand forecast
- Demand estimation via analyzing paid database, company financials either via annual reports or paid database
- Primary interviews for data revalidation and insight collection
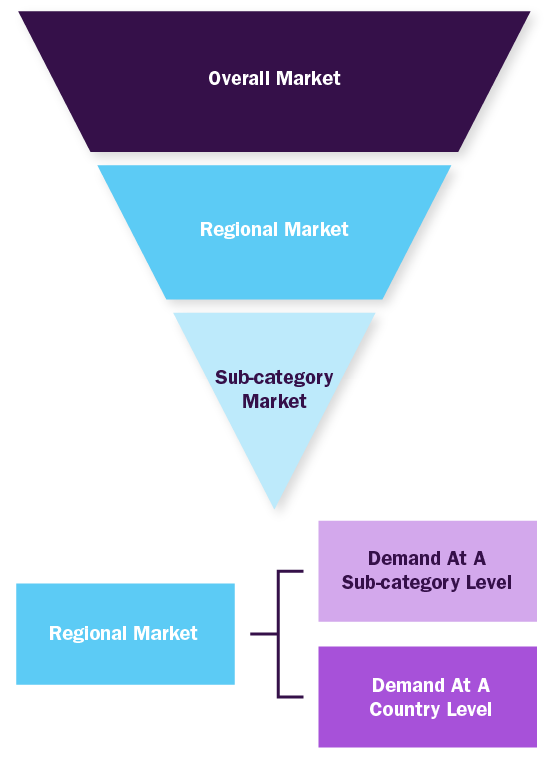
Top-down Approach
- Used extensively for new product forecasting or analyzing penetration level
- Tool used invoice product flow and penetration models
- Use of regression multi-variant analysis for forecasting
- Involves extensive use of paid and public databases
- Primary interviews and vendor-based primary research for variable impact analysis
Combined/Mixed Approach
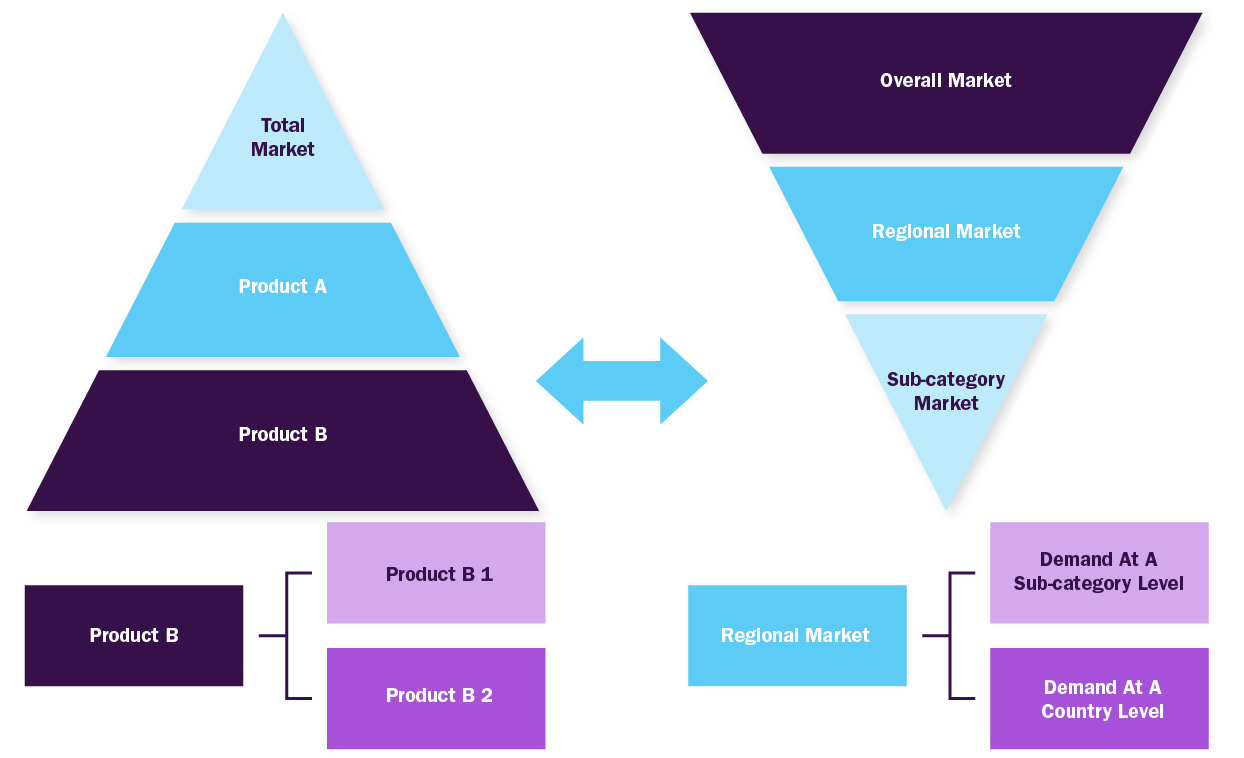
Derived via commodity flow and demand / consumption models
Value Chain Based Sizing & Forecasting
Supply Side Estimates
- Company revenue estimation via referring to annual reports, investor presentations and Hoover's
- Segment revenue determination via variable analysis and penetration modelling
- Competitive benchmarketing to identify market leaders and their collective revenue shares
- Forecasting via analyzing commercialization rates, pipeline, market initiatives, distribution networks etc.
Demand Side Estimates
- Identifying parent markets and ancillary markets
- Segment penetration analysis to obtain pertinent revenue/volume
- Heuristic forecasting with the help of subject matter experts
- Forecasting via variable analysis
Market Formulation And Validation
We finalize market numbers through data normalization, aligning estimates and forecasts, and refining the report scope and data representation. Our process includes multiple validation levels involving industry experts and quality control managers, ensuring that only thoroughly validated studies move forward for publication.
Market Formulation:
- This step involves finalization of market numbers. This step on an internal level is designed to manage outputs from the Data Analysis step.
Data Normalization
- The final market estimates and forecasts are then aligned and sent to industry experts and in-panel quality control managers for validation.
- This step also entails the finalization of the report scope and data representation pattern.
Validation
- The process entails multiple levels of validation. All these steps run in parallel and the study is forwarded for publishing only if all three levels render validated results.

Delivery
We know that our clients are looking for more than data points on a page they're relying on a trusted adviser and partner to hunt for insights and collaborate with them to diagnose and respond to market forces.
Delivery Details
Each of our analysts works with clients to scope questions appropriately and to clarify report findings. Moreover, each client is assigned a project point person to ensure a smooth process throughout the course of the project. We believe this open flow of communication is critical to provide meaningful and accurate consultation.
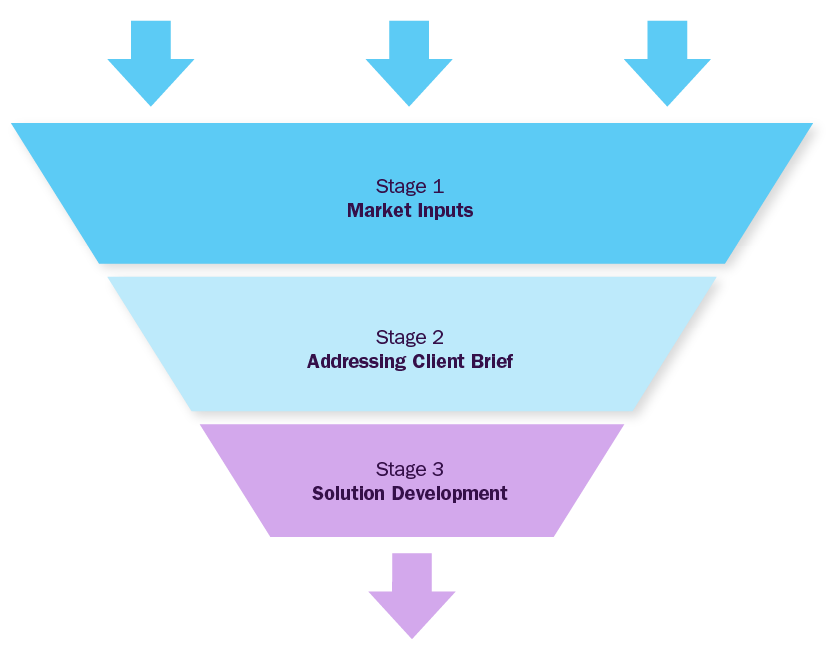
Market Inputs
GVR team analyzes the overall market scenario across regions to understand the country-/ regional level dynamics. To build market models, we analyze several factors, including:
- Macro & micro economic factors
- Political scenarios and government regulations
- Industrial policies
- Technology challenges
- CAPEX projects & investment patterns
- Sales channel profitability
Addressing Client Inputs
GVR team will work around the client's brief to address particular pain points considering inputs from stage-1. This phase will address specifics of the objective custom-made for the client and deliver value through fact-based market requirements. Brief could be focused on market entry strategy, new product launches, M&A partner identification, JV or investments, location feasibility, financial model development, technology roadmap, customer satisfaction surveys etc
Solution Development
GVR team will build a strategy roadmap with actionable insights and strategic recommendations for the client, based on the outcome of first two stages, considering various parameters aligned to the objective shared by the client.
Proven Record (A partial list)
Trusted market insights - try a free sample
See how our reports are structured and why industry leaders rely on Grand View Research. Get a free sample or ask us to tailor this report to your needs.

