
- Home
- »
- Conventional Energy
- »
-
Tight Gas Market Size, Share And Trends Report, 2033GVR Report cover

Tight Gas Market (2026 - 2033)
Size, Share & Trends Analysis Report By Application (Industrial, Power Generation, Residential, Commercial, Transportation), By Region (North America, Rest of the World), And Segment Forecasts
Market Size, 2025
$54.9BMarket Estimate, 2026
$57.4BMarket Forecast, 2030
$83.3BCAGR, 2026–2030
5.5%Tight Gas Market Summary
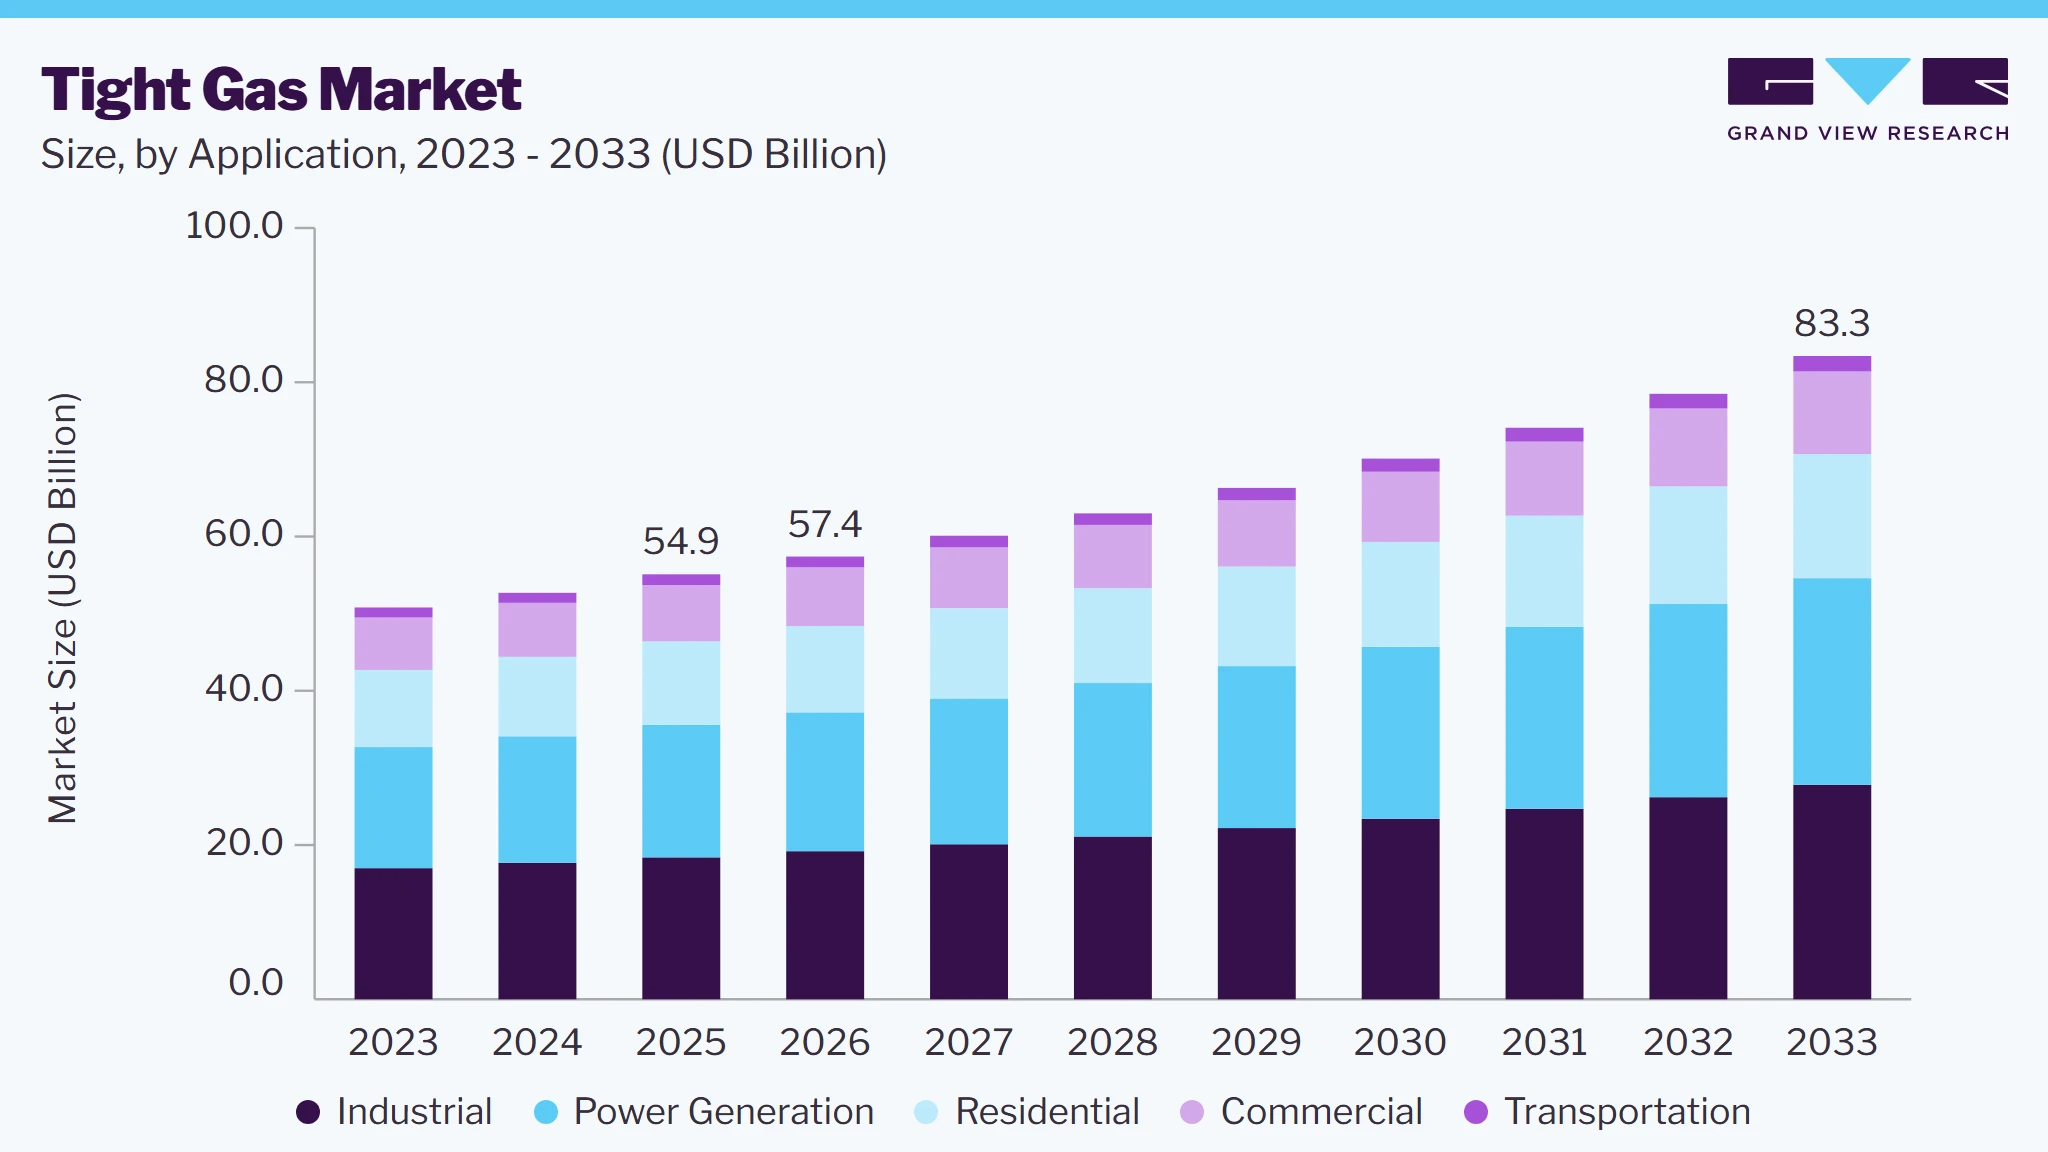
The global tight gas market size was valued at USD 54.9 billion in 2025 and is projected to grow from USD 57.4 billion in 2026 to USD 83.3 billion by 2033, at a CAGR of 5.5% from 2026 to 2033. North America dominated the market, accounting for a revenue share of 88.9% in 2025. This growth is attributed to rising global energy demand, particularly in developing economies, which necessitates the exploration of unconventional gas sources such as tight gas.
 Source: Grand View Research, IR Documents, Primary Interviews, Paid DatabasesTo learn more about this report,
 Download Free Sample Report
Key Market Trends & Insights
- By application: Industrial segment led the market with the largest revenue share of 33.5% in 2025.
Regional Highlights
- Largest regional market: North America (88.9% revenue share, 2025)
- By country: The U.S. held the largest market share in 2025.
Market Size & Forecast
- Market size in 2025: USD 54.9 Billion
- Estimated market size in 2026: USD 57.4 Billion
- Projected market size by 2033: USD 83.3 Billion
- CAGR (2026-2033): 5.5%
Three ways to get this report
Buy it, customize it, or ask a question.Ask an Analyst
Analyst response in 1 business day
- AccessReport author, directly
- Reply timeWithin 1 working day
- No sales callDirect answer only
- FormatEmail reply
- CostFree, no cost
Get the Full Report
What the study covers
- FormatsPDF · Excel · Dashboard
- Timeline2026–2030 annual, 2025 base
- Coverage20+ countries, 5 regions
- Companies10+ key players profiled
Customize the Report
20% free customization
- IncludeCountries, segments, points
- TailorTo your product definition
- ExtendDeeper competitor detail
- OrA fully bespoke study
- Turnaround5–10 working days
In addition, advancements in extraction technologies, such as hydraulic fracturing and horizontal drilling, have made it more economically viable to tap into these resources. Furthermore, the environmental benefits of natural gas, including lower carbon emissions compared to coal and oil, further enhance its appeal as a cleaner energy source, supporting the market's expansion. Tight gas refers to natural gas trapped in rock formations with extremely low permeability, typically found in sandstone or limestone, requiring significant hydraulic fracturing for extraction. The increasing global energy demand has spurred exploration and production of unconventional gas resources like tight gas. This demand and advancements in drilling technologies have fostered a conducive environment for the tight gas market's growth. As economies expand and urbanize, the preference for natural gas rises due to its lower environmental impact than coal and oil.In addition, infrastructure development to facilitate natural gas distribution, including new pipelines and LNG export terminals, reflects this rising demand. For instance, expanding the Sabine Pass LNG terminal in the U.S. has enhanced export capabilities to meet global needs. These developments highlight how the growing appetite for cleaner energy sources propels the tight gas market forward.
 To learn more about this report, Download Free Sample Report
Furthermore, natural gas's environmental advantages contribute to its increased demand. With governments and organizations striving to minimize carbon emissions, cleaner energy options like natural gas are becoming more attractive. Consequently, the combination of rising energy needs and a shift toward environmentally friendly fuel sources drives significant growth in the global tight gas market.
Market Dynamics
The tight gas market is driven by rising global demand for cleaner-burning natural gas, increasing energy security initiatives, and the development of unconventional gas resources to supplement declining conventional reserves. Advances in horizontal drilling and hydraulic fracturing technologies have improved production efficiency and made tight gas extraction more economically viable. However, the market faces challenges from high exploration and production costs, environmental concerns related to hydraulic fracturing, and fluctuating natural gas prices. Despite these restraints, growing investments in domestic gas production and expanding natural gas infrastructure are expected to support long-term market growth.
The increasing global demand for natural gas as a lower-carbon alternative to coal and oil is a major driver of the tight gas market. Governments and energy producers are expanding the development of unconventional gas resources, including tight gas, to meet growing electricity, industrial, and residential energy needs while reducing greenhouse gas emissions. Geopolitical uncertainties and concerns over energy supply security are encouraging countries to strengthen domestic natural gas production and reduce reliance on imported fuels. This trend is accelerating investments in tight gas exploration, drilling, and production technologies, supporting sustained market growth.
According to the International Energy Agency (IEA) in its Gas 2025 report, global natural gas demand is projected to grow by around 9% between 2024 and 2030, increasing by approximately 380 billion cubic metres (bcm). The Asia Pacific region is expected to account for about half of this demand growth, with China alone contributing nearly one-quarter of the global increase. The IEA also projects that around 300 bcm per year of new global LNG export capacity will be added by 2030, primarily from the United States and Qatar, strengthening energy security and supporting continued development of unconventional gas resources such as tight gas.
Tight gas extraction requires advanced technologies such as horizontal drilling and hydraulic fracturing, making it significantly more expensive than conventional natural gas production. High capital investment, drilling complexity, well stimulation costs, and ongoing operational expenses can reduce project profitability, particularly during periods of low natural gas prices. These elevated production costs discourage investment in new tight gas projects and slow the commercial development of unconventional gas resources, especially in cost-sensitive markets.
The rapid expansion of global LNG export infrastructure is creating a strong growth opportunity for the tight gas market. As countries seek reliable natural gas supplies to meet rising energy demand and strengthen energy security, producers are increasing the development of unconventional gas resources, including tight gas, to ensure a stable feedstock for LNG export terminals. This trend is encouraging investments in tight gas exploration, drilling, and production, particularly in resource-rich regions with established gas infrastructure. In 2025, the U.S. EIA reported that developers reached final investment decisions on four LNG projects with a combined 7.2 billion cubic feet per day (Bcf/d) of export capacity, creating additional demand for upstream natural gas production from unconventional resources such as tight gas.
Analyst Perspective
The tight gas market is expected to witness steady growth as rising natural gas demand, energy security concerns, and the shift toward cleaner fuels drive investments in unconventional gas resources. Advancements in horizontal drilling, hydraulic fracturing, and reservoir optimization technologies are improving production efficiency and making tight gas projects more economically viable. A key trend shaping the market is the increasing integration of digital technologies and data analytics to enhance well performance and reduce operational costs. However, regulatory challenges and environmental concerns related to unconventional gas extraction may influence future project development.
Application Insights
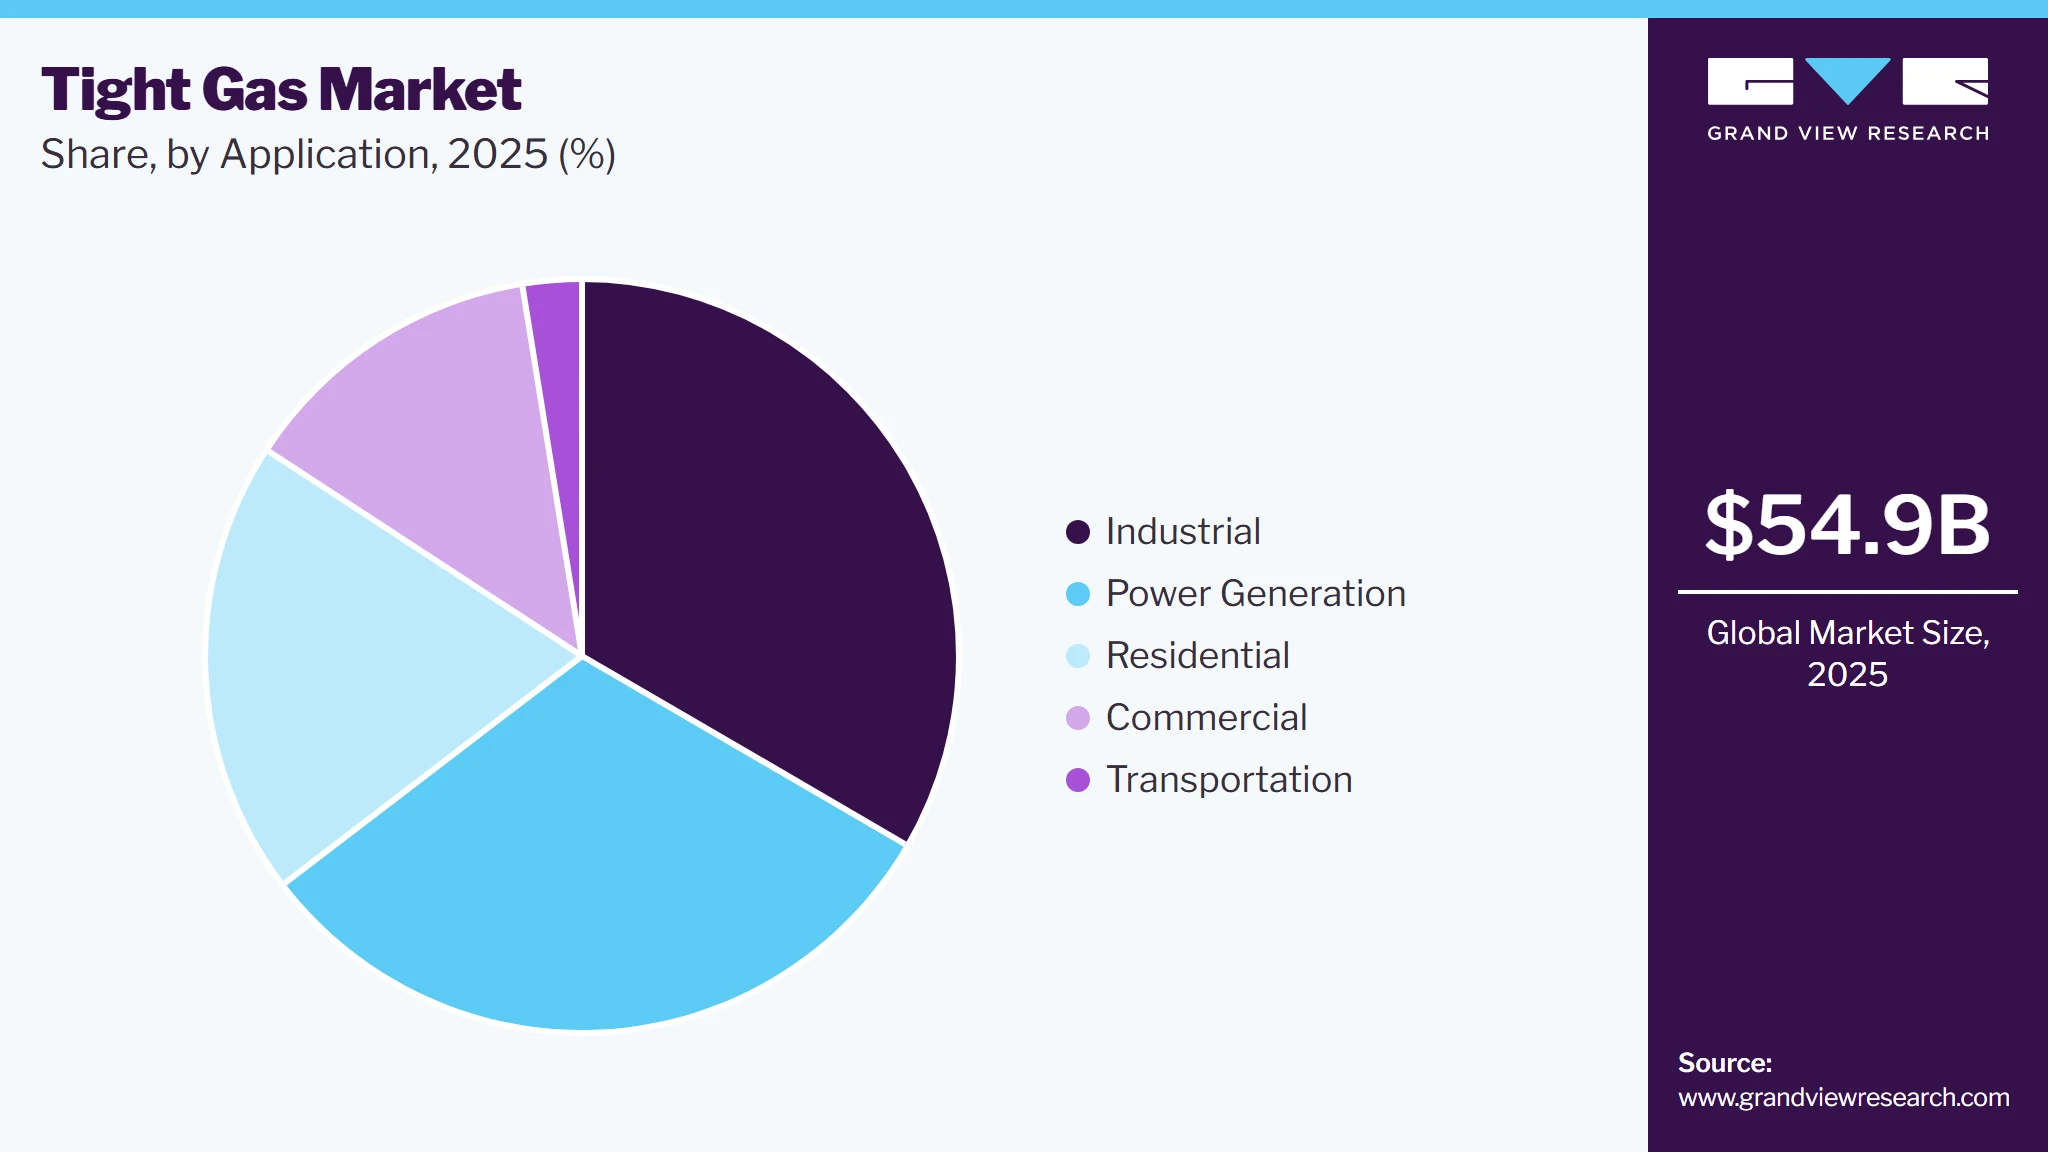
Based on application, the industrial segment led the market with the largest revenue share of 33.5% in 2025. This growth is attributed to its extensive use as a feedstock in various manufacturing processes. Tight gas is a crucial raw material for producing fertilizers, chemicals, and other commodities essential for numerous industries. In addition, as industrial activities expand globally, the demand for tight gas will increase significantly. Furthermore, government initiatives promoting clean energy and the economic advantages of utilizing domestically sourced tight gas will likely enhance production capabilities and boost industrial output in gas-rich regions.
 To learn more about this report, Download Free Sample Report
The power generation segment is expected to grow at a CAGR of 5.4% over the forecast period, owing to the transition from coal to natural gas. Tight gas combustion results in lower carbon emissions than coal and other fossil fuels, making it an attractive option for power plants aiming to reduce their environmental impact. In addition, this shift aligns with global efforts to decarbonize energy systems, leading to increased investments in natural gas infrastructure. Furthermore, as countries seek cleaner energy alternatives, the share of tight gas in their energy mix is anticipated to rise rapidly, positioning it as a key player in future power generation strategies.
Regional Insights
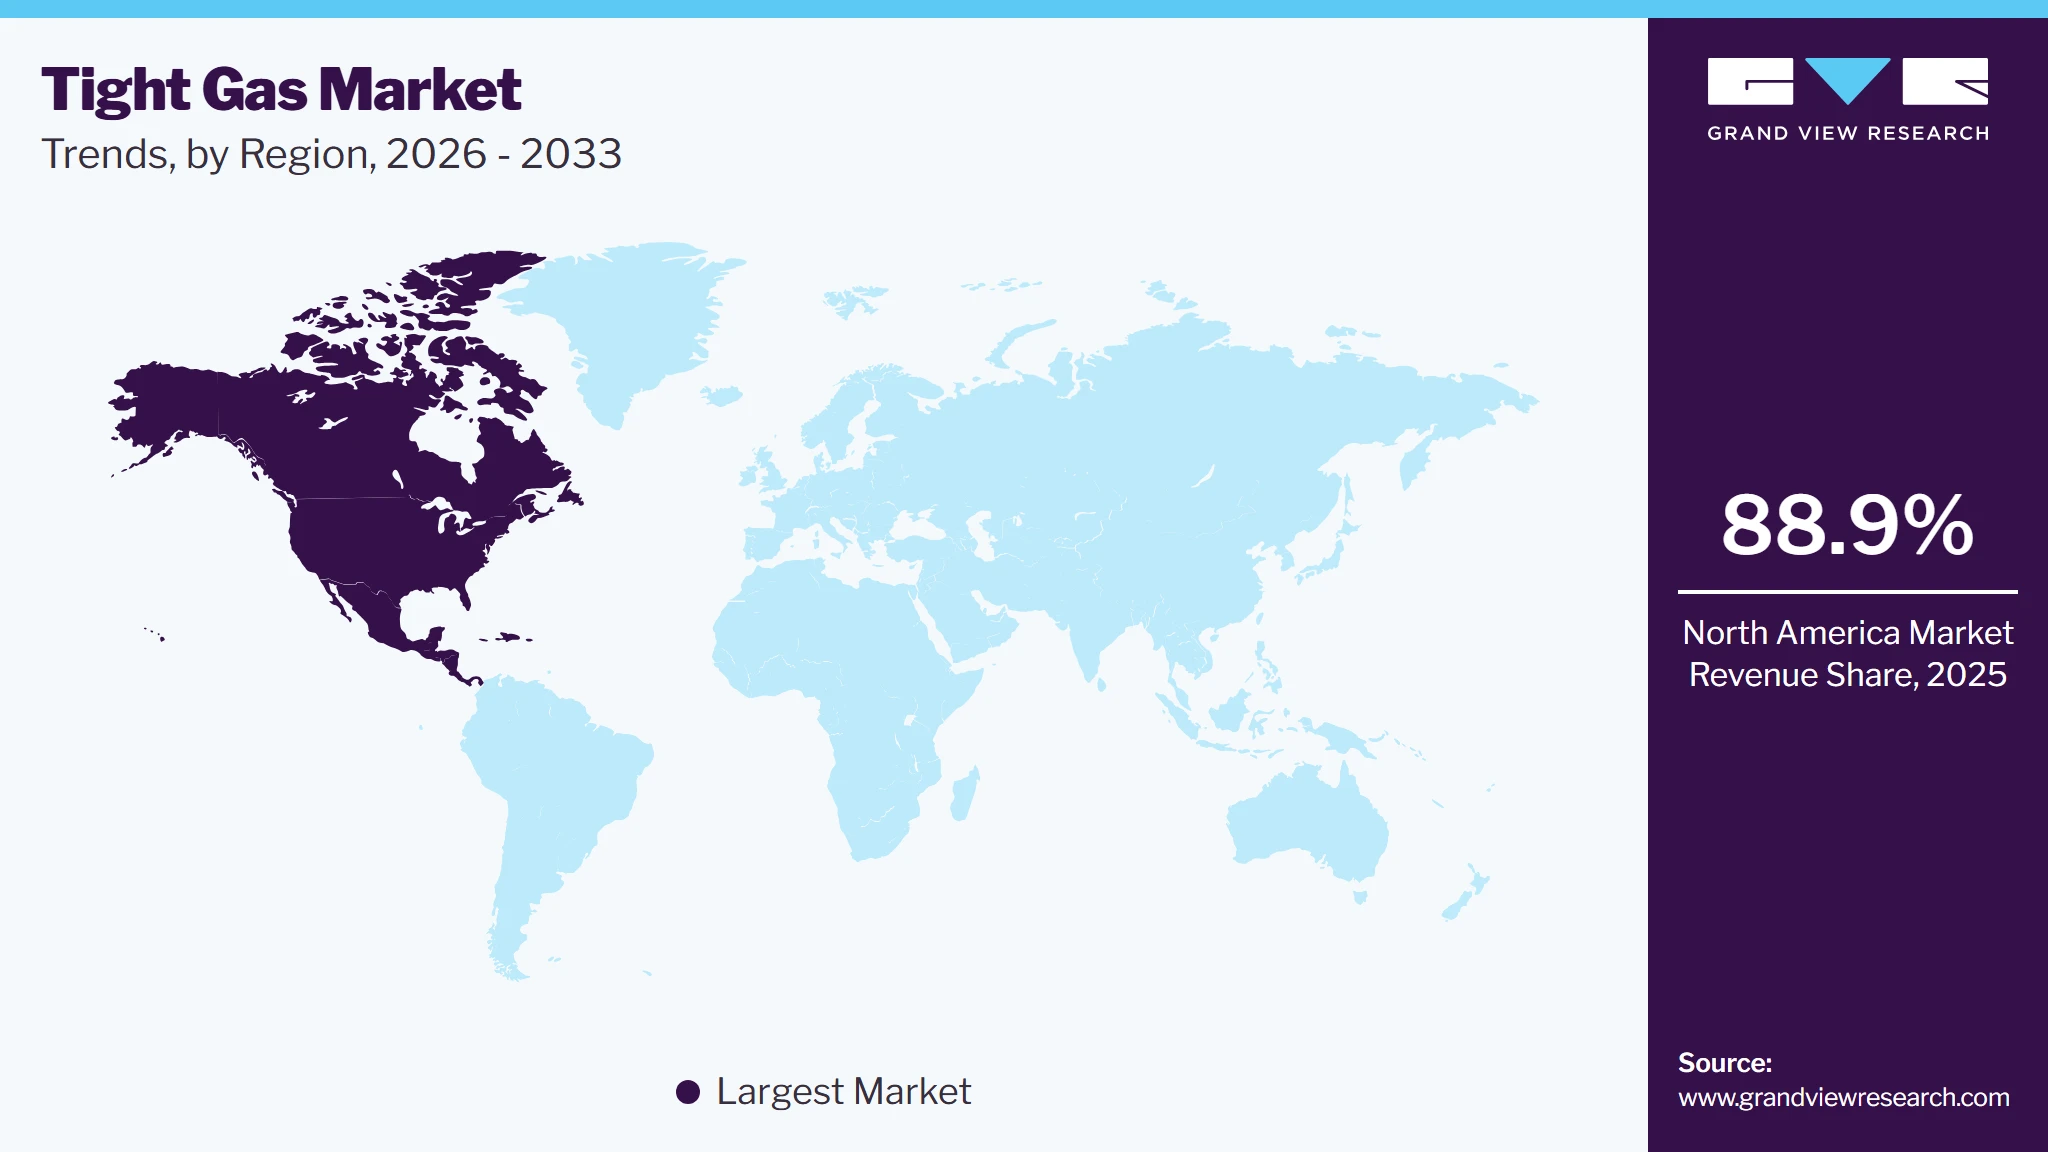
North America dominated the tight gas market with the largest revenue share of 88.9% in 2025. This growth is attributed to the vast reserves and advanced extraction technologies. In addition, the region accounts for a significant portion of global tight gas production, particularly in the Permian Basin, Anadarko, and Niobrara formations. Furthermore, adopting hydraulic fracturing and horizontal drilling has enhanced recovery rates and reduced costs, making tight gas more economically viable. Moreover, strong demand for cleaner energy sources amid environmental concerns supports the growth of this market, positioning North America as a leader in tight gas production.
 To learn more about this report, Download Free Sample Report
U.S. Tight Gas Market Trends
The tight gas market in the U.S. held the largest share in the North America region in 2025, driven by government policies and investments that are crucial in driving the tight gas market. In addition, supportive legislation and subsidies for extraction technologies have spurred production growth, particularly in prolific regions like Texas and North Dakota. Furthermore, the U.S. benefits from a highly skilled workforce and innovative drilling techniques that enhance efficiency. Moreover, as natural gas continues to replace coal in power generation, the demand for tight gas is expected to rise significantly, further solidifying the country’s position in the global market.
China Tight Gas Market Trends
China tight gas market is expected to grow at a CAGR of 8.5% over the forecast period owing to increasing energy demands and government initiatives aimed at promoting cleaner energy sources. In addition, the country has significant untapped tight gas reserves, particularly in the Ordos Basin and Sichuan Basin. Furthermore, the government's commitment to environmental sustainability drives a shift towards natural gas as a preferred fuel source for power generation and industrial applications.
Argentina Tight Gas Market Trends
The tight gas market in Argentina is expected to grow significantly over the forecast period. This growth is attributed to the development of the Vaca Muerta formation, which holds substantial technically recoverable reserves. The government's focus on attracting foreign investment and technology transfer has accelerated exploration activities in this region. As production from older fields’ declines, Vaca Muerta's continued development is crucial for maintaining Argentina's natural gas output. This strategic focus on tight gas resources is expected to enhance energy security and support economic growth in the country.
Key Tight Gas Company Insights
Some of the key companies in the market include Chevron Corporation, ConocoPhillips, Royal Dutch Shell Plc, and others. These companies adopt various strategies, including investing in advanced extraction technologies to improve operational efficiency and reduce costs. In addition, companies also focus on sustainable practices to minimize environmental impacts while maximizing production. Furthermore, strategic partnerships and joint ventures are being formed to share resources and expertise, facilitating access to new markets and enhancing overall supply chain capabilities. Furthermore, companies prioritize research and development to innovate new methods for tight gas extraction and processing.
-
ConocoPhillips operates across various segments, including upstream oil and gas, where it explores and produces crude oil, natural gas, natural gas liquids, and liquefied natural gas. ConocoPhillips has significant operations in regions such as the San Juan Basin, where it extracts tight gas from multiple formations, contributing to its overall production capabilities and positioning in the global energy market.
-
Royal Dutch Shell Plc focuses on developing unconventional resources through advanced extraction techniques. The company operates in several segments, including upstream exploration and production, where it engages in tight gas extraction from various basins worldwide. Shell's commitment to integrating sustainable practices into its operations further enhances its role in the tight gas market as it seeks to meet growing energy demands while minimizing environmental impacts.
Key Tight Gas Companies:
The following key companies have been profiled for this study on the tight gas market.
-
Chevron Corporation
-
ConocoPhillips
-
Royal Dutch Shell Plc
-
Sinopec
-
Marathon Oil
-
Pioneer Natural Resources
-
EOG Resources
-
British Petroleum
-
Exxon Mobil Corporation
-
PetroChina
-
Anadarko Petroleum Co.
-
Devon Energy
Competitive Benchmarking
Category
Operating Strategies
Competitive Edge
Weakness
Established Players (Chevron Corporation, ConocoPhillips, Shell Plc, China Petrochemical Corporation, BP p.l.c., Exxon Mobil Corporation, PetroChina Company Limited, TotalEnergies, Saudi Arabian Oil Co.)
- Focus on expanding tight gas exploration and production activities through large-scale investments in unconventional gas assets and advanced drilling technologies.
- Strengthen integrated upstream operations by leveraging existing natural gas processing, pipeline, and distribution infrastructure to ensure reliable supply.
- Invest in horizontal drilling, hydraulic fracturing, reservoir optimization, and digital technologies to improve well productivity and reduce production costs.
- Strong financial capabilities and extensive experience in large-scale oil & gas exploration and production projects.
- Access to diversified global asset portfolios, established infrastructure networks, and long-term gas supply contracts.
- Ability to provide integrated energy solutions through upstream production, processing, transportation, and distribution capabilities.
- High capital requirements and longer development timelines associated with large-scale tight gas projects.
- Exposure to regulatory changes, environmental concerns, and increasing restrictions on unconventional gas extraction activities.
- Dependence on natural gas price fluctuations can impact project profitability and investment decisions.
Emerging Players (EOG Resources, Inc.)
- Focus on developing high-quality tight gas assets through selective investments in core unconventional resource plays.
- Prioritize operational efficiency by applying advanced drilling techniques, data analytics, and well optimization practices.
- Expand production capacity by improving drilling productivity, reducing operating costs, and maximizing recovery from existing acreage.
- Strong expertise in unconventional resource development, particularly in horizontal drilling and hydraulic fracturing operations.
- Faster decision-making and operational flexibility compared with larger integrated energy companies.
- Focused asset portfolio enables efficient resource management and cost-effective production strategies.
- Limited geographic diversification compared with global integrated energy companies.
- Greater exposure to regional operational risks and fluctuations in specific gas-producing basins.
- Lower financial scale and infrastructure ownership compared with major international oil & gas companies.
Recent Developments
-
In October 2023, ExxonMobil announced a significant merger with Pioneer Natural Resources in an all-stock transaction that will more than double its footprint in the Permian Basin, enhancing its position in tight gas resources. This merger combines Pioneer’s extensive Midland Basin acreage with ExxonMobil’s holdings, creating an estimated 16 billion barrels of oil equivalent. The collaboration aims to improve production efficiency and accelerate net-zero emissions goals, ultimately strengthening U.S. energy security and economic stability.
-
In August 2023, Sinopec announced a major advancement in its Project Deep Earth, revealing 30.55 billion cubic meters of proven geological reserves at the Bazhong gas field in Sichuan, China. This field is notable for its tight sandstone gas, discovered at depths between 4,550 and 5,225 meters, posing significant exploration challenges. As part of its efforts, Sinopec has developed innovative models to enhance gas production and will continue to evaluate and expand tight gas reserves in the region.
Tight Gas Market Report Scope
Report Attribute
Details
Market Definition
The tight gas market comprises revenue generated from the sale of tight gas extracted from low-permeability reservoirs for industrial, power generation, residential, commercial, and transportation applications.
Market size in 2025
USD 54.9 billion
Estimated market size in 2026
USD 57.4 billion
Projected market size by 2033
USD 83.3 billion
Growth rate
CAGR of 5.5% from 2026 to 2033
Base year for estimation
2025
Historical data
2021 - 2024
Forecast period
2026 - 2033
Quantitative units
Revenue in USD Million, Volume in Billion Cubic Feet, and CAGR from 2026 to 2033
Report coverage
Revenue forecast, volume forecast, company ranking, competitive landscape, growth factors, and trends
Segments covered
Application, region
Regional scope
North America, Rest of the World (RoW)
Country scope
U.S., Canada, Mexico, China, Argentina, Australia.
Key companies profiled
Chevron Corporation, ConocoPhillips, Shell Plc, China Petrochemical Corporation, EOG Resources, Inc., BP p.l.c., Exxon Mobil Corporation, PetroChina Company Limited, TotalEnergies, Saudi Arabian Oil Co.
Customization scope
Free report customization (equivalent up to 8 analysts' working days) with purchase. Addition or alteration to country, regional & segment scope.
Pricing and purchase options
Avail customized purchase options to meet your exact research needs. Explore purchase options
Global Tight Gas Market Report Segmentation
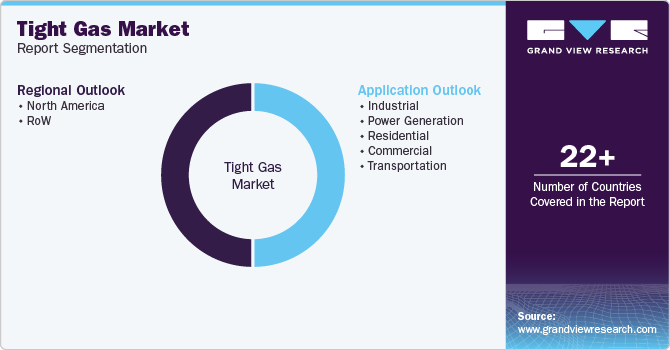
This report forecasts revenue growth at global, regional, and country levels and analyzes the latest industry trends in each sub-segment from 2021 to 2033. For this study, Grand View Research has segmented the tight gas market report based on application, and region:
 To learn more about this report, Download Free Sample Report
-
Application Outlook (Volume, Billion cubic feet; Revenue, USD Billion, 2021 - 2033)
-
Industrial
-
Power Generation
-
Residential
-
Commercial
-
Transportation
-
-
Regional Outlook (Volume, Billion cubic feet; Revenue, USD Billion, 2021 - 2033)
-
North America
-
U.S.
-
Canada
-
Mexico
-
-
RoW
-
China
-
Argentina
-
Australia
-
-
Research Methodology
The tight gas market figures in this report are based on a proven research process that combines executive interviews with secondary research from proprietary databases, company filings, and recognized regulatory and institutional sources. Market size is built through value-chain sizing - reconciling supply-side and demand-side estimates - and triangulated with bottom-up and top-down approaches. Every estimate passes multiple levels of expert validation before publication, with each tight gas segment quantified using the revenue-capture definitions in the table below.
Segment Definition
Segment - Application
Revenue capture definition
Industrial
Includes revenue from the sale of tight gas supplied to industrial facilities for applications such as manufacturing, chemical processing, metal processing, and other energy-intensive operations requiring natural gas as a fuel source or feedstock.
Power Generation
Represents revenue from tight gas utilized in gas-fired power plants for electricity generation, including combined-cycle and peaking power facilities that rely on natural gas as a primary fuel source.
Residential
Comprises revenue from tight gas supplied for residential energy consumption, including space heating, water heating, cooking, and other household applications through natural gas distribution networks.
Commercial
Includes revenue from tight gas consumption across commercial establishments such as offices, retail facilities, hotels, hospitals, and public buildings for heating, cooling, cooking, and general energy requirements.
Transportation
Represents revenue from tight gas used as a transportation fuel, including compressed natural gas (CNG) and liquefied natural gas (LNG) applications for vehicles, fleets, and heavy-duty transport systems.
Estimation Model
Layer Name
Key Question
Description
Tight Gas Demand Layer
What drives the demand for tight gas?
Identify the key demand drivers for tight gas, including rising natural gas consumption, increasing demand for lower-carbon energy sources, expansion of gas-fired power generation, industrial energy requirements, and growing investments in unconventional gas exploration and production. Assess the impact of energy security initiatives, technological advancements in drilling and hydraulic fracturing, and increasing natural gas infrastructure development on market growth.
Tight Gas Production & Resource Layer
How is tight gas extracted and supplied?
Analyze market adoption based on tight gas production from low-permeability reservoirs, including sandstone and shale formations. Assess supply trends based on exploration and drilling activities, well completion technologies, reservoir characteristics, production efficiency, and investments in unconventional gas fields.
Tight Gas Application Layer
Where is tight gas consumed?
Evaluate demand across industrial, power generation, residential, commercial, and transportation applications. Assess consumption patterns based on industrial fuel requirements, electricity generation demand, heating needs, commercial energy usage, and adoption of natural gas as a transportation fuel.
Revenue Layer
How is market revenue generated?
Market revenue is quantified through the sales of tight gas based on consumption volume across industrial, power generation, residential, commercial, and transportation applications. The overall market value is determined by revenue generated from tight gas production, processing, and supply to end-use sectors through natural gas distribution and energy infrastructure networks.
Delivered Customizations
This report has been delivered with the following In-depth customizations
Client Request
Customization Delivered
Value Adds
Application-wise Demand Assessment
A detailed application-level assessment was conducted to evaluate tight gas demand across industrial, power generation, residential, commercial, and transportation sectors. The analysis considered natural gas consumption patterns, sector-wise demand drivers, infrastructure development, and adoption trends across end-use industries.
Provides insights into key demand-generating applications and identifies sectors with strong growth potential for tight gas consumption.
Competitive Landscape Analysis
A comprehensive evaluation of major tight gas market participants was conducted, covering production capabilities, unconventional gas assets, drilling technologies, strategic initiatives, and market positioning of leading oil & gas companies.
Enables understanding of competitive intensity, key player strategies, and market concentration among major tight gas producers.
Natural Gas Market Assessment
A broader natural gas market assessment was performed by analyzing market dynamics across natural gas types, including pipeline gas and liquefied natural gas (LNG), along with application-wise demand across power generation, industrial, residential, commercial, and transportation sectors.
Provides a wider understanding of the natural gas ecosystem, demand trends, supply channels, and the role of tight gas within the overall natural gas market.
Frequently Asked Questions About This Report
The tight gas market size was estimated at USD 54.9 billion in 2025 and is expected to reach USD 57.4 billion in 2026.
Based on application, the industrial segment accounted for the largest revenue share of 33.5% in 2025.
The key players operating in the tight gas market are Chevron Corporation, ConocoPhillips, Shell Plc, China Petrochemical Corporation, BP p.l.c., Exxon Mobil Corporation, PetroChina Company Limited, TotalEnergies, Saudi Arabian Oil Co., EOG Resources, Inc., and others.
The North America region dominated the tight gas market with a revenue share of 88.9% in 2025.
The tight gas market is expected to grow at a CAGR of 5.5% from 2026 to 2033 to reach USD 83.3 billion by 2033.
The key factors driving the tight gas market include rising natural gas demand, energy security initiatives, advancements in hydraulic fracturing and drilling technologies, increasing investments in unconventional gas exploration, and the growing use of natural gas for power generation and industrial applications.
About the Author(s)
Conventional Energy Research Team
Energy & Power · Conventional EnergyThis report was authored by the conventional energy research team at Grand View Research - comprising two research analysts, one senior research analyst, and one industry expert - with specialized expertise in the conventional energy segment of the energy & power industry. All findings are based on proprietary energy & power databases, executive interviews, and regulatory analysis, subject to internal peer review prior to publication.
Last Updated:
Speak to Analyst

Customize this report to your needs - add regions, segments, or data points, with 20% free customization.
Or view our licence options:


ISO 9001:2015 & 27001:2022 Certified
We are GDPR and CCPA compliant! Your transaction & personal information is safe and secure. For more details, please read our privacy policy.


