
- Home
- »
- Next Generation Technologies
- »
-
Virtual Tour Market Size, Share & Trends Report, 2026-2033GVR Report cover

Virtual Tour Market (2026 - 2033)
Size, Share & Trends Analysis Report By Component (Hardware, Software, Services), By Technology (Non-Immersive, Semi & Fully Immersive), By Application (Real Estate, Tourism & Hospitality), By Region, And Segment Forecasts
Market Size, 2025
$17.1BMarket Estimate, 2026
$25.1BMarket Forecast, 2033
$138.3BCAGR, 2026–2033
27.6%Virtual Tour Market Summary
The global virtual tour market size was valued at USD 17.1 billion in 2025 and is projected to grow from USD 25.1 billion in 2026 to USD 138.3 billion by 2033, at a CAGR of 27.6% from 2026 to 2033. Asia Pacific dominated the market, accounting for a revenue share of 39.8% in 2025. The growth of the virtual tour market is primarily driven by the increasing adoption of immersive digital experiences, growth in real estate and tourism virtual showcasing, advancements in 360° imaging and 3D visualization, rising use of AI-powered content creation and digital twins, expansion of cloud-based virtual tour platforms, and growing demand for remote engagement solutions across industries.
 Source: Grand View Research, IR Documents, Primary Interviews, Paid DatabasesTo learn more about this report,
 Download Free Sample Report
Key Market Trends & Insights
- By component: The hardware segment accounted for the largest market share of 66.8% in 2025.
- By technology: The semi & fully immersive segment led the market with a share of 82.2% in 2025.
- By application: The real estate segment led the market with a share of 36.0% in 2025.
Regional Highlights
- Largest regional market: Asia Pacific (39.8% revenue share, 2025)
- Fastest-growing regional market: Europe (CAGR of 29.4%, 2026-2033)
- By country: China held the largest market share in 2025.
Market Size & Forecast
- Market size in 2025: USD 17.1 Billion
- Estimated market size in 2026: USD 25.1 Billion
- Projected market size by 2033: USD 138.3 Billion
- CAGR (2026-2033): 27.6%
Three ways to get this report
Buy it, customize it, or ask a question.Ask an Analyst
Analyst response in 1 business day
- AccessReport author, directly
- Reply timeWithin 1 working day
- No sales callDirect answer only
- FormatEmail reply
- CostFree, no cost
Get the Full Report
What the study covers
- FormatsPDF · Excel · Dashboard
- Timeline2026–2033 annual, 2025 base
- Coverage20+ countries, 5 regions
- Companies10+ key players profiled
Customize the Report
20% free customization
- IncludeCountries, segments, points
- TailorTo your product definition
- ExtendDeeper competitor detail
- OrA fully bespoke study
- Turnaround5–10 working days
The adoption of virtual tours has experienced significant growth across various industries, driven by advancements in technology and the increasing demand for immersive, remote engagement solutions. The shift toward cloud-based virtual tour software has facilitated scalability, accessibility, and cost-efficiency, enabling businesses to create, host, and share virtual tours without substantial investments in hardware or IT infrastructure. Furthermore, the virtual tour industry growth will be driven by the growing demand for virtual tour software by hotels, resorts, and travel destinations to allow customers to virtually explore destinations before making a booking, driving customer confidence and enhancing marketing efforts.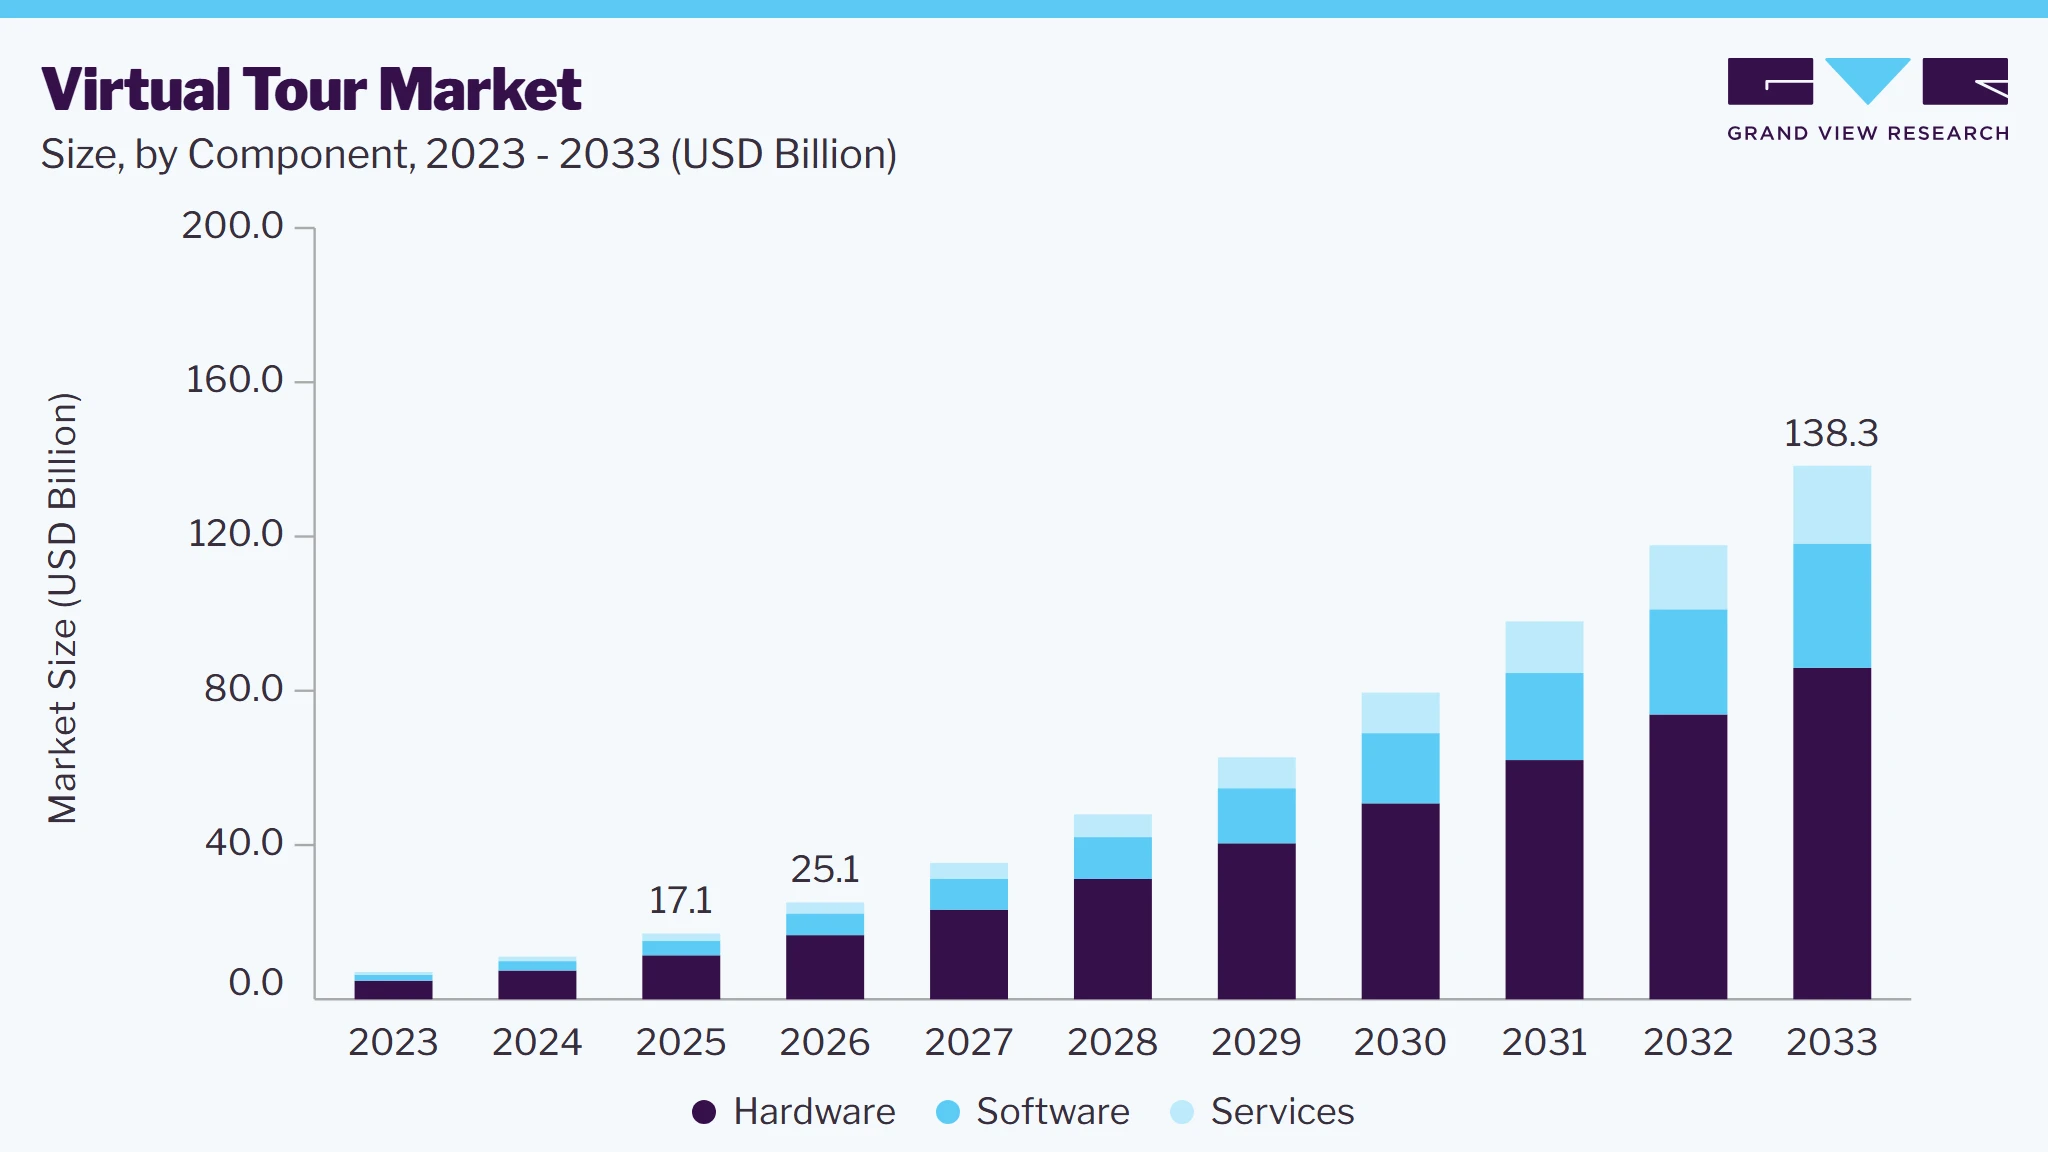 To learn more about this report, Download Free Sample Report
Advancements in virtual tour technology have significantly enhanced user experiences across various industries. The incorporation of VR and AR technologies has transformed virtual tours, offering immersive and interactive experiences. Users can now explore environments more engagingly, with applications ranging from real estate to tourism. Cloud technology has facilitated the creation, hosting, and sharing of virtual tours, making them more accessible and cost-effective. This shift enables businesses to reach a broader audience without significant infrastructure investments. Artificial intelligence and machine learning are also heavily integrated into virtual tours to provide personalized experiences. For instance, AI can analyze user interactions to offer tailored content, enhancing engagement and satisfaction. Thus, the growing focus on technological advancements is also supporting the growth of the virtual tour industry.
The proliferation of high-speed internet and the widespread use of smartphones have made virtual tours more accessible to a broader audience. This digitalization has facilitated the adoption of virtual tours across various industries. Furthermore, businesses are increasingly incorporating virtual tours into their marketing strategies to enhance customer engagement and decision-making. For instance, real estate professionals use virtual tours to provide potential buyers with immersive, 360-degree views of properties, enabling them to explore layouts and features remotely. Thus, the growing demand for virtual tours in their marketing strategies is also driving the growth of the virtual tour industry.
The growing concern for environmental sustainability has also boosted virtual tour adoption. By reducing the need for travel, virtual tours offer an eco-friendly solution to explore various places and locations. This aligns with the increasing push for green practices across industries. Virtual tours offer a cost-effective alternative to traditional in-person visits, which involve travel, accommodation, and other logistics. In sectors such as real estate and tourism, virtual tours allow customers to explore multiple locations remotely, saving time and money. Collectively, the growing demand for eco-friendly solutions and increasing adoption in the real estate and tourism sector is fueling the growth of the virtual tour industry.
Many governments around the world are promoting digital transformation as part of their economic development strategies. Policies that encourage digital infrastructure development, online education, remote working, and e-commerce indirectly drive the demand for technologies such as virtual tours, which provide immersive digital experiences. Different government programs offer financial support in the form of grants, subsidies, or tax breaks for businesses that adopt innovative technologies. Virtual tour industry offer solutions particularly in sectors such as tourism, education, and real estate, often qualify for such funding. This reduces the financial burden on smaller businesses and startups, enabling them to invest in creating high-quality virtual tours.
Market Dynamics
The virtual tour market is driven by rising demand for immersive digital experiences and remote visualization across real estate, tourism, education, museums, and commercial sectors. Advancements in 360° imaging, AI, cloud-based platforms, and digital twin technologies are enhancing virtual tour capabilities, while increasing digital transformation and enterprise adoption continue to create strong growth opportunities despite content creation costs and integration challenges.
Digital transformation initiatives across the real estate and tourism industries are significantly accelerating the adoption of virtual tour solutions. Property developers, real estate agencies, hotels, resorts, and travel operators are increasingly leveraging interactive 360° tours to provide remote access to properties and destinations, enabling customers to make informed decisions without the need for physical visits. Virtual tours have become effective marketing and customer engagement tool by improving transparency, expanding audience reach, and shortening the customer decision-making process.
Continuous advancements in 360° imaging, cloud-based hosting, AI-powered enhancements, and mobile accessibility have further improved the quality and scalability of virtual tour platforms. Growing consumer preference for digital-first interactions and remote visualization is encouraging organizations to integrate virtual tours into their sales, marketing, and customer service strategies, making digital engagement a key growth driver for the market.
The development of high-quality virtual tours often requires specialized equipment, professional photography, 3D scanning technologies, and skilled content creators, which can lead to relatively high implementation costs. Small and medium-sized businesses may face budget constraints when investing in advanced virtual tour platforms, particularly for large properties, cultural sites, or enterprise-scale facilities that require frequent content updates and maintenance.
Technical challenges associated with integrating virtual tours with existing websites, enterprise systems, and cloud platforms can further increase deployment complexity. Maintaining compatibility across multiple devices, ensuring high-resolution performance, and managing large volumes of digital assets also require ongoing technical expertise, limiting adoption among organizations with limited digital capabilities.
Rapid advancements in artificial intelligence, digital twin technology, and immersive visualization are creating significant opportunities for virtual tour solution providers. AI-powered image enhancement, automated tour creation, intelligent navigation, and personalized user experiences are improving content quality while reducing production time and operational costs. Digital twin integration is further expanding the use of virtual tours for asset management, facility monitoring, and remote collaboration across commercial and industrial environments.
Increasing adoption of augmented reality (AR), virtual reality (VR), and spatial computing technologies is expected to broaden the application scope of virtual tours beyond marketing into training, education, healthcare, retail, and smart city initiatives. Growing enterprise investment in immersive digital experiences, combined with expanding cloud infrastructure and mobile accessibility, is likely to create new revenue streams and support long-term market growth.
Market Concentration & Characteristics
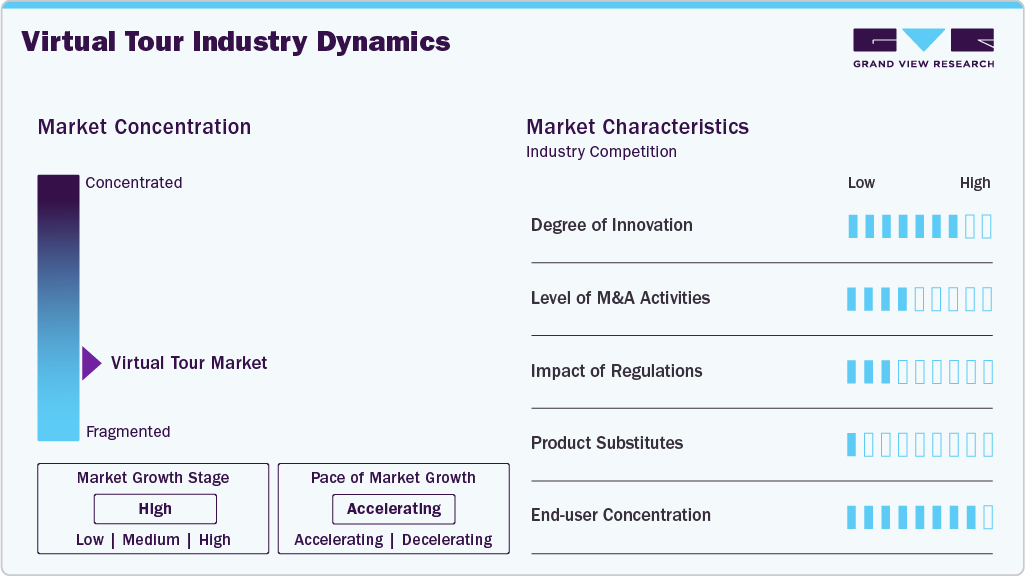
The virtual tour market is moderately fragmented, comprising dedicated virtual tour software providers, digital twin platform developers, 360° imaging solution providers, cloud-based hosting platforms, content creation agencies, and visualization technology companies. The market is driven by continuous advancements in 360° cameras, AI-powered image enhancement, digital twin technologies, cloud-based collaboration, 3D visualization, and virtual reality (VR) integration. Strategic partnerships, mergers, and acquisitions remain moderate, with companies expanding their capabilities through investments in AI-enabled content creation, cloud infrastructure, spatial visualization, and interactive virtual experience platforms to strengthen their market presence.
 To learn more about this report, Download Free Sample Report
Regulatory influence is moderate and primarily governed by data privacy regulations, cybersecurity requirements, digital content ownership, intellectual property rights, and accessibility standards for online platforms. Product substitution is low to moderate, as virtual tours provide interactive, remote, and immersive visualization capabilities that conventional photographs, videos, and static web content cannot fully replicate for applications such as property showcasing, tourism promotion, museum exhibitions, education, and facility management. Market demand is diversified across real estate, tourism & hospitality, museums & cultural institutions, education, retail, healthcare, and enterprise sectors, supported by growing digital transformation initiatives, increasing demand for remote engagement, rising adoption of cloud-based visualization platforms, and continuous innovation in immersive technologies.
Analyst Perspective
The virtual tour market is expected to witness robust growth over the forecast period, driven by the increasing adoption of immersive digital experiences across real estate, tourism, hospitality, education, and cultural institutions. The market is transitioning from a niche visualization tool to a mainstream digital engagement platform, supported by advancements in 360° imaging, digital twin technology, cloud-based deployment, and AI-enabled content creation.
Component Insights
Based on component, the hardware segment dominated the market with the largest revenue share of 66.8% in 2025, driven by factors such as the availability of cost-effective virtual reality hardware and the growing adoption of VR hardware to create virtual tours, including real estate, tourism, education, healthcare, and retail. Furthermore, continuous improvements in hardware performance, such as higher resolution displays and faster processing speeds, have enhanced the quality of virtual tours. These advancements contribute to a more seamless and realistic user experience and support the growth of this segment.
The services segment is expected to register the fastest CAGR of over 38% from 2026 to 2033. The growth of this segment is driven by the increasing need for innovative marketing strategies and the desire to offer interactive experiences to customers, the rising need for virtual tour services to boost customer engagement, and growing need to maintain customer engagement without physical interactions, supporting business continuity.
Technology Insights
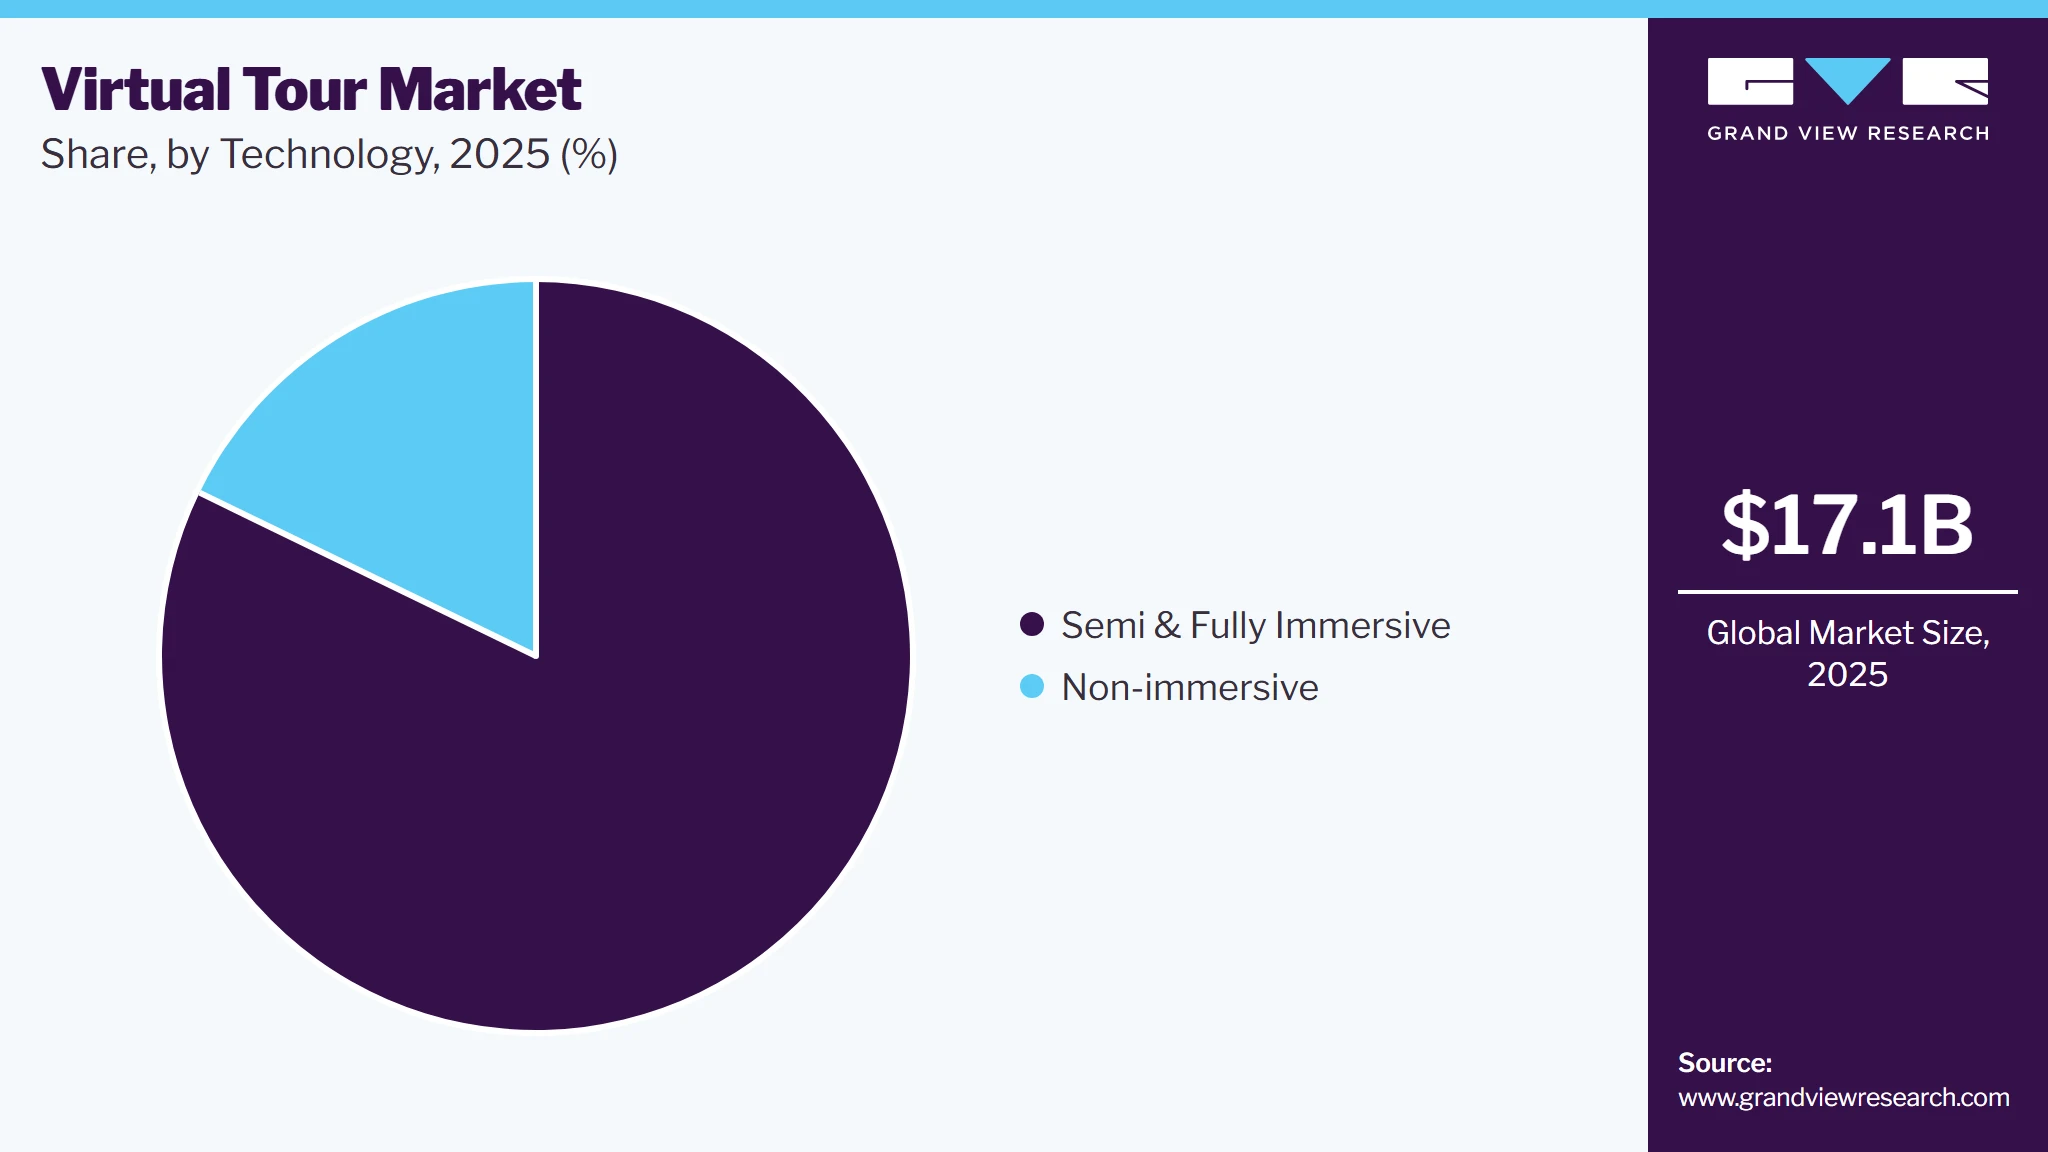
Based on technology, the semi & fully immersive segment led the market with the largest revenue share of 82.2% in 2025, owing to advancements in virtual reality (VR) and augmented reality (AR), a growing need for innovative marketing strategies, and the desire to provide interactive experiences to customers, and continuous improvements in VR and AR technologies for enhancing the quality and accessibility of virtual tours.
 To learn more about this report, Download Free Sample Report
The non-immersive segment is expected to witness a notable CAGR from 2026 to 2033, driven by the growing need to eliminate the need for expensive hardware, making virtual tours more accessible to a broader audience, growing demand for cost-effective solutions by small and medium-sized enterprises looking to offer virtual experiences without significant investment.
Application Insights
Based on application, the real estate segment led the market with the largest revenue share of 36.0% in 2025, owing to the increasing adoption of virtual tour software for 360-degree views of properties, allowing potential buyers to explore spaces remotely, rising demand for immersive and remote engagement solutions in real estate, and growing need to broaden the reach of property listings and allows for quicker decision-making.
The tourism & hospitality segment is expected to register the fastest CAGR from 2026 to 2033, driven by the growing need to experience destinations, hotels, resorts, and attractions remotely before booking, the growing need for more engaging and interactive ways to promote destinations and accommodations compared to still images or text descriptions, and increasing demand for customizable features, where users can control their experience.
Regional Insights
The North America virtual tour market is anticipated to grow at a CAGR of 35% from 2026 to 2033. This growth is attributed to the advanced technological infrastructure, widespread internet access, and high consumer interest in digital experiences. The availability of advanced 360-degree cameras, drones, and other imaging equipment has made it easier and more affordable for businesses to create professional-quality virtual tours. This has encouraged adoption across various industries such as real estate, tourism, and education. Furthermore, the real estate market in North America has seen a significant rise in the use of virtual tours, especially in residential and commercial property marketing. Virtual tour software allows potential buyers to remotely explore properties, reducing the need for in-person visits
U.S. Virtual Tour Market Trends
The virtual tour market in the U.S. held the largest share in the North America region in 2025. The market growth is fueled by the integration of advanced technologies such as Virtual Reality (VR) and Augmented Reality (AR), growing adoption by retailers for online shopping experiences, allowing customers to explore stores, view products, and interact with environments in a more immersive way. The U.S. has robust infrastructure for high-speed internet and the ongoing roll-out of 5G networks, which supports seamless virtual tour experiences. The U.S. real estate industry is one of the largest adopters of virtual tour software. Real estate agents and property developers use virtual tours to showcase homes, apartments, and commercial properties to potential buyers and renters, particularly in the post-pandemic era.
Asia Pacific Virtual Tour Market Trends
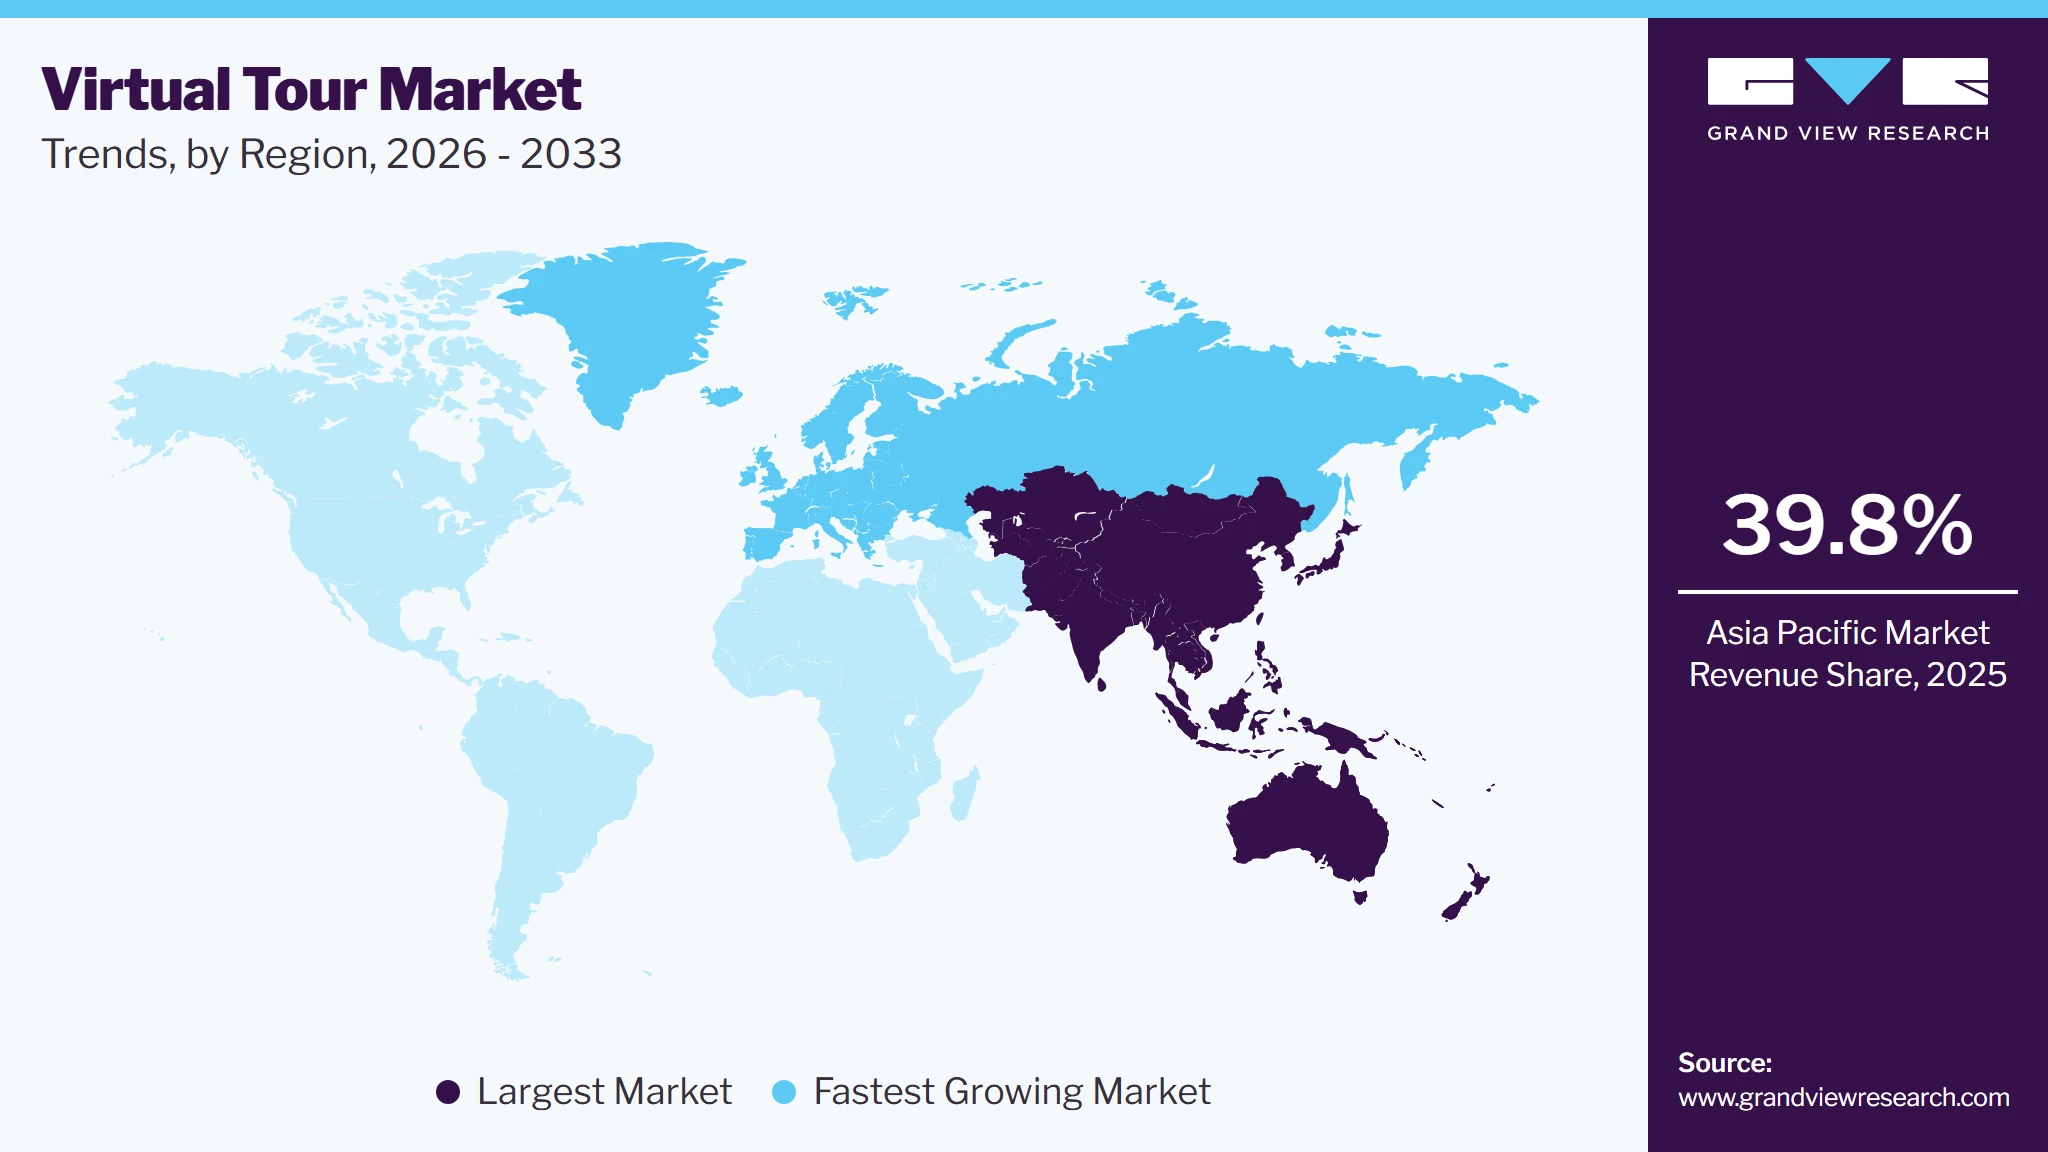
Asia Pacific dominated the virtual tour market, accounting for the largest revenue share of 39.8% in 2025, driven by rapid technological advancements and increasing internet connectivity, which support the expansion of immersive digital experiences. The region's diverse cultural heritage, historical landmarks, and natural attractions offer rich content for virtual tours. Rising consumer interest in digital and remote experiences, coupled with a growing middle class with disposable income, drives demand for virtual tours. Retailers in countries such as China, South Korea is increasingly incorporating virtual tours into their online platforms. Governments in countries such as Singapore, South Korea, and Japan are incorporating virtual tours into their smart city plans. These virtual experiences allow citizens and tourists to explore city landmarks, parks, and cultural venues digitally, promoting urban tourism and local culture.
 To learn more about this report, Download Free Sample Report
The Japan virtual tour market is expected to grow rapidly in the coming years due to growing adoption of virtual tour software by real estate agencies to provide potential buyers with immersive property viewings, enhancing the buying experience and reaching a broader audience, increasing need for virtual tour software by hospitality providers are adopting virtual tours to showcase destinations and cultural sites, offering immersive experiences to potential visitors, and growing demand by retailers to explore products in an interactive environment.
The virtual tour market in the China held the largest share in 2025. The growth is attributed to advancements in digital technologies and a tech-savvy population, widespread use of mobile internet, and adoption of virtual tour software to showcase products, creating interactive online shopping environments that boost engagement.
Europe Virtual Tour Market Trends
The virtual tour industry in the Asia Pacific is anticipated to grow at the fastest CAGR from 2026 to 2033, driven by the adoption of virtual tour software to offer immersive previews of destinations, enhance traveler engagement, and aid in trip planning, virtual tour software to provide potential buyers and renters with comprehensive property views remotely, streamlining the property selection process, and growing technological innovations and a consumer base for adopting virtual tour software.
The UK virtual tour market is expected to grow rapidly in the coming years. In the UK, virtual tour demand is rising due to the growing adoption of virtual reality (VR) and augmented reality (AR) to improve customer experiences and transform the design and development of new buildings and spaces, and rising demand for immersive and remote engagement solutions.
The Germany virtual tour market held a substantial market share in 2024, driven by advancements in virtual reality (VR) and augmented reality (AR) technologies, as well as increasing consumer interest in immersive experiences and a growing need to provide immersive previews of destinations and cultural sites.
Key Virtual Tour Company Insights
Some of the key players operating in the market include Matterport Inc., and Kuula LLC among others.
-
Matterport Inc. is a provider of 3D spatial data and virtual tour technologies. The company specializes in creating digital twins of real-world spaces, transforming how physical environments are captured, explored, and shared virtually. The company has a strong reputation for offering advanced 3D modeling and immersive virtual tour capabilities that span several industries, such as real estate, construction, hospitality, and retail. Matterport offers proprietary 3D cameras, such as the Pro2 and Pro3, as well as the ability to capture virtual tours using mobile devices or other 360-degree cameras. The company also provides accessories for enhanced data capture. Matterport's software suite enables users to create, manage, and interact with 3D digital models of physical spaces. Their Matterport Cloud platform allows for seamless uploading, editing, and sharing of virtual tours.
-
Kuula LLC specializes in providing virtual tour creation tools, allowing users to create, share, and interact with 360-degree photos and virtual tours. The platform is designed to cater to both individual users and businesses in various industries. Kuula offers a web-based platform for creating and publishing interactive virtual tours using 360-degree images. Users can upload their own 360-degree photos or capture new content using 360-degree cameras. The company offers different pricing tiers, from a free version for personal use to more advanced features for businesses and professionals, with enhanced customization, cloud storage, and higher-quality images.
Roundme Limited and CloudPano are some of the emerging participants in the virtual tour industry.
-
Roundme specializes in providing a platform for creating and sharing immersive 360-degree photos and virtual tours. The company enables users to build interactive virtual experiences for a variety of applications, including real estate, tourism, photography, and events. Roundme offers an intuitive platform for creating immersive 360-degree virtual tours. Users can upload their 360-degree images and link them together to form a virtual experience. The company provides hosting for virtual tours, allowing users to easily share their creations via embedded links or social media. The company supports both public and private virtual tours, offering a flexible solution for personal or commercial use.
-
CloudPano is a platform designed to provide businesses and individuals with an easy and affordable way to create and share virtual tours using 360-degree photos. The company specializes in simplifying the process of building, hosting, and sharing virtual tours, particularly in the real estate, hospitality, and small business sectors. The company provides a user-friendly platform that allows users to create virtual tours from 360-degree photos. CloudPano provides cloud hosting for virtual tours, enabling users to easily share their tours with clients, prospects, or on websites. It also offers the ability to embed virtual tours into third-party websites, enhancing visibility.
Key Virtual Tour Companies:
The following key companies have been profiled for this study on the virtual tour market.
-
Matterport Inc.
-
Kuula LLC
-
RTV, Inc.
-
Concept3D, Inc.
-
Roundme Limited
-
Invision Studio, Inc.
-
Eye Revolution Ltd.
-
TourVista
-
CloudPano
-
Eyespy360
Competitive Benchmarking
Category
Operating Strategies
Competitive Edge
Weakness
Established Players (Matterport Inc., Kuula LLC, Concept3D, Inc., Roundme Limited, CloudPano)
- These companies focus on expanding cloud-based virtual tour platforms through continuous software innovation, AI-enabled digital twin technologies, 3D capture solutions, and scalable SaaS subscription models.
- Their strategies emphasize strategic partnerships with real estate firms, hospitality providers, educational institutions, and enterprises, while enhancing interoperability, cloud hosting, analytics, and mobile accessibility to strengthen customer engagement.
- Established players benefit from strong brand recognition, comprehensive virtual tour ecosystems, robust cloud infrastructure, extensive customer bases, and advanced 3D visualization capabilities.
- Their subscription-based business models, global distribution networks, and integration with CRM, GIS, and property management platforms enable them to maintain leadership across multiple end-use industries.
- High investments in platform development, cloud infrastructure, and continuous feature enhancements increase operational costs.
- Dependence on subscription revenue, competitive pricing pressure, and the need for ongoing technology upgrades may affect profitability.
Emerging & Specialized Players (RTV, Inc., Invision Studio, Inc., Eye Revolution Ltd., TourVista, Eyespy360)
- These companies focus on niche virtual tour solutions, including customized 360° tours, virtual tourism experiences, enterprise-specific deployments, and white-label virtual tour platforms.
- Their strategies emphasize industry-specific customization, flexible pricing, rapid product innovation, and partnerships with local businesses, agencies, and service providers to expand market presence.
- Specialized players gain competitive advantages through agile product development, customized solutions, flexible deployment models, and strong expertise in specific verticals such as tourism, hospitality, education, and commercial real estate.
- Their ability to rapidly respond to customer requirements enables faster implementation and greater service flexibility.
- Compared with established vendors, these companies generally have smaller customer bases, limited global presence, lower financial resources, and less extensive ecosystems.
- Their growth is often dependent on regional expansion, strategic partnerships, customer acquisition, and increasing adoption of virtual tour technologies across commercial sectors.
Recent Developments
-
In January 2024, Planitar Inc. launched iGUIDE Instant, a solution designed to transform the real estate photography industry by offering an affordable and fast way to generate 3D virtual tours and interactive floor plans. This solution is aimed at real estate photographers, enabling them to quickly produce high-quality virtual tours and floor plans, often within minutes of capturing property data.
-
In July 2023, RTV Inc. launched a new subscription-based pricing model. This flexible pricing structure is particularly beneficial for real estate agents and brokers, allowing them to choose plans that align with their specific needs and budgets, thereby making virtual tours more accessible and cost-effective for professionals in the industry.
-
In February 2023, Matterport Inc. launched Digital Pro, an all-in-one marketing solution for real estate agents. Matterport’s 3D digital twin technology allows real estate professionals to create virtual models of properties, enabling prospective buyers to explore and interact with listings remotely. This immersive experience provides a detailed, realistic view of properties, helping buyers make informed decisions without having to visit in person.
Virtual Tour Market Report Scope
Report Attribute
Details
Market size in 2025
USD 17.1 billion
Estimated market size in 2026
USD 25.1 billion
Projected market size by 2033
USD 138.3 billion
Growth rate
CAGR of 27.6% from 2026 to 2033
Base year for estimation
2025
Historical data
2021 - 2024
Forecast period
2026 - 2033
Quantitative units
Revenue in USD million and CAGR from 2026 to 2033
Report coverage
Revenue forecast, company ranking, competitive landscape, growth factors, and trends
Segments covered
Component, technology, application, region
Regional scope
North America, Europe, Asia Pacific, Latin America, MEA
Country scope
U.S., Canada, Mexico, UK, Germany, France, China, Japan, India, South Korea, Australia, Brazil, South Africa, Saudi Arabia, UAE
Key companies profiled
Matterport Inc.; Kuula LLC; RTV, Inc.; Concept3D, Inc.; Roundme Limited; Invision Studio, Inc.; Eye Revolution Ltd.; TourVista; CloudPano; Eyespy360
Customization scope
Free report customization (equivalent up to 8 analysts' working days) with purchase. Addition or alteration to country, regional & segment scope.
Pricing and purchase options
Avail customized purchase options to meet your exact research needs. Explore purchase options
Global Virtual Tour Market Report Segmentation
This report forecasts revenue growth at global, regional, and country levels and provides an analysis of the latest technology trends in each of the sub-segments from 2021 to 2033. For this study, Grand View Research has segmented the global virtual tour market report based on component, technology, application, and region:
 To learn more about this report, Download Free Sample Report
-
Component Outlook (Revenue, USD Million; 2021 - 2033)
-
Hardware
-
Software
-
Services
-
-
Technology Outlook (Revenue, USD Million; 2021 - 2033)
-
Non-immersive
-
Semi & Fully Immersive
-
-
Application Outlook (Revenue, USD Million; 2021 - 2033)
-
Real Estate
-
Tourism & Hospitality
-
Art Galleries and Museums
-
Others
-
-
Regional Outlook (Revenue, USD Million; 2021 - 2033)
-
North America
-
U.S.
-
Canada
-
Mexico
-
-
Europe
-
UK
-
Germany
-
France
-
-
Asia Pacific
-
China
-
India
-
Japan
-
Australia
-
South Korea
-
-
Latin America
-
Brazil
-
UAE
-
-
Middle East & Africa
-
Saudi Arabia
-
South Africa
-
-
Research Methodology
The virtual tour market figures in this report are based on a proven research process that combines executive interviews with secondary research from proprietary databases, company filings, and recognized regulatory and institutional sources. Market size is built through value-chain sizing - reconciling supply-side and demand-side estimates - and triangulated with bottom-up and top-down approaches. Every estimate passes multiple levels of expert validation before publication, with each virtual tour segment quantified using the revenue-capture definitions in the table below.
Segment Definition
Segment - Component
Revenue capture definition
Hardware
Revenue is generated through the sale of 360° cameras, VR headsets, LiDAR scanners, drones, imaging devices, and other hardware used for capturing and viewing virtual tours.
Software
Revenue is generated through software licensing, subscription fees, and cloud-based platforms for creating, editing, hosting, managing, and sharing virtual tours and 3D digital experiences.
Services
Revenue is generated through professional services including virtual tour creation, 3D scanning, photography, customization, system integration, consulting, training, and maintenance.
Segment - Technology
Revenue capture definition
Non-Immersive
Revenue is generated through web-based and mobile virtual tour solutions that allow users to explore digital environments using standard screens without requiring VR/AR devices, including 360° walkthroughs, interactive maps, and panoramic views.
Semi & Fully Immersive
Revenue is generated through immersive virtual tour solutions using VR headsets, augmented reality (AR), mixed reality (MR), interactive 3D environments, and spatial technologies that provide enhanced user engagement and realistic digital experiences.
Segment - Application
Revenue capture definition
Real Estate
Revenue is generated through virtual property tour solutions used by real estate developers, agents, and property owners for digital property showcasing, remote viewing, 3D walkthroughs, floor-plan visualization, and marketing platforms.
Tourism & Hospitality
Revenue is generated through virtual experiences developed for hotels, resorts, travel destinations, attractions, and tourism operators to promote locations, enable remote exploration, and enhance customer engagement.
Art Galleries and Museums
Revenue is generated through digital exhibition platforms, virtual museum tours, 3D artifact visualization, online cultural experiences, and immersive solutions that enable remote access to collections and heritage sites.
Others
Revenue is generated through virtual tour applications across sectors such as education, healthcare, retail, automotive, architecture, construction, manufacturing, and corporate training for digital visualization, simulation, and remote engagement purposes.
Estimation Model
Layer Name
Key Question
Description
Content Capture & Virtual Tour Creation Layer
How are virtual tours captured and created?
Represents the technologies and tools used to capture, create, and process virtual tour content. Includes 360° cameras, drones, LiDAR scanners, DSLR cameras, photogrammetry software, 3D modeling tools, image stitching software, digital twin technologies, AI-powered image enhancement, and virtual tour authoring platforms that enable the creation of interactive and immersive virtual experiences.
Industry Application & End-User Layer
Where are virtual tours deployed and which industries drive demand?
Represents the industries adopting virtual tour solutions to enhance customer engagement and operational efficiency. Major end users include real estate, tourism & hospitality, museums & art galleries, education, retail, healthcare, construction, and corporate enterprises. Virtual tours are used for property showcasing, destination marketing, virtual exhibitions, campus tours, facility walkthroughs, remote inspections, and digital customer experiences.
Technology, Deployment & Experience Delivery Layer
How are virtual tours delivered to end users?
Covers the technologies and deployment models used to deliver virtual tours. Includes non-immersive 360° web tours, VR-enabled immersive experiences, AR-enhanced interactive tours, cloud-based hosting platforms, mobile applications, browser-based viewing, digital twin platforms, and cross-device accessibility through smartphones, tablets, desktops, and VR headsets.
Revenue Generation & Market Monetization Layer
How is revenue generated in the virtual tour market?
Revenue is generated through the sale of 360° cameras and imaging hardware, software licensing and subscription fees for virtual tour creation and hosting platforms, cloud storage services, custom virtual tour development, professional photography and 3D scanning services, content hosting and maintenance, system integration, consulting, training, and managed virtual tour solutions for real estate, tourism, cultural institutions, education, retail, and enterprise customers.
Delivered Customizations
This report has been delivered with the following In-depth customizations
Client Request
Customization Delivered
Value Adds
Market Sizing, Segmentation & Growth Opportunity Assessment
Assessed the global virtual tour market size, historical performance, forecast growth trends, and detailed segmentation by component (hardware, software, and services), technology (non-immersive and semi & fully immersive), and application (real estate, tourism & hospitality, art galleries & museums, and others). The analysis evaluated adoption trends, technology advancements, and demand across commercial, institutional, and enterprise applications.
Supports strategic investment decisions, identifies high-growth application and technology segments, enables prioritization of product development initiatives, and helps stakeholders capitalize on the growing demand for immersive digital experiences and remote engagement solutions.
Competitive Landscape & Strategic Positioning Analysis
Benchmarked leading virtual tour solution providers based on virtual tour creation platforms, digital twin capabilities, cloud hosting, 3D visualization technologies, AI-enabled content generation, platform scalability, pricing models, strategic partnerships, geographic presence, and innovation initiatives. The assessment also evaluated competitive differentiation, product portfolios, and expansion strategies across key end-use industries.
Enables competitive benchmarking, identifies technology and capability gaps, supports partnership and acquisition strategies, strengthens market positioning, and helps companies align product offerings with evolving customer requirements across real estate, tourism, education, and enterprise markets.
Regional Market Demand & Industry Adoption Analysis
Analyzed regional market dynamics across North America, Europe, Asia Pacific, Latin America, and the Middle East & Africa by evaluating digital transformation initiatives, internet and cloud adoption, tourism recovery, real estate digitization, enterprise technology investments, and the adoption of virtual visualization solutions across key industries.
Supports regional expansion planning, identifies high-growth markets, enables localization strategies, guides investment decisions, and helps companies optimize market entry, customer acquisition, and commercialization strategies based on regional demand and technology adoption trends.
Frequently Asked Questions About This Report
Some key players operating in the virtual tour market include Matterport Inc., Kuula LLC, RTV, Inc., Concept3D, Inc., Roundme Limited, Invision Studio, Inc., Eye Revolution Ltd., TourVista, CloudPano, Eyespy360
The significant growth of the virtual tour market is attributed to the advancements in technology and the increasing demand for immersive, remote engagement solutions. Additionally, the proliferation of high-speed internet and the widespread use of smartphones have made virtual tours more accessible to a broader audience. This digitalization has facilitated the adoption of virtual tours across various industries.
The hardware segment accounted for the largest market share of 66.8% in 2025 while services segment is expected to be the fastest-growing market.
The semi & fully immersive segment led the market with a share of 82.2% in 2025, owing to advancements in virtual reality (VR) and augmented reality (AR), a growing need for innovative marketing strategies, and the desire to provide interactive experiences to customers, and continuous improvements in VR and AR technologies for enhancing the quality and accessibility of virtual tours.
The real estate segment dominated the market with the largest revenue share of 36.0% in 2025 and tourism & hospitality segment is second fastest growing market
Europe is the fastest-growing region over the forecast period.
Asia Pacific dominated the virtual tour market with a share of over 39% in 2025.
The global virtual tour market size was valued at USD 17.1 billion in 2025 and is estimated at USD 25.1 billion for 2026.
The global virtual tour market is expected to grow at a CAGR of 27.6% from 2026 to 2033, reaching USD 138.3 billion by 2033.
About the Author(s)
Next Generation Technologies Research Team
Technology · Next Generation TechnologiesThis report was authored by the next generation technologies research team at Grand View Research - comprising two research analysts, one senior research analyst, and one industry expert - with specialized expertise in the next generation technologies segment of the technology industry. All findings are based on proprietary technology databases, executive interviews, and regulatory analysis, subject to internal peer review prior to publication.
Last Updated:
Speak to Analyst

Customize this report to your needs - add regions, segments, or data points, with 20% free customization.
Or view our licence options:


ISO 9001:2015 & 27001:2022 Certified
We are GDPR and CCPA compliant! Your transaction & personal information is safe and secure. For more details, please read our privacy policy.


