
- Home
- »
- Renewable Chemicals
- »
-
Zero-Waste Chemical Manufacturing Market Report, 2033GVR Report cover
![Zero-Waste Chemical Manufacturing Market (2026 - 2033)Report]()
Zero-Waste Chemical Manufacturing Market (2026 - 2033)
Size, Share & Trends Analysis Report By Solution (Waste Prevention & Process Optimization, Chemical, Solvent & Catalyst Recovery, By Product Recovery & Valorization), By End Use, By Region, And Segment Forecasts
Market Size, 2025
$44.8BMarket Estimate, 2026
$49.8BMarket Forecast, 2033
$104.7BCAGR, 2026–2033
11.2%Zero Waste Chemical Manufacturing Market Summary
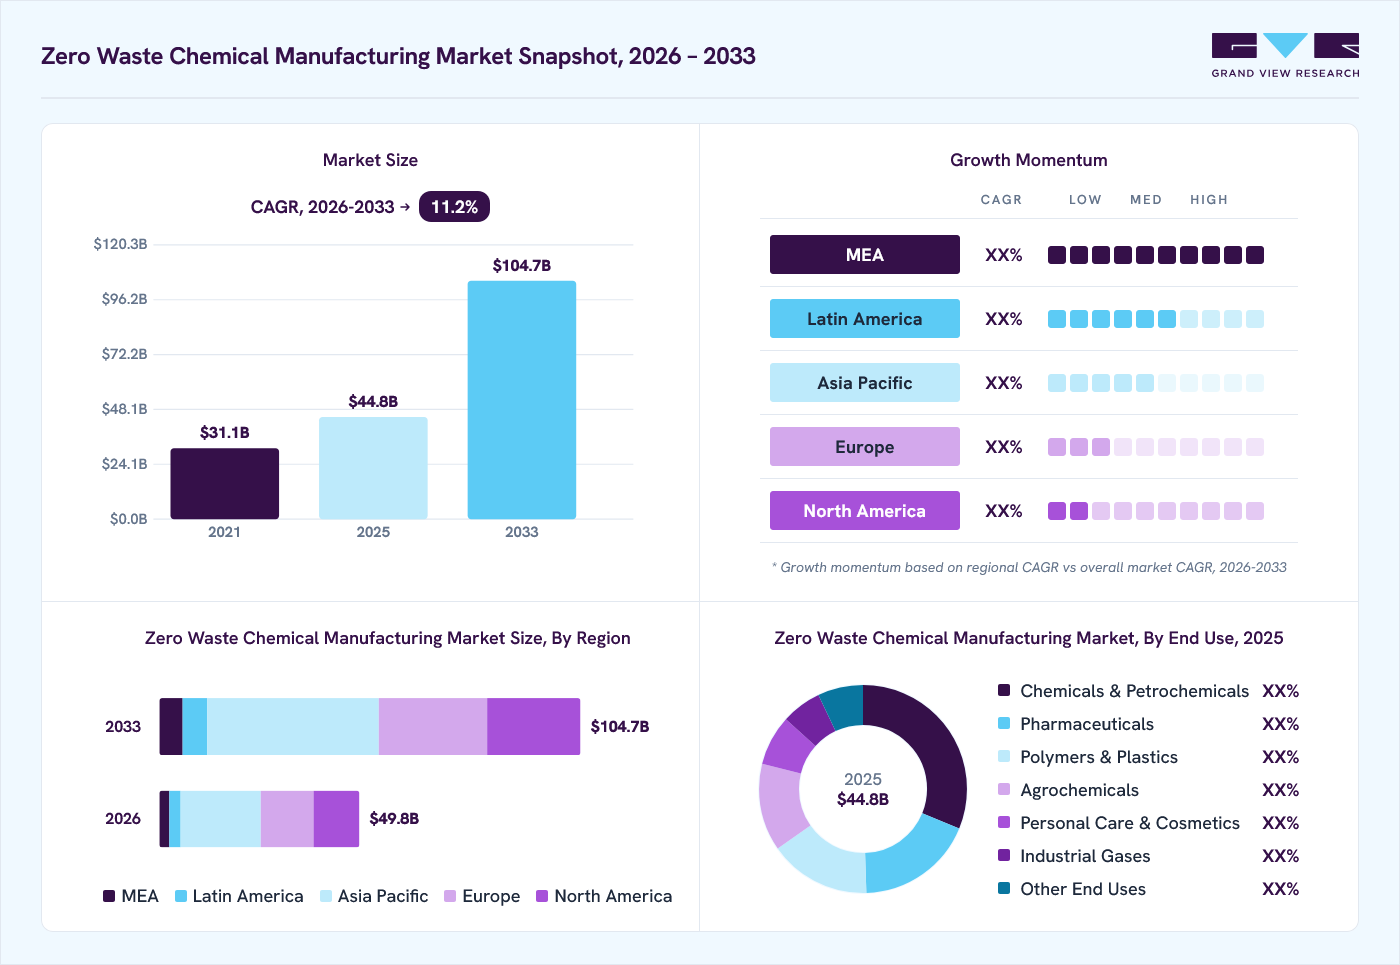
The global zero-waste chemical manufacturing market size was valued at USD 44.8 billion in 2025 and is projected to grow from USD 49.8 billion in 2026 to USD 104.7 billion by 2033, at a CAGR of 11.2% from 2026 to 2033. Asia Pacific dominated the market, accounting for a revenue share of 39.9% in 2025. Growing industrial focus on reducing material losses, treatment costs, and hazardous waste is encouraging chemical manufacturers to redesign production processes around resource efficiency. Companies are integrating process controls, recovery systems, and closed-loop material flows into manufacturing operations.
Key Market Trends & Insights
- By solution: Waste prevention & process optimization segment held the dominating revenue share of 27.6% in 2025.
- By end use: Chemicals & petrochemicals segment represented the largest application in the market, capturing a 31.2% share in 2025.
Regional Highlights
- Largest Regional Market: Asia Pacific (39.9% revenue share, 2025)
- Fastest-growing Regional Market: Middle East & Africa (highest CAGR, 2026-2033)
- By Country: China held the largest share in 2025
Market Size & Forecast
- Market size in 2025: USD 44.8 billion
- Estimated market size in 2026: USD 49.8 billion
- Projected market size by 2033: USD 104.7 billion
- CAGR (2026-2033): 11.2%
Three ways to get this report
Buy it, customize it, or ask a question.Get the Full Report
What the study covers
- FormatsPDF · Excel · Dashboard
- Timeline2026–2033 annual, 2025 base
- Coverage20+ countries, 5 regions
- Companies10+ key players profiled
Customize the Report
20% free customization
- IncludeCountries, segments, points
- TailorTo your product definition
- ExtendDeeper competitor detail
- OrA fully bespoke study
- Turnaround5–10 working days
Ask Prism AI
A cited answer in seconds
- Corpus30K studies, 1.2M points
- ScopeAll markets, not just this
- CitationTraced to report & table
- HonestySays "not covered" if so
- SpeedSeconds, not days
This shift is particularly relevant for large-volume chemical production, where small reductions in raw material consumption or waste generation can produce meaningful operating-cost benefits. The integration of digital process monitoring, advanced separation, solvent recovery, and industrial symbiosis creates opportunities to convert previously discarded streams into usable feedstocks.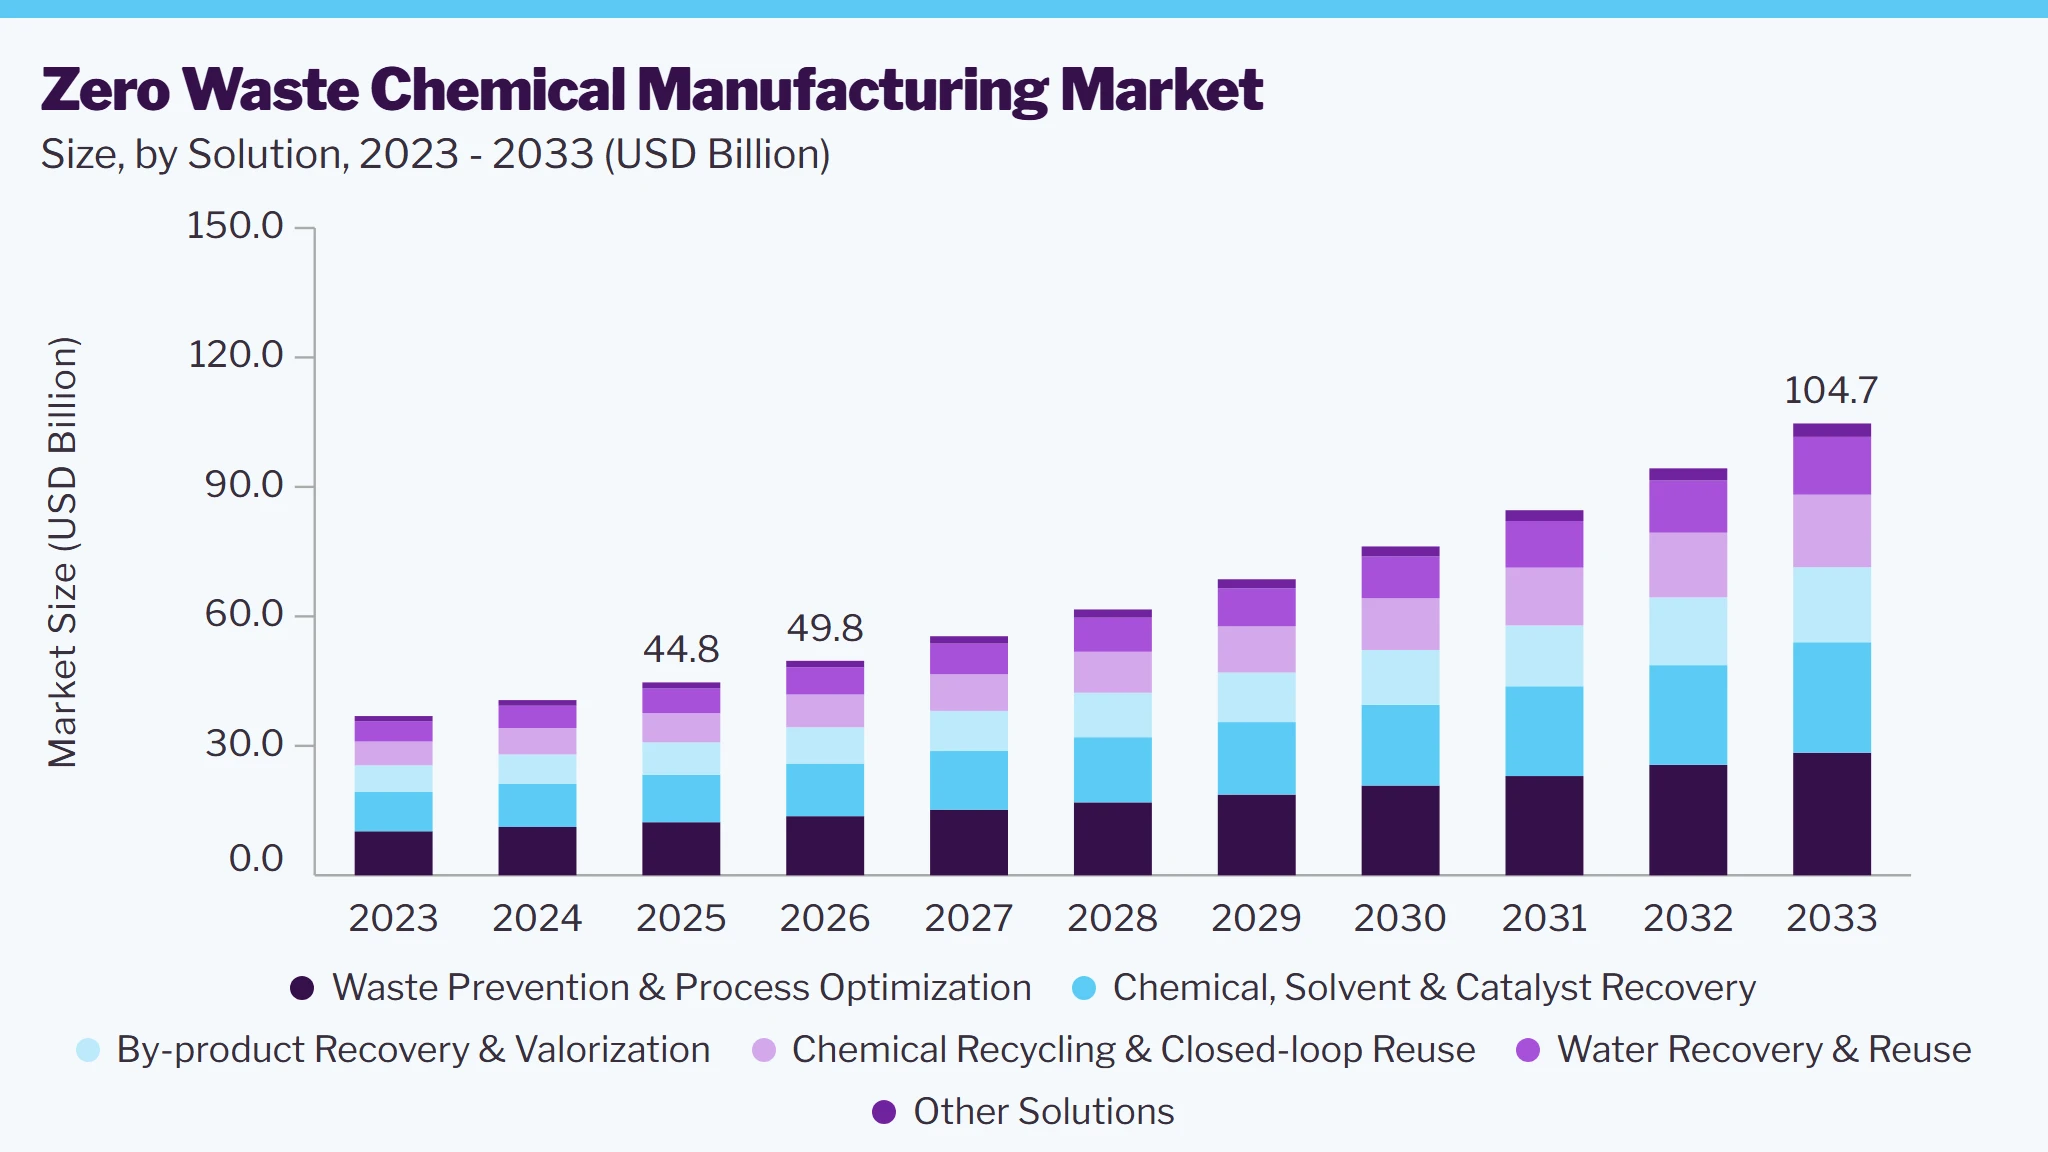
Increasing availability of process data also allows manufacturers to identify waste-generation points and optimize material utilization continuously.
Market Dynamics
Zero-waste chemical manufacturing is moving from a waste-treatment approach toward waste avoidance and resource recovery at the production stage. Regulatory pressure, resource-security concerns, and decarbonization targets are strengthening adoption, while high retrofit costs and technology complexity remain key barriers. The market is therefore evolving through a combination of process optimization, recovery technologies, and circular feedstock integration.
Chemical producers are placing greater emphasis on maximizing raw-material conversion and minimizing yield losses because feedstock represents a significant component of manufacturing economics. Process intensification, automation, and real-time monitoring can improve conversion efficiency while reducing off-specification production. The commercial benefit extends beyond waste reduction. Lower material consumption, reduced wastewater treatment requirements, and improved production yields can strengthen plant economics and increase the attractiveness of zero-waste manufacturing investments.
Transitioning conventional chemical plants toward closed-loop operations can require new separation units, recovery equipment, digital controls, storage systems, and waste-processing infrastructure. These investments can be difficult to justify for older facilities with limited remaining operating life. Technology compatibility is another constraint. Recovered materials may require additional purification before re-entering production, increasing energy consumption and potentially offsetting part of the economic benefit.
Chemical clusters provide an opportunity to exchange by-products, recovered solvents, heat, water, and other secondary resources between neighboring facilities. This approach can reduce disposal volumes while creating additional revenue streams from materials previously treated as waste. The opportunity is particularly attractive in integrated industrial zones where multiple manufacturers generate complementary waste streams. Better material-tracking systems can further improve matching between waste generators and potential users.
Market Concentration & Characteristics
The industry remains moderately fragmented, with large chemical producers developing proprietary process-efficiency and circularity programs alongside specialist technology providers offering recovery, recycling, separation, and waste-minimization solutions.
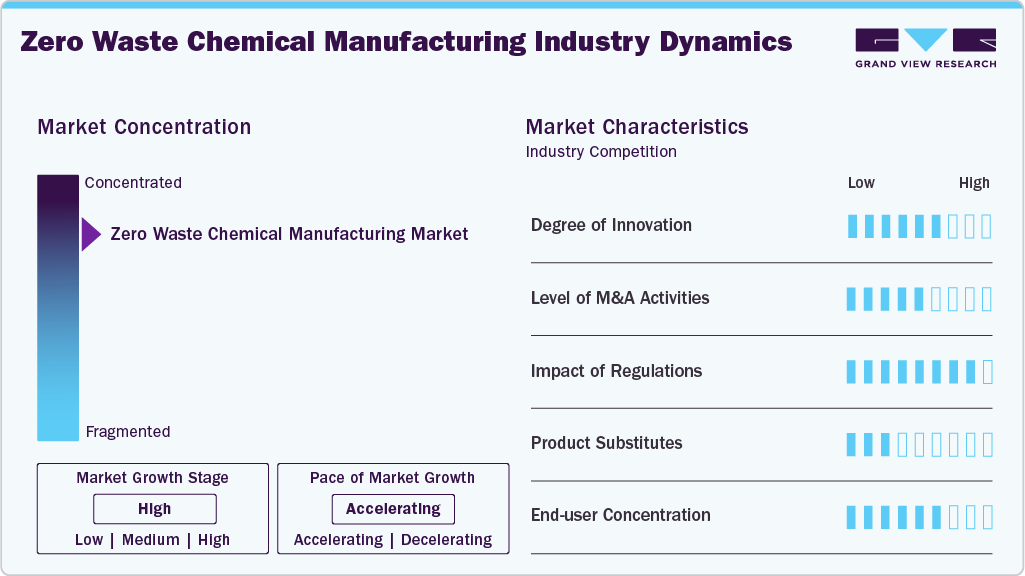
Market characteristics vary significantly by manufacturing process. Adoption is generally stronger in integrated chemical clusters and large production facilities because these sites have sufficient waste volumes and infrastructure to support economically viable recovery systems.
Analyst Perspective
The market is shifting toward preventing waste at source rather than managing waste after generation. Process optimization is expected to remain commercially important, while higher-value recovery and circular technologies should gain traction as feedstock costs, regulatory requirements, and sustainability-linked investment criteria increasingly influence plant-level decisions.
Solution Insights
The waste prevention & process optimization segment accounted for 27.6% of the market in 2025, because manufacturers can capture immediate economic benefits by improving process yields, reducing raw-material losses, lowering off-specification output, and optimizing energy and water consumption. Existing plants can also adopt optimization measures without completely replacing their production infrastructure.
The chemical recycling & closed-loop reuse segment is the fastest-growing solution segment, with a projected CAGR of 11.9% from 2026 to 2033. These solutions can return difficult-to-recycle materials and production residues into higher-value chemical feedstocks. Regulatory developments around recycled-content accounting are also improving the investment case for chemical recycling.
End Use Insights
The chemicals & petrochemicals segment held the largest revenue share of 31.2% in 2025, supported by their large production volumes and continuous generation of solvents, intermediates, off-specification materials, process residues, and other recoverable streams. The scale of these operations provides a stronger economic justification for integrated waste-minimization systems.
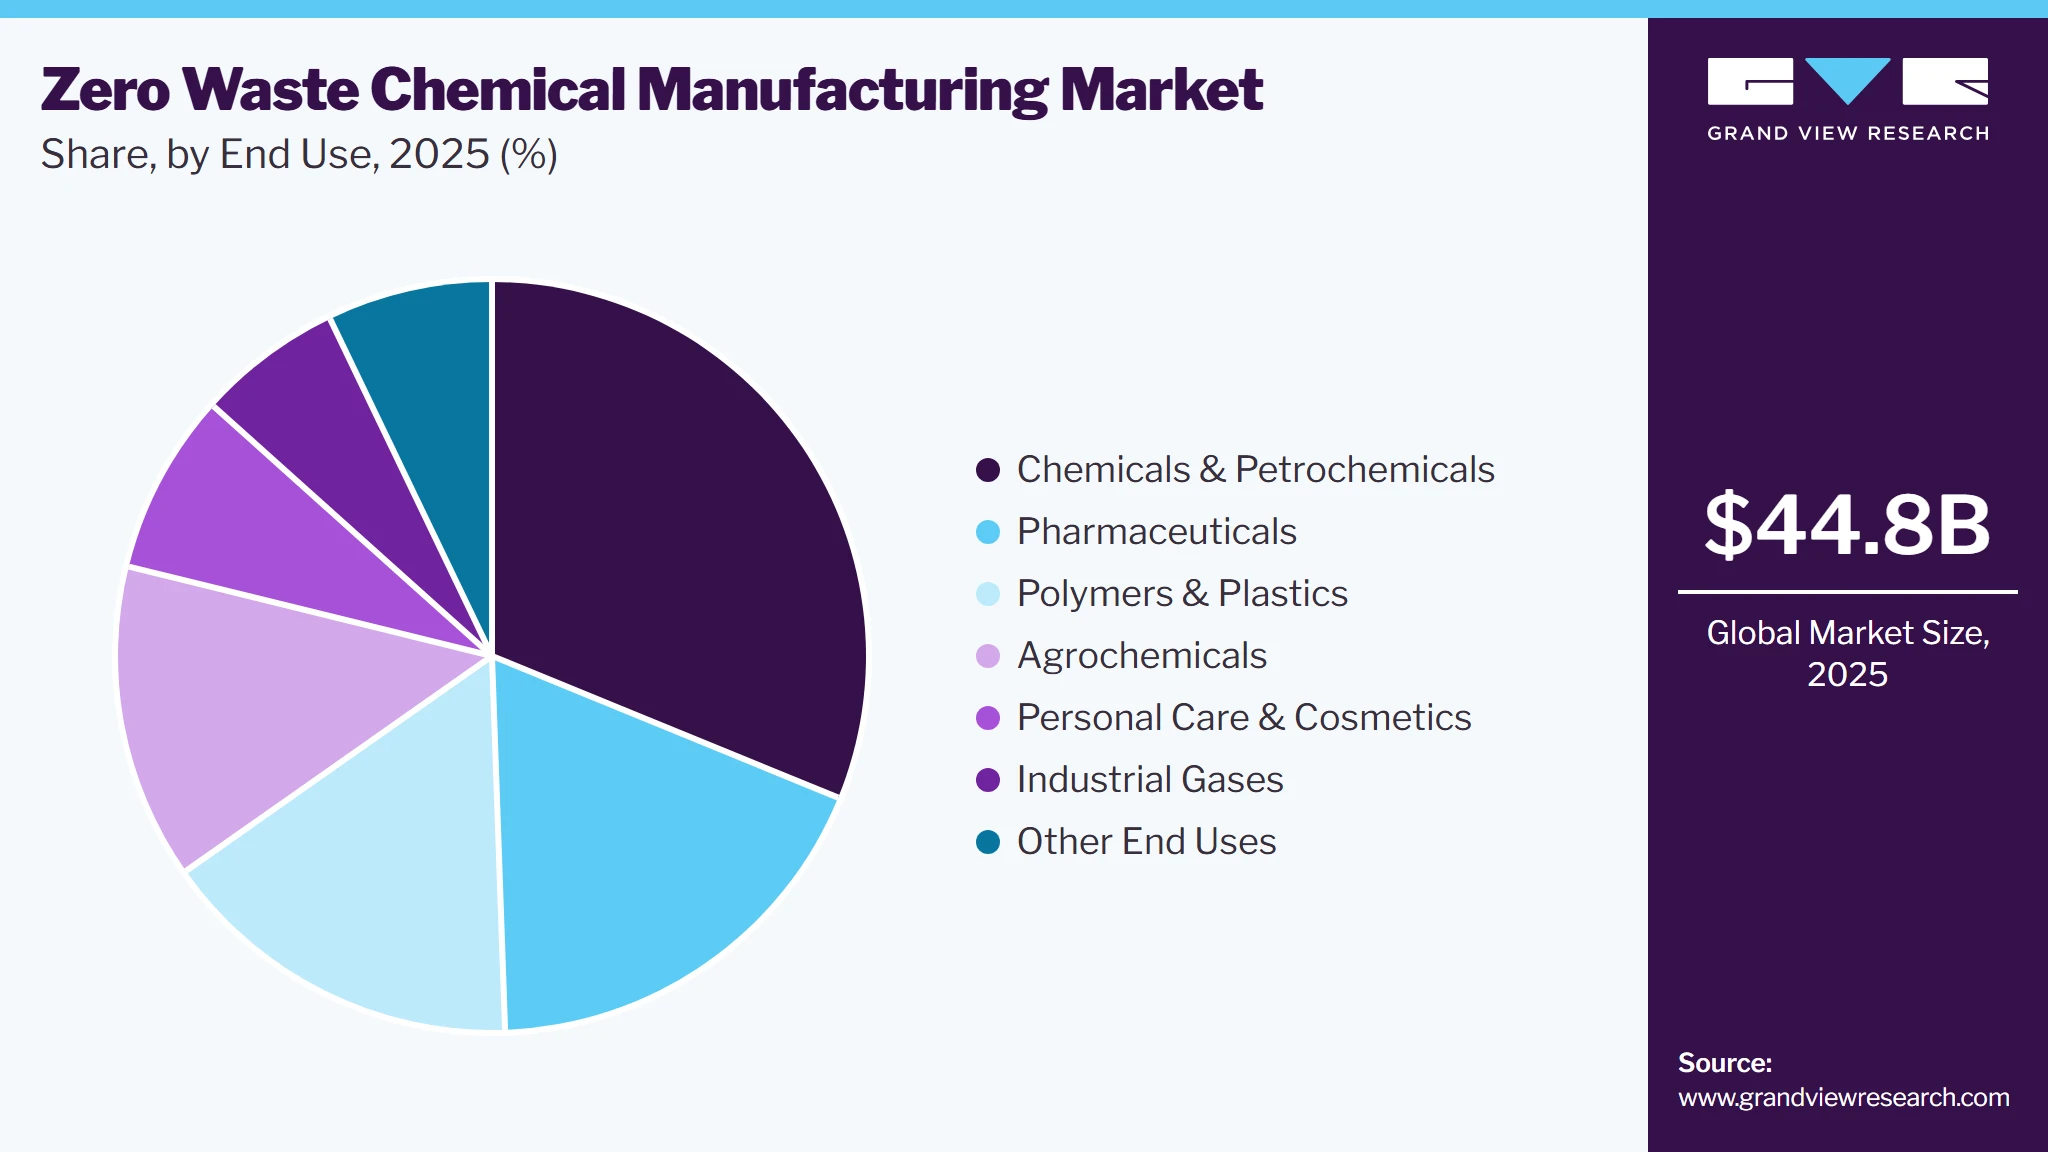
The polymers & plastics segment is projected to grow with a CAGR of 11.9% from 2026 to 2033, as manufacturers face increasing pressure to incorporate recycled feedstocks and improve circular material flows. Chemical recycling is particularly relevant for polymer waste that is difficult to process through conventional mechanical recycling, creating additional demand for advanced recovery technologies.
Regional Insights
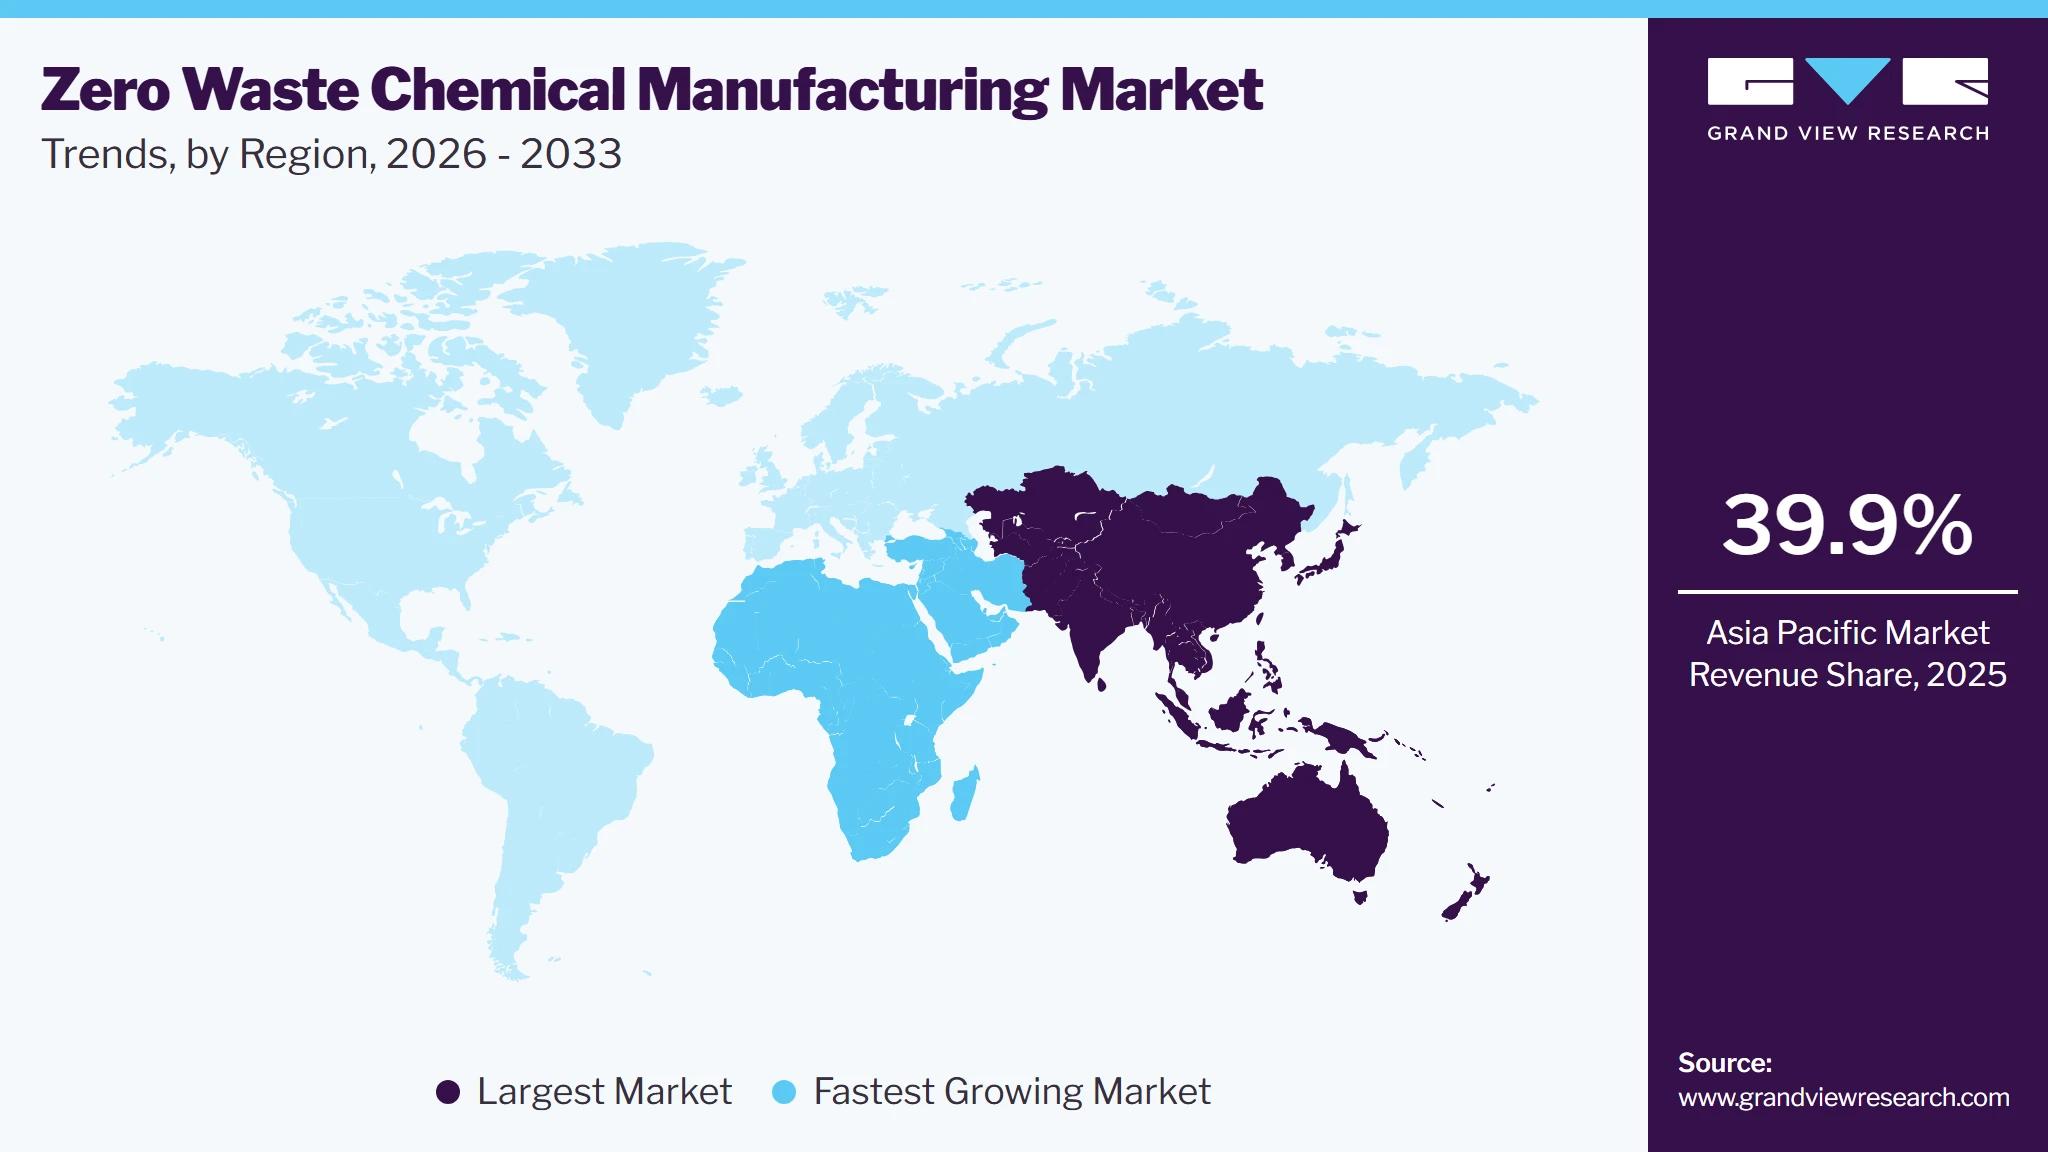
The Asia Pacific zero-waste chemical manufacturing market held the largest revenue share of 39.9% in 2025, due to its extensive chemical and petrochemical manufacturing base, high production volumes, and rapidly expanding industrial recycling infrastructure. Large manufacturing clusters provide favorable conditions for integrated resource recovery and industrial symbiosis.
China Zero-Waste Chemical Manufacturing Market Trends
The zero-waste chemical manufacturing market in China is growing as its large chemical manufacturing ecosystem, and government emphasis on waste-resource utilization, support widespread adoption of circular production practices. National policy targets also encourage higher utilization of industrial waste and secondary resources.
North America Zero-Waste Chemical Manufacturing Market Trends
The zero-waste chemical manufacturing market in North America benefits from established chemical infrastructure, strong process-engineering capabilities, and growing corporate investment in resource efficiency. Adoption is linked to operating-cost reduction and the commercial value of recovered feedstocks.
U.S. Zero-Waste Chemical Manufacturing Market Trends
The zero-waste chemical manufacturing market in the U.S. is expected to grow at a CAGR of 10.6% during the forecast period. The growth is supported by its large petrochemical base and increasing deployment of advanced recycling, carbon-management, and process-efficiency technologies. Large integrated plants provide a substantial addressable base for closed-loop manufacturing solutions.
Europe Zero-Waste Chemical Manufacturing Market Trends
The zero-waste chemical manufacturing market in Europe remains a technology- and regulation-driven market, with policies encouraging safer chemicals, circular material flows, recycled content, and resource efficiency. The EU's chemicals and circular-economy initiatives are strengthening the commercial environment for zero-waste production technologies.
Latin America Zero-Waste Chemical Manufacturing Market Trends
The zero-waste chemical manufacturing market in Latin America presents emerging potential as chemical producers seek to reduce material losses and improve environmental performance while modernizing industrial infrastructure. Growth opportunities are strongest around major petrochemical and manufacturing clusters such as Brazil, Argentina, and Colombia.
Middle East & Africa Zero-Waste Chemical Manufacturing Market Trends
The zero-waste chemical manufacturing market in the Middle East & Africa is expected to grow at the fastest CAGR of 12.9% during the forecast period. The region offers significant potential through its large-scale petrochemical industry, particularly where integrated industrial complexes can connect waste recovery with feedstock and energy systems. Expansion of downstream chemical manufacturing can further increase demand for resource-efficient production technologies.
Key Zero-Waste Chemical Manufacturing Company Insights
The competitive landscape includes major environmental-services and resource-management companies that support chemical manufacturers through waste prevention, industrial waste treatment, resource recovery, recycling, and circular production solutions. Veolia and SUEZ are notable participants, with capabilities spanning industrial waste recovery and conversion of waste streams into secondary resources.
-
Veolia has a strong position in the ecosystem through its integrated water, waste, and energy management capabilities for chemical and petrochemical facilities. Its offering includes industrial waste optimization, hazardous-waste management, solvent recycling, and recovery of industrial by-products, enabling manufacturers to reduce disposal volumes while returning materials into productive use.
-
SUEZ participates through industrial waste management, recycling, resource recovery, and circular-economy solutions that help manufacturers convert waste streams into secondary materials and energy. Its capabilities increasingly combine waste prevention, advanced sorting, recycling, recovery, and digital technologies, supporting chemical producers in improving material utilization and reducing dependence on virgin resources.
Key Zero-Waste Chemical Manufacturing Companies
The following key companies have been profiled for the study on the global zero-waste chemical manufacturing market.
-
Veolia
-
SUEZ
-
BASF
-
Dow
-
Evonik Industries
-
Honeywell
-
Alfa Laval
-
Sulzer
-
Aquatech International
-
Eastman Chemical Company
Company Categorization
Operating Strategies
Competitive Edge
Weaknesses
Mature Players: Veolia, SUEZ, BASF, Dow, Evonik Industries, Honeywell, Eastman Chemical Company
- Pursue integrated solutions combining waste management, chemical recycling, resource recovery, process optimization, water reuse, and circular feedstocks. Major chemical producers such as BASF, Dow, Evonik, and Eastman increasingly embed circularity directly into their product and manufacturing strategies, while environmental-service companies such as Veolia provide outsourced waste, water, and resource-recovery capabilities.
- Broad global footprint, extensive industrial customer relationships, proprietary technologies, established production assets, and ability to implement solutions across multiple stages of the chemical value chain. BASF, for example, combines chemical recycling with its integrated production network, while Veolia combines water, waste, and energy services for chemical facilities.
- Large organizational structures can make technology deployment and decision-making slower than specialized technology providers. Integrated solutions can also involve significant capital requirements, complex plant integration, and longer customer qualification cycles.
Emerging Players: Alfa Laval, Sulzer, Aquatech International
- Focus on specialized enabling technologies such as advanced separation, membrane systems, process intensification, chemical-recycling equipment, wastewater recovery, and modular process solutions. Their strategy is generally to become technology partners to chemical producers rather than compete across the entire manufacturing ecosystem. Sulzer, for example, provides modular-to-integrated chemical-recycling systems, while Aquatech focuses strongly on industrial water treatment and reuse.
- High technical specialization, engineering flexibility, modular deployment, and ability to address specific bottlenecks within existing chemical plants. This positioning allows these companies to participate in brownfield modernization without requiring customers to redesign entire manufacturing operations.
- More limited control over feedstock, finished chemical products, and downstream value chains compared with integrated chemical producers. Dependence on customer capital expenditure cycles and project-specific technology adoption can also create revenue variability.
Recent Developments:
-
In February 2026, Veolia announced the development of a major industrial hazardous-waste landfill facility in Magnad, India, designed with a capacity of around 15 million tonnes. The project strengthens Veolia’s hazardous-waste treatment and resource-management capabilities and expands its presence in India’s industrial waste infrastructure.
-
In January 2026, SUEZ and Banque des Territoires announced a project in Calce, France, involving a modernized sorting center and waste-preparation facility. The project is expected to increase packaging recycling by 30%, recover materials from incineration bottom ash, and improve energy recovery, reinforcing SUEZ’s circular resource-management capabilities.
Zero-Waste Chemical Manufacturing Market Report Scope
Report Attribute
Details
Market Definition
The Zero-Waste Chemical Manufacturing Market covers technologies, processes, and solutions that prevent, minimize, recover, recycle, reuse, or valorize waste generated during chemical production, including waste prevention, process optimization, resource recovery, chemical recycling, closed-loop reuse, and by-product valorization, helping manufacturers reduce disposal volumes, improve material efficiency, and convert waste streams into reusable feedstocks, materials, or energy.
Market size in 2025
USD 44.8 billion
Estimated market size in 2026
USD 49.8 billion
Projected market size by 2033
USD 104.7 billion
Growth rate
CAGR of 11.2% from 2026 to 2033
Base year for estimation
2025
Historical data
2021 - 2024
Forecast period
2026 - 2033
Quantitative units
Revenue in USD billion, and CAGR from 2026 to 2033
Report coverage
Revenue forecast, company ranking, competitive landscape, growth factors, and trends
Segments covered
Solution, end use, region
Regional scope
North America; Europe; Asia Pacific; Latin America; MEA
Country scope
U.S.; Canada; Mexico; Germany; UK; France; Italy; Spain; China; India; Japan; South Korea; Brazil; Argentina; Saudi Arabia; South Africa
Key companies profiled
Veolia; SUEZ; BASF; Dow; Evonik Industries; Honeywell; Alfa Laval; Sulzer Ltd; Aquatech International; Eastman Chemical Company
Customization scope
Free report customization (equivalent up to 8 analysts’ working days) with purchase. Addition or alteration to country, regional & segment scope.
Pricing and purchase options
Avail customized purchase options to meet your exact research needs. Explore purchase options
Global Zero-Waste Chemical Manufacturing Market Report Segmentation
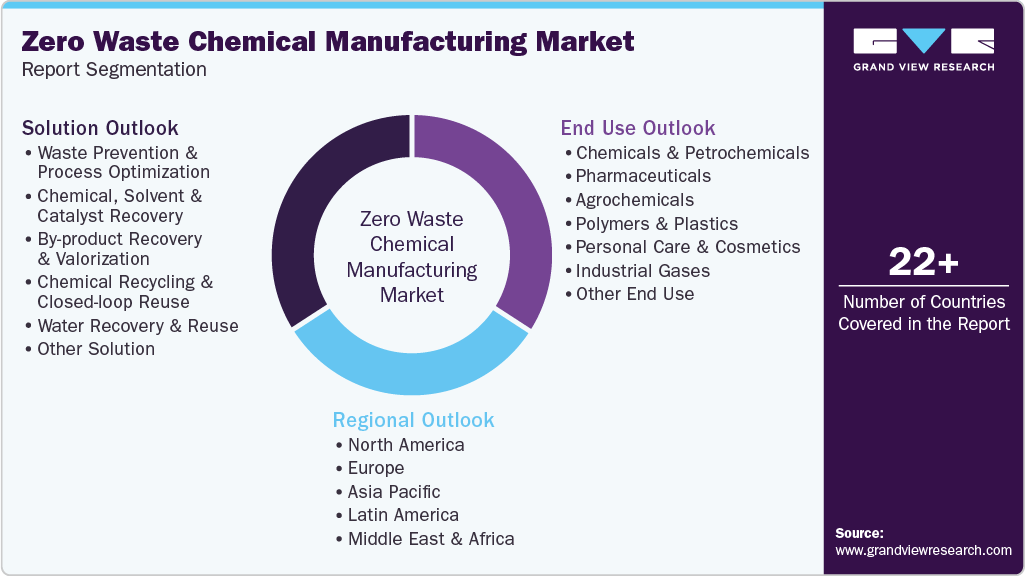
This report forecasts revenue growth at global, regional and country levels and provides an analysis of the latest industry trends and opportunities in each of the sub-segments from 2021 to 2033. For this study, Grand View Research has segmented the global zero-waste chemical manufacturing market report based on solution, end use, and region:
-
Solution Outlook (Revenue, USD Billion, 2021 - 2033)
-
Waste Prevention & Process Optimization
-
Chemical, Solvent & Catalyst Recovery
-
By-product Recovery & Valorization
-
Chemical Recycling & Closed-loop Reuse
-
Water Recovery & Reuse
-
Other Solution
-
-
End Use Outlook (Revenue, USD Billion, 2021 - 2033)
-
Chemicals & Petrochemicals
-
Pharmaceuticals
-
Agrochemicals
-
Polymers & Plastics
-
Personal Care & Cosmetics
-
Industrial Gases
-
Other End Use
-
-
Regional Outlook (Revenue, USD Billion, 2021 - 2033)
-
North America
-
U.S.
-
Canada
-
Mexico
-
-
Europe
-
Germany
-
UK
-
France
-
Italy
-
Spain
-
-
Asia Pacific
-
China
-
India
-
Japan
-
South Korea
-
-
Latin America
-
Brazil
-
Argentina
-
-
Middle East & Africa
-
Saudi Arabia
-
South Africa
-
-
Research Methodology
The zero-waste chemical manufacturing market figures in this report are based on a proven research process that combines executive interviews with secondary research from proprietary databases, company filings, and recognized regulatory and institutional sources. Market size is built through value-chain sizing—reconciling supply-side and demand-side estimates—and triangulated with bottom-up and top-down approaches. Every estimate passes multiple levels of expert validation before publication, with each zero-waste chemical manufacturing segment quantified using the revenue-capture definitions in the table below.
Segment Definition
Solution Type
Revenue capture definition
Waste Prevention & Process Optimization
Revenue generated from solutions that prevent chemical waste at source or reduce waste generation during manufacturing, including process optimization, yield improvement, production-efficiency systems, process monitoring, automation, and technologies that minimize raw-material losses, off-spec production and process waste.
Chemical, Solvent & Catalyst Recovery
Revenue generated from equipment, systems, technologies and services used to recover, purify and reuse chemicals, solvents and catalysts from manufacturing streams, including solvent recovery, catalyst regeneration, chemical purification and associated recovery systems.
By-product Recovery & Valorization
Revenue generated from technologies and services that recover, process and convert chemical manufacturing by-products into reusable materials, secondary raw materials or commercially valuable products, including by-product separation, purification, upgrading and repurposing solutions.
Chemical Recycling & Closed-loop Reuse
Revenue generated from technologies and systems that recycle chemical waste back into chemical feedstocks or production inputs, including chemical depolymerization, pyrolysis, solvent-based recycling, feedstock recovery and closed-loop material reuse within or across manufacturing processes.
Water Recovery & Reuse
Revenue generated from industrial water and wastewater treatment, recovery, purification and reuse solutions that enable chemical manufacturers to reduce freshwater consumption and return treated water to production processes, including membrane systems, advanced treatment, water recycling and zero-liquid-discharge solutions.
Other Solution Type
Revenue generated from other zero-waste manufacturing solutions not classified above, including waste-management monitoring, digital waste-tracking systems, material-efficiency platforms, waste-related consulting and other supporting technologies directly contributing to zero-waste chemical manufacturing.
End Use
Revenue capture definition
Chemicals & Petrochemicals
Revenue generated from zero-waste manufacturing solutions deployed across chemical and petrochemical production facilities, including recovery, reuse, waste prevention, process optimization, by-product valorization and water-recovery applications.
Pharmaceuticals
Revenue generated from zero-waste solutions used in pharmaceutical and active pharmaceutical ingredient (API) manufacturing, including solvent and chemical recovery, process optimization, waste minimization, by-product recovery and water reuse.
Agrochemicals
Revenue generated from zero-waste solutions used in the manufacturing of fertilizers, pesticides, herbicides, fungicides and other crop-protection chemicals, covering waste prevention, chemical recovery, by-product utilization and water-reuse applications.
Polymers & Plastics
Revenue generated from zero-waste solutions deployed in polymer, resin, plastics and related material production, including chemical recycling, feedstock recovery, closed-loop reuse, process optimization and recovery of solvents, catalysts and production residues.
Personal Care & Cosmetics
Revenue generated from zero-waste manufacturing solutions used in the production of cosmetics, personal-care products and their chemical ingredients, including raw-material optimization, solvent recovery, by-product recovery, water reuse and waste-minimization technologies.
Industrial Gases
Revenue generated from zero-waste solutions applied to industrial-gas production and processing, including gas-separation process optimization, recovery and reuse systems, resource-efficiency technologies, by-product recovery and water-treatment/reuse systems.
Other End Use
Revenue generated from zero-waste manufacturing solutions deployed across other chemical-intensive industries, including specialty materials, coatings, dyes and pigments, electronics chemicals, textiles and food chemicals not classified above.
Estimation Model
Layer No.
Layer Name
Key Question
Description
01
Global Production Baseline
What is the global revenue generated by zero-waste chemical manufacturing solutions?
Establishes the 2025 global market baseline in USD, covering revenues from waste-prevention and process-optimization systems, chemical/solvent/catalyst recovery, by-product recovery and valorization, chemical recycling and closed-loop reuse, water recovery and reuse, and other directly related zero-waste manufacturing solutions. The baseline is developed using company revenues and disclosures, production-facility investments, technology deployments, project announcements, equipment sales, industrial sustainability investments, and other primary industry sources.
02
Country-Level Market Assessment
How is zero-waste chemical manufacturing revenue distributed across countries?
Develops country-level market estimates by assessing chemical manufacturing capacity, industrial production, waste-generation intensity, circular-economy investments, zero-waste and resource-efficiency initiatives, chemical recycling capacity, solvent/catalyst recovery deployment, industrial water-reuse investments, and company/project activity. Country revenues are calibrated against national chemical-industry output and relevant industrial sustainability expenditure.
03
Solution Type Allocation
How is zero-waste chemical manufacturing revenue distributed across solution types?
Allocates the global market across Waste Prevention & Process Optimization; Chemical, Solvent & Catalyst Recovery; By-product Recovery & Valorization; Chemical Recycling & Closed-loop Reuse; Water Recovery & Reuse; and Other Solution Types. Allocation is based on the relative adoption of each solution across chemical manufacturing processes, associated capital expenditure, technology deployment, project activity, recovery capacity, and revenue generated by solution providers.
04
End-Use Allocation
How is zero-waste chemical manufacturing revenue distributed across end-use industries?
Further allocates solution-level revenues across Chemicals & Petrochemicals, Pharmaceuticals, Agrochemicals, Polymers & Plastics, Personal Care & Cosmetics, Industrial Gases, and Other End Uses. The allocation considers industry production scale, waste and resource intensity, regulatory requirements, adoption of circular manufacturing practices, chemical-recovery requirements, recycling investments, and water-reuse demand within each industry.
Delivered Customizations
This report has been delivered with the following In-depth customizations:
Client Request
Customization Delivered
Value Adds
Cross-Segmentation Analysis
The analysis evaluates the relationship between Waste Prevention & Process Optimization; Chemical, Solvent & Catalyst Recovery; By-product Recovery & Valorization; Chemical Recycling & Closed-loop Reuse; Water Recovery & Reuse; and Other Solutions across Chemicals & Petrochemicals, Pharmaceuticals, Agrochemicals, Polymers & Plastics, Personal Care & Cosmetics, Industrial Gases, and Other End Uses.
Provides visibility into high-value solution-end-use combinations, highlighting where specific zero-waste technologies have the strongest adoption potential and demand intensity. Supports solution prioritization, technology portfolio planning, customer targeting, and identification of high-growth application pockets.
Competitive Benchmarking
Leading zero-waste chemical manufacturing solution providers are benchmarked based on solution portfolio, technology capabilities, recovery and recycling capacity, manufacturing/project footprint, geographic presence, end-use coverage, technology integration, customer industries, sustainability initiatives, partnerships, investments, and recent strategic developments.
Help identify technology strengths, solution portfolio gaps, competitive differentiation, geographic positioning, integration capabilities, and strategic partnerships, supporting competitor assessment, market-entry planning, portfolio development, and investment decisions.
Opportunity Assessment
Growth opportunities are assessed across the six Solution Types and seven End-Use industries, with additional evaluation of chemical and solvent recovery, catalyst recovery, by-product valorization, chemical recycling, closed-loop manufacturing, process optimization, and industrial water recovery/reuse opportunities.
Supports identification of priority solution areas, high-growth end-use industries, emerging technology opportunities, underserved customer requirements, and attractive investment pockets, enabling informed decisions on technology development, capacity expansion, customer targeting, partnerships, and geographic expansion.
About the Author(s)
Renewable Chemicals Research Team
Specialty & Chemicals · Renewable ChemicalsThis report was authored by the renewable chemicals research team at Grand View Research - comprising two research analysts, one senior research analyst, and one industry expert - with specialized expertise in the renewable chemicals segment of the specialty & chemicals industry. All findings are based on proprietary specialty & chemicals databases, executive interviews, and regulatory analysis, subject to internal peer review prior to publication.
Last Updated:
Speak to Analyst


Customize this report to your needs - add regions, segments, or data points, with 20% free customization.
Or view our licence options:


ISO 9001:2015 & 27001:2022 Certified
We are GDPR and CCPA compliant! Your transaction & personal information is safe and secure. For more details, please read our privacy policy.


