GVR Report cover Biodegradable Plastic Market Size, Share & Trends Report

Biodegradable Plastic Market Size, Share & Trends Analysis Report By Process (Starch Blends, Polylactic Acid), By End-use, By Region, And Segment Forecasts, 2024 - 2030

  • Report ID: GVR-2-68038-410-9
  • Number of Report Pages: 164
  • Format: PDF, Horizon Databook
  • Historical Range: 2018 - 2022
  • Forecast Period: 2024 - 2030 
  • Industry: Bulk Chemicals

Biodegradable Plastic Market Size & Trends

The global biodegradable plastic market size was estimated at USD 5.43 billion in 2023 and is projected to grow at a CAGR of 9.2% from 2024 to 2030. Governments prohibiting the use of single-use plastic coupled with rising awareness among the public regarding the ill effects of plastic waste are among the key trends stimulating market growth. 

U.S. Biodegradable Plastic Market Size by Process, 2020 - 2030 (USD Billion)

The increasing usage of biodegradable plastic in packaging and agriculture is anticipated to supplement the growth of the segment. Non-decomposable plastic is a global issue. Governments around the world are tackling this problem by banning single-use plastic and promoting the use of biodegradable plastic. Moreover, consumers are willing to pay more for biodegradable plastic owing to their eco-friendly nature. The aforementioned factors, cumulatively, are providing a fillip to the market growth.

Consumers are becoming more aware of the harm caused by regular plastics to the environment. They are concerned about the long time it takes for traditional plastics to break down and the negative impact on wildlife and ecosystems. As a result, consumers are actively seeking sustainable alternatives, such as products made from biodegradable materials that break down quickly and are better for the environment. This shift in consumer behavior applies to a wide range of goods, from food packaging to everyday household items.

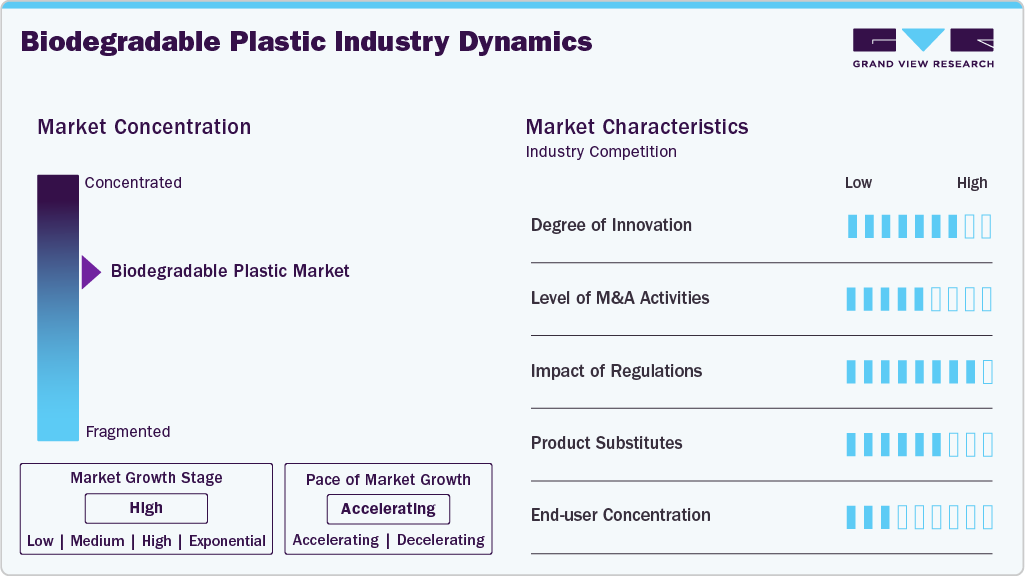
Market Concentration & Characteristics

The market is consolidated in nature with the presence of key industry players such as Cargill Incorporated, PTT MCC Biochem Co., Ltd., Biome Technologies plc; Plantic Technologies Limited; BASF SE; Total Corbion PLA; NatureWorks LLC; Eastman Chemical Company; Trineso; Danimer Scientific, which dominate a significant market share. These companies often engage in aggressive marketing strategies, research and development initiatives, and mergers and acquisitions to strengthen their market position and expand their product offerings.

Product substitutes for biodegradable plastics include traditional petroleum-based plastics, which are widely used but pose significant environmental challenges due to their long decomposition times. Alternatives such as paper and cardboard are biodegradable and recyclable, though they may lack the durability and versatility of plastics. Glass is another option, offering recyclability and reusability, but it is heavier and more fragile. Metals like aluminum and steel can also replace plastics in some applications, providing durability and recyclability, though often at a higher cost and weight. In addition, compostable plastics made from organic materials are an eco-friendly alternative, breaking down completely under specific conditions.

Biodegradable Plastic Industry Dynamics

Regulations have a significant impact on the global market by encouraging or mandating the reduction of traditional plastic use. Governments around the world are implementing bans on single-use plastics, enforcing stricter recycling requirements, and offering incentives for using eco-friendly materials. These policies drive businesses to adopt biodegradable plastics to comply with new laws and avoid penalties. As a result, the demand for biodegradable plastics increases, fostering innovation and investment in this sector. Overall, regulatory measures create a more favorable environment for the market growth.

Process Insights

Based on process, the starch based segment led the market with the largest revenue share of 41.45% in 2023. This can be attributed to its eco-friendly properties and versatility. Made from renewable resources such as corn, potatoes, and wheat, starch-based plastics are an attractive alternative to traditional plastics. They are used in various applications, including packaging, agriculture, and disposable items including cutlery and plates. These plastics break down naturally in the environment, reducing pollution and waste. In addition, their production is relatively cost-effective, making them a popular choice for manufacturers looking to meet sustainability goals and comply with environmental regulations. Overall, starch-based biodegradable plastics offer a practical and environmentally friendly solution in the fight against plastic pollution.

The polylactic acid (PLA) segment is expected to grow at the fastest CAGR over the forecast period, owing to its strong environmental benefits and wide range of uses. Made from renewable resources like corn starch and sugarcane, PLA is a versatile material used in packaging, disposable tableware, and even medical implants. It is compostable under industrial conditions, breaking down into harmless natural components. PLA offers similar properties to traditional plastics, such as clarity and durability, but with a significantly lower environmental impact. Its increasing adoption is driven by growing consumer demand for sustainable products and stricter regulations on plastic waste, making PLA a key player in the global market.

End-use Insights

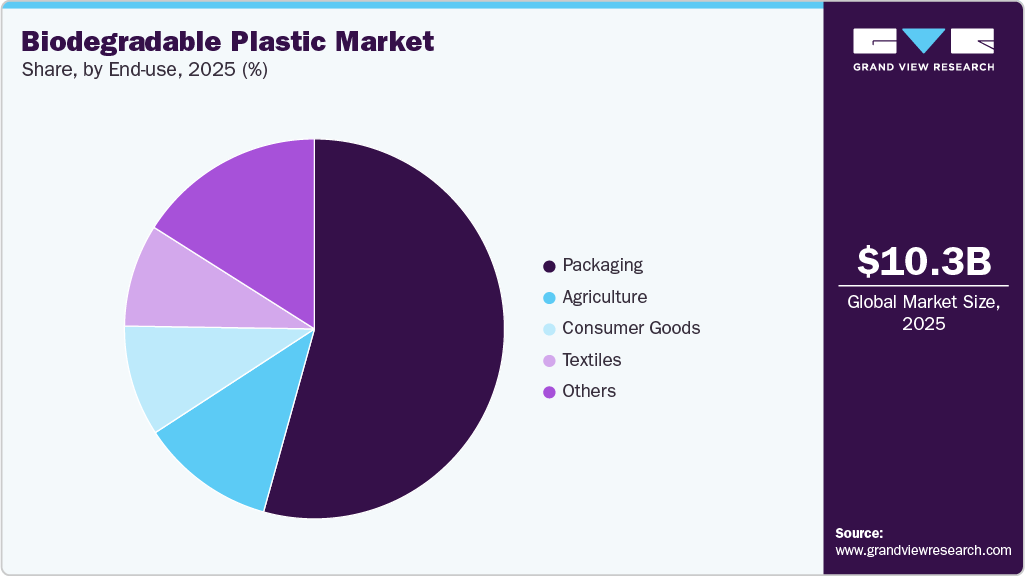
Based on end use, the packaging segment led the market with the largest revenue share of 53.91% in 2023. The packaging segment of biodegradable plastics is rapidly expanding as businesses and consumers seek eco-friendly alternatives to traditional plastic packaging. Biodegradable packaging is made from materials like starch, PLA, and other plant-based polymers that decompose naturally, reducing pollution and landfill waste. This type of packaging is used for a wide variety of products, including food containers, shopping bags, and product wraps. Its demand in the segment is fueled by increasing environmental awareness, stricter regulations on plastic use, and corporate sustainability goals.

With the rising demand for biodegradable plastic packaging, companies are undertaking various strategic initiatives such as expansion, product launch, partnerships, and others. For instance, in May 2024, SKC, a South Korean chemicals company, announced its plans to build the world's largest biodegradable plastic plant in Hai Phong, Vietnam, with an annual capacity of 70,000 tons of polybutylene adipate terephthalate (PBAT). This flexible bioplastic, used in packaging and more, will be strengthened with nano-cellulose from trees for wider applications, including personal hygiene products.

Biodegradable Plastic Market Share by End-use, 2023 (%)

The consumer goods segment is projected to grow at a significant CAGR through the forecast period. The consumer goods segment of biodegradable plastics is growing as more brands and consumers prioritize sustainability. Products like utensils, plates, cups, and even toys are now being made from biodegradable materials. These items break down naturally, reducing plastic waste and environmental impact. Furthermore, the emerging e-commerce industry is propelling the adoption rate of biodegradable plastics to cater the rising demand sustainably.

Regional Insights

North America biodegradable plastics market with the revenue share of 29.57% in 2023. In North America, the market is supported by an advanced manufacturing infrastructure and increasing demand for sustainable products. Major players in the region, including the U.S. and Canada, are emphasizing innovation and environmentally friendly practices, driving growth in applications ranging from packaging and agriculture to textiles.

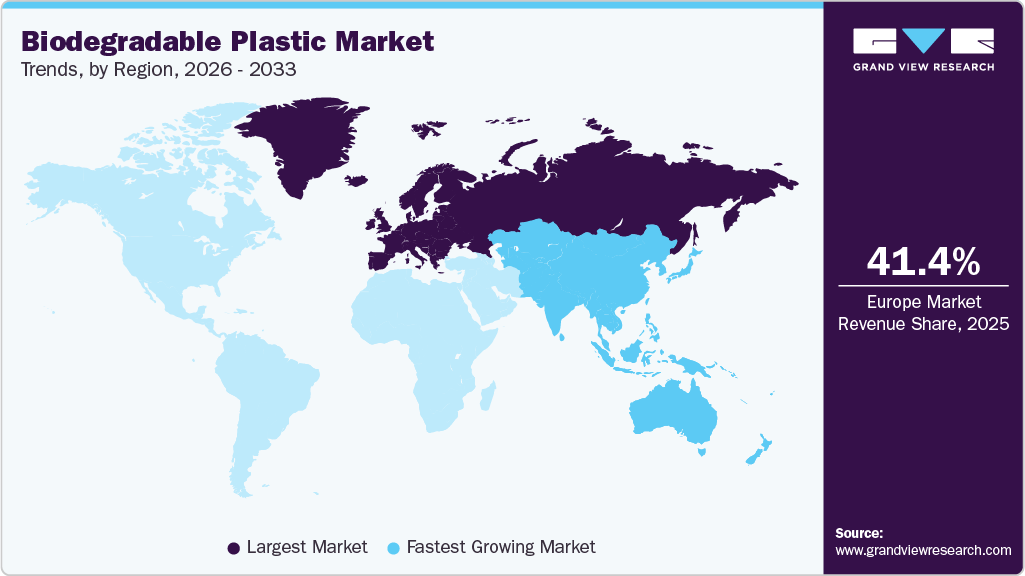
Biodegradable Plastic Market Trends, by Region, 2024 - 2030

U.S. Biodegradable Plastic Market Trends

The biodegradable plastic market in U.S.is expected to grow at a significant CAGR over the forecast period, on account of the growing demand for bio-based packaging in food and consumer goods sectors. Bio bags and bio-based plastic have higher tensile strength, are eco-friendly in nature, and are convenient for use as compared to conventional plastic. Moreover, expanding composting infrastructure and rising governmental efforts to reduce landfilling, such as the U.S. 2030 Food Loss and Waste Reduction Goal, are anticipated to augment the demand for bio-based bags or compostable bags used in the collection of food leftovers and other organic waste material over the forecast period.

The Canada biodegradable plastic market is expected to grow at a significant CAGR over the forecast period, driven by the strict governmental regulations aiming to reduce plastic pollution. Canada has implemented comprehensive waste management policies and aims to achieve zero plastic waste by 2030, driving the adoption of biodegradable plastics.

Europe Biodegradable Plastic Market Trends

The biodegradable plastic market in Europe dominated the market with the revenue share of 42.6% in 2023. Europe market thrives on sustainability initiatives, with Germany, Italy and the United Kingdom leading the region's innovation in eco-friendly textiles and consumer goods applications.

The Germany biodegradable plastic accounted for the largest market revenue share in 2023. The country’s advanced research and development sector is driving innovation in biodegradable materials. In addition, high environmental awareness among consumers is leading to greater demand for eco-friendly products such as biodegradable plastics.

The biodegradable plastic market in UK is expected to grow at the fastest CAGR over the forecast period. UK is regarded as a hub for innovations and researches due to its heritage. The market is driven by continuous innovations, a result of excellent research & development infrastructure.

Asia Pacific Biodegradable Plastic Market

The biodegradable plastic market in Asia Pacific is poised to grow at a rapid CAGR over the forecast period. The rapid industrialization coupled with the increasing adoption of sustainable industrial practices is propelling the market growth in the region.

The China biodegradable plastic market dominated the Asia Pacific region and is expected to grow at the fastest CAGR over the forecast period, as, it is one of the largest manufacturer of consumer goods. Furthermore, the e-commerce sector is growing significantly, leading to an increased demand for biodegradable plastics for the production of packaging as well as consumer goods.

The biodegradable plastic market in India offers lucrative opportunities in various industries such as food packaging and agriculture.It is one of the largest exporters of agricultural goods and consumers of packaged foods, further boosting the demand of biodegradable plastics in the country.

Central & South America Biodegradable Plastic Market

The biodegradable plastic market in Central & South America is anticipated to grow at a significant CAGR over the forecast period. Government regulations pertaining the reduction of single-use plastics to curb ill effects caused by them is driving the market growth. The agricultural industry is one of the crucial consumer of biodegradable plastics for mulching and other applications.

Middle East & Africa Biodegradable Plastic Market

The biodegradable plastics market in the Middle East and Africa is anticipated to witness at a steady CAGR during the forecast period, driven by various governmental initiatives such as Saudi Arabia's Vision 2030 that includes environmental sustainability goals, thus driving the adoption of biodegradable plastics.

Key Biodegradable Plastic Company Insights

Key companies are adopting several organic and inorganic expansion strategies, such as mergers & acquisitions, new product launches, capacity expansion, mergers & acquisitions, and joint ventures, to maintain and expand their market share.

Key Biodegradable Plastic Companies:

The following are the leading companies in the biodegradable plastic market. These companies collectively hold the largest market share and dictate industry trends.

  • Cargill Incorporated
  • PTT MCC Biochem Co., Ltd.
  • Biome Technologies plc
  • Plantic Technologies Limited
  • BASF SE
  • Total Corbion PLA
  • NatureWorks LLC
  • Eastman Chemical Company
  • Trineso
  • Danimer Scientific

Recent Developments

  • In March 2024, Beyond Plastic announced a collaboration with CJ Biomaterials to produce biodegradable plastic-based bottle cap.The cap is made from polyhydroxyalkanoate (PHA), a biopolymer derived from natural sources, which enhances the functional properties of conventional plastics while offering environmental advantages

  • In February 2024, Balrampur Chini Mills Ltd invested USD 267 million (INR 2,000 crore) in bioplastics and will set up a PLA plant producing 75,000 tons per annum

Biodegradable Plastic Market Report Scope 

Report Attribute

Details

Market size value in 2024

USD 5.92 billion

Revenue forecast in 2030

USD 10.04 billion

Growth rate

CAGR of 9.2% from 2024 to 2030

Base year for estimation

2023

Historical data

2018 - 2022

Forecast period

2024 - 2030

Quantitative units

Volume in kilotons, revenue in USD million/billion, and CAGR from 2024 to 2030

Report coverage

Volume forecast, revenue forecast, competitive landscape, growth factors, and trends

Segments covered

Process, end-use, region

Regional scope

North America; Europe; Asia Pacific; Central & South America; Middle East & Africa

Country scope

U.S.; Canada; Mexico; Germany; France; UK; Italy; Spain; China; India; Japan; South Korea; Brazil; Saudi Arabia

Key companies profiled

Cargill Incorporated; PTT MCC Biochem Co., Ltd.; Biome Technologies plc; Plantic Technologies Limited; BASF SE; Total Corbion PLA; NatureWorks LLC; Eastman Chemical Company; Trineso; Danimer Scientific

Customization scope

Free report customization (equivalent up to 8 analyst’s working days) with purchase. Addition or alteration to country, regional & segment scope.

Pricing and purchase options

Avail customized purchase options to meet your exact research needs. Explore purchase options

Global Biodegradable Plastic Market Report Segmentation

This report forecasts revenue and volume growth at the global, regional, and country levels and provides an analysis of the latest industry trends and opportunities in each of the sub-segments from 2018 to 2030. For this study, Grand View Research has segmented the global biodegradable plastic market report based on process, end use, and region:

Biodegradable Plastic Market Report Segmentation

  • Process Outlook (Volume, Kilotons; Revenue, USD Million, 2018 - 2030)

    • Starch Based

    • PLA

    • PBAT

    • PBS

    • PHA

    • Others

  • End Use Outlook (Volume, Kilotons; Revenue, USD Million, 2018 - 2030)

    • Packaging

      • Food Packaging

      • Non-Food Packaging

    • Agriculture

    • Textiles

    • Consumer Goods

    • Others

  • Regional Outlook (Volume, Kilotons; Revenue, USD Billion, 2018 - 2030)

    • North America

      • U.S.

      • Canada

      • Mexico

    • Europe

      • Germany

      • UK

      • Italy

      • France

      • Spain

    • Asia Pacific

      • China

      • Japan

      • India

      • South Korea

    • Central & South America

      • Brazil

    • Middle East & Africa

      • Saudi Arabia

Frequently Asked Questions About This Report

Table of Contents

Chapter 1. Methodology and Scope
                    1.1. Market Segmentation & Scope
                    1.2. Market Definition
                    1.3. Information Procurement
                         1.3.1. Purchased Database
                         1.3.2. GVR’s Internal Database
                         1.3.3. Secondary Sources & Third-Party Perspectives
                         1.3.4. Primary Research
                    1.4. Information Analysis
                         1.4.1. Data Analysis Models
                    1.5. Market Formulation & Data Visualization
                    1.6. Data Validation & Publishing
Chapter 2. Executive Summary
                    2.1. Market Snapshot, 2023
                    2.2. Product Segment Snapshot, 2023
                    2.3. Application Segment Snapshot, 2023
                    2.4. Competitive Landscape Snapshot
Chapter 3. Biodegradable Plastic Market Variables, Trends & Scope
                    3.1. Market Lineage Outlook
                    3.2. Industry Value Chain Analysis
                    3.3. Technology Overview
                    3.4. Regulatory Framework
                    3.5. Market Dynamics
                         3.5.1. Market Driver Analysis
                         3.5.2. Market Restraint Analysis
                         3.5.3. Industry Challenges
                         3.5.4. Industry Opportunities
                    3.6. Biodegradable Plastic Market- Business Environment Analysis
                         3.6.1. Porter’s Five Force Analysis
                         3.6.2. PESTEL Analysis
Chapter 4. Biodegradable Plastic Market: Product Estimates & Trend Analysis
                    4.1. Product Movement Analysis & Market Share, 2023 & 2030
                    4.2. Biodegradable Plastic Market Estimates & Forecast, By Product, 2018 to 2030 (Kilotons) (USD Million)
                    4.3. Starch-based
                         4.3.1. Biodegradable Plastic Market, Estimation and Forecast, by Starch-based, 2018 - 2030 (Kilotons) (USD Million)
                    4.4. Polylactic Acid (PLA)
                         4.4.1. Biodegradable Plastic Market, Estimation and Forecast, by PLA, 2018 - 2030 (Kilotons) (USD Million)
                    4.5. Polybutylene Adipate Terephthalate (PBAT)
                         4.5.1. Biodegradable Plastic Market, Estimation and Forecast, by PBAT, 2018 - 2030 (Kilotons) (USD Million)
                    4.6. Polybutylene Succinate (PBS)
                         4.6.1. Biodegradable Plastic Market, Estimation and Forecast, by PBS, 2018 - 2030 (Kilotons) (USD Million)
                    4.7. Polyhydroxyalkanoate (PHA)
                         4.7.1. Biodegradable Plastic Market, Estimation and Forecast, by PHA, 2018 - 2030 (Kilotons) (USD Million)
                    4.8. Others
                         4.8.1. Biodegradable Plastic Market, Estimation and Forecast, by Others, 2018 - 2030 (Kilotons) (USD Million)
Chapter 5. Biodegradable Plastic Market: Application Estimates & Trend Analysis
                    5.1. Application Movement Analysis & Market Share, 2023 & 2030
                    5.2. Biodegradable Plastic Market Estimates & Forecast, By Application, 2018 to 2030 (Kilotons) (USD Million)
                    5.3. Packaging
                         5.3.1. Biodegradable Plastic Market, Estimation and Forecast, by Packaging, 2018 - 2030 (Kilotons) (USD Million)
                    5.4. Agriculture
                         5.4.1. Biodegradable Plastic Market, Estimation and Forecast, by Agriculture, 2018 - 2030 (Kilotons) (USD Million)
                    5.5. Consumer Goods
                         5.5.1. Biodegradable Plastic Market, Estimation and Forecast, by Consumer Goods, 2018 - 2030 (Kilotons) (USD Million)
                    5.6. Others
                         5.6.1. Biodegradable Plastic Market, Estimation and Forecast, by Others, 2018 - 2030 (Kilotons) (USD Million)
Chapter 6. Biodegradable Plastic Market: Regional Estimates & Trend Analysis
                    6.1. Regional Movement Analysis & Market Share, 2023 & 2030
                    6.2. North America
                         6.2.1. North America Chemical Market Estimates & Forecast, 2018 - 2030 (Kilotons) (USD Million)
                         6.2.2. U.S.
                              6.2.2.1. Key country dynamics
                              6.2.2.2. U.S. Biodegradable Plastic market estimates & forecast, 2018 - 2030 (Kilotons) (USD Million)
                         6.2.3. Canada
                              6.2.3.1. Key country dynamics
                              6.2.3.2. Canada Biodegradable Plastic market estimates & forecast, 2018 - 2030 (Kilotons) (USD Million)
                         6.2.4. Mexico
                              6.2.4.1. Key country dynamics
                              6.2.4.2. Mexico Biodegradable Plastic market estimates & forecast, 2018 - 2030 (Kilotons) (USD Million)
                    6.3. Europe
                         6.3.1. Europe Chemical Market Estimates & Forecast, 2018 - 2030 (Kilotons) (USD Million)
                         6.3.2. Germany
                              6.3.2.1. Key country dynamics
                              6.3.2.2. Germany Biodegradable Plastic market estimates & forecast, 2018 - 2030 (Kilotons) (USD Million)
                         6.3.3. UK
                              6.3.3.1. Key country dynamics
                              6.3.3.2. UK Biodegradable Plastic market estimates & forecast, 2018 - 2030 (Kilotons) (USD Million)
                         6.3.4. Italy
                              6.3.4.1. Key country dynamics
                              6.3.4.2. Italy Biodegradable Plastic market estimates & forecast, 2018 - 2030 (Kilotons) (USD Million)
                         6.3.5. France
                              6.3.5.1. Key country dynamics
                              6.3.5.2. France Biodegradable Plastic market estimates & forecast, 2018 - 2030 (Kilotons) (USD Million)
                    6.4. Asia Pacific
                         6.4.1. Asia Pacific Chemical Market Estimates & Forecast, 2018 - 2030 (Kilotons) (USD Million)
                         6.4.2. China
                              6.4.2.1. Key country dynamics
                              6.4.2.2. China Biodegradable Plastic market estimates & forecast, 2018 - 2030 (Kilotons) (USD Million)
                         6.4.3. India
                              6.4.3.1. Key country dynamics
                              6.4.3.2. India Biodegradable Plastic market estimates & forecast, 2018 - 2030 (Kilotons) (USD Million)
                         6.4.4. Japan
                              6.4.4.1. Key country dynamics
                              6.4.4.2. Japan Biodegradable Plastic market estimates & forecast, 2018 - 2030 (Kilotons) (USD Million)
                         6.4.5. South Korea
                              6.4.5.1. Key country dynamics
                              6.4.5.2. South Korea Biodegradable Plastic market estimates & forecast, 2018 - 2030 (Kilotons) (USD Million)
                    6.5. Central & South America
                         6.5.1. Central & South America Chemical Market Estimates & Forecast, 2018 - 2030 (Kilotons) (USD Million)
                         6.5.2. Brazil
                              6.5.2.1. Key country dynamics
                              6.5.2.2. Brazil Biodegradable Plastic market estimates & forecast, 2018 - 2030 (Kilotons) (USD Million)
                    6.6. Middle East & Africa
                         6.6.1. Middles East & Africa Chemical Market Estimates & Forecast, 2018 - 2030 (Kilotons) (USD Million)
                         6.6.2. Saudi Arabia
                              6.6.2.1. Key country dynamics
                              6.6.2.2. Saudi Arabia Biodegradable Plastic market estimates & forecast, 2018 - 2030 (Kilotons) (USD Million)
Chapter 7. Biodegradable Plastic Market - Competitive Landscape
                    7.1. Recent Developments & Impact Analysis, By Key Market Participants
                    7.2. Company Categorization
                    7.3. Company Market Share/Position Analysis, 2023
                    7.4. Company Heat Map Analysis
                    7.5. Strategy Mapping
                         7.5.1. Expansion
                         7.5.2. Mergers & Acquisition
                         7.5.3. Partnerships & Collaborations
                         7.5.4. New Process Launches
                         7.5.5. Research and Development
                    7.6. Company Profiles
                         7.6.1. Cargill Incorporated
                              7.6.1.1. Participant’s overview
                              7.6.1.2. Financial performance
                              7.6.1.3. Process benchmarking
                              7.6.1.4. Recent developments
                         7.6.2. PTT MCC Biochem Co., Ltd.
                              7.6.2.1. Participant’s overview
                              7.6.2.2. Financial performance
                              7.6.2.3. Process benchmarking
                              7.6.2.4. Recent developments
                         7.6.3. Biome Technologies plc
                              7.6.3.1. Participant’s overview
                              7.6.3.2. Financial performance
                              7.6.3.3. Process benchmarking
                              7.6.3.4. Recent developments
                         7.6.4. Plantic Technologies Limited
                              7.6.4.1. Participant’s overview
                              7.6.4.2. Financial performance
                              7.6.4.3. Process benchmarking
                              7.6.4.4. Recent developments
                         7.6.5. BASF SE
                              7.6.5.1. Participant’s overview
                              7.6.5.2. Financial performance
                              7.6.5.3. Process benchmarking
                              7.6.5.4. Recent developments
                         7.6.6. Total Corbion PLA
                              7.6.6.1. Participant’s overview
                              7.6.6.2. Financial performance
                              7.6.6.3. Process benchmarking
                              7.6.6.4. Recent developments
                         7.6.7. NatureWorks LLC
                              7.6.7.1. Participant’s overview
                              7.6.7.2. Financial performance
                              7.6.7.3. Process benchmarking
                              7.6.7.4. Recent developments
                         7.6.8. Eastman Chemical Company
                              7.6.8.1. Participant’s overview
                              7.6.8.2. Financial performance
                              7.6.8.3. Process benchmarking
                              7.6.8.4. Recent developments
                         7.6.9. Trineso
                              7.6.9.1. Participant’s overview
                              7.6.9.2. Financial performance
                              7.6.9.3. Process benchmarking
                              7.6.9.4. Recent developments
                         7.6.10. Danimer Scientific
                              7.6.10.1. Participant’s overview
                              7.6.10.2. Financial performance
                              7.6.10.3. Process benchmarking
                              7.6.10.4. Recent developments


List of Tables

Table 1 List of abbreviation
Table 2 Biodegradable plastic market 2018 - 2030 (Kilotons) (USD Million)
Table 3 Global market estimates and forecasts by region, 2018 - 2030 (Kilotons) (USD Million)
Table 4 Global market estimates and forecasts by product, 2018 - 2030 (Kilotons) (USD Million)
Table 5 Global market estimates and forecasts by application, 2018 - 2030 (Kilotons) (USD Million)
Table 6 Global market estimates and forecasts by region, 2018 - 2030 (Kilotons) (USD Million)
Table 7 North America biodegradable plastic market by product, 2018 - 2030 (Kilotons) (USD Million)
Table 8 North America biodegradable plastic market by application, 2018 - 2030 (Kilotons) (USD Million)
Table 9 U.S. biodegradable plastic market by product, 2018 - 2030 (Kilotons) (USD Million)
Table 10 U.S. biodegradable plastic market by application, 2018 - 2030 (Kilotons) (USD Million)
Table 11 Canada biodegradable plastic market by product, 2018 - 2030 (Kilotons) (USD Million)
Table 12 Canada biodegradable plastic market by application, 2018 - 2030 (Kilotons) (USD Million)
Table 13 Mexico biodegradable plastic market by product, 2018 - 2030 (Kilotons) (USD Million)
Table 14 Mexico biodegradable plastic market by application, 2018 - 2030 (Kilotons) (USD Million)
Table 15 Europe biodegradable plastic market by product, 2018 - 2030 (Kilotons) (USD Million)
Table 16 Europe biodegradable plastic market by application, 2018 - 2030 (Kilotons) (USD Million)
Table 17 Germany biodegradable plastic market by product, 2018 - 2030 (Kilotons) (USD Million)
Table 18 Germany biodegradable plastic market by application, 2018 - 2030 (Kilotons) (USD Million)
Table 19 UK biodegradable plastic market by product, 2018 - 2030 (Kilotons) (USD Million)
Table 20 UK biodegradable plastic market by application, 2018 - 2030 (Kilotons) (USD Million)
Table 21 Italy biodegradable plastic market by product, 2018 - 2030 (Kilotons) (USD Million)
Table 22 Italy biodegradable plastic market by application, 2018 - 2030 (Kilotons) (USD Million)
Table 23 France biodegradable plastic market by product, 2018 - 2030 (Kilotons) (USD Million)
Table 24 France biodegradable plastic market by application, 2018 - 2030 (Kilotons) (USD Million)
Table 25 Asia Pacific biodegradable plastic market by product, 2018 - 2030 (Kilotons) (USD Million)
Table 26 Asia Pacific biodegradable plastic market by application, 2018 - 2030 (Kilotons) (USD Million)
Table 27 China biodegradable plastic market by product, 2018 - 2030 (Kilotons) (USD Million)
Table 28 China biodegradable plastic market by application, 2018 - 2030 (Kilotons) (USD Million)
Table 29 India biodegradable plastic market by product, 2018 - 2030 (Kilotons) (USD Million)
Table 30 India biodegradable plastic market by application, 2018 - 2030 (Kilotons) (USD Million)
Table 31 Japan biodegradable plastic market by product, 2018 - 2030 (Kilotons) (USD Million)
Table 32 Japan biodegradable plastic market by application, 2018 - 2030 (Kilotons) (USD Million)
Table 33 Central & South America biodegradable plastic market by product, 2018 - 2030 (Kilotons) (USD Million)
Table 34 Central & South America biodegradable plastic market by application, 2018 - 2030 (Kilotons) (USD Million)
Table 35 Brazil biodegradable plastic market by product, 2018 - 2030 (Kilotons) (USD Million)
Table 36 Brazil biodegradable plastic market by application, 2018 - 2030 (Kilotons) (USD Million)
Table 37 Middle East & Africa biodegradable plastic market by product, 2018 - 2030 (Kilotons) (USD Million)
Table 38 Middle East & Africa biodegradable plastic market by application, 2018 - 2030 (Kilotons) (USD Million)
Table 39 Saudi Arabia biodegradable plastic market by product, 2018 - 2030 (Kilotons) (USD Million)
Table 40 Saudi Arabia biodegradable plastic market by application, 2018 - 2030 (Kilotons) (USD Million)


List of Figures

Fig. 1 Market research process
Fig. 2 Data triangulation techniques
Fig. 3 Primary research pattern
Fig. 4 Market research approaches
Fig. 5 Information Procurement
Fig. 6 Market Formulation and Validation
Fig. 7 Data Validating & Publishing
Fig. 8 Market Segmentation & Scope
Fig. 9 Biodegradable Plastic Market Snapshot
Fig. 10 Product Segment Snapshot, 2023 (USD Million)
Fig. 11 Application Segment Snapshot, 2023 (USD Million)
Fig. 12 Competitive Landscape Snapshot
Fig. 13 Parent market outlook
Fig. 14 Biodegradable Plastic Market Value, 2023 (USD Million)
Fig. 15 Biodegradable Plastic Market - Value Chain Analysis
Fig. 16 Biodegradable Plastic Market - Market Dynamics
Fig. 17 Biodegradable Plastic Market - PORTER’s Analysis
Fig. 18 Biodegradable Plastic Market - PESTEL Analysis
Fig. 19 Biodegradable Plastic Market Estimates & Forecasts, By Product: Key Takeaways
Fig. 20 Biodegradable Plastic Market Share, By Product, 2023 & 2030
Fig. 21 Starch-Based Estimates & Forecasts, 2018 - 2030 (Kilotons) (USD Million)
Fig. 22 Polylactic Acid (PLA) Market Estimates & Forecasts, 2018 - 2030 (Kilotons) (USD Million)
Fig. 23 Polybutylene Adipate Terephthalate (PBAT) Market Estimates & Forecasts, 2018 - 2030 (Kilotons) (USD Million)
Fig. 24 Polybutylene Succinate (PBS) Market Estimates & Forecasts, 2018 - 2030 (Kilotons) (USD Million)
Fig. 25 Polyhydroxyalkanoate (PHA)Market Estimates & Forecasts, 2018 - 2030 (Kilotons) (USD Million)
Fig. 26 Others Market Estimates & Forecasts, 2018 - 2030 (Kilotons) (USD Million)
Fig. 27 Biodegradable Plastic Market Share, By Application, 2023 & 2030
Fig. 28 Packaging Market Estimates & Forecasts, 2018 - 2030 (Kilotons) (USD Million)
Fig. 29 Agriculture Market Estimates & Forecasts, 2018 - 2030 (Kilotons) (USD Million)
Fig. 30 Consumer Goods Market Estimates & Forecasts, 2018 - 2030 (Kilotons) (USD Million)
Fig. 31 Others Market Estimates & Forecasts, 2018 - 2030 (Kilotons) (USD Million)
Fig. 32 Biodegradable Plastic Market Revenue, By Region, 2023 & 2030 (USD Million)
Fig. 33 North America Biodegradable Plastic Market Estimates & Forecasts, 2018 - 2030 (Kilotons) (USD Million)
Fig. 34 U.S. Biodegradable Plastic Market Estimates & Forecasts, 2018 - 2030 (Kilotons) (USD Million)
Fig. 35 Canada Biodegradable Plastic Market Estimates & Forecasts, 2018 - 2030 (Kilotons) (USD Million)
Fig. 36 Mexico Biodegradable Plastic Market Estimates & Forecasts, 2018 - 2030 (Kilotons) (USD Million)
Fig. 37 Europe Biodegradable Plastic Market Estimates & Forecasts, 2018 - 2030 (Kilotons) (USD Million)
Fig. 38 Germany Biodegradable Plastic Market Estimates & Forecasts, 2018 - 2030 (Kilotons) (USD Million)
Fig. 39 UK Biodegradable Plastic Market Estimates & Forecasts, 2018 - 2030 (Kilotons) (USD Million)
Fig. 40 Italy Biodegradable Plastic Market Estimates & Forecasts, 2018 - 2030 (Kilotons) (USD Million)
Fig. 41 France Biodegradable Plastic Market Estimates & Forecasts, 2018 - 2030 (Kilotons) (USD Million)
Fig. 42 Asia Pacific Biodegradable Plastic Market Estimates & Forecasts, 2018 - 2030 (Kilotons) (USD Million)
Fig. 43 China Biodegradable Plastic Market Estimates & Forecasts, 2018 - 2030 (Kilotons) (USD Million)
Fig. 44 India Biodegradable Plastic Market Estimates & Forecasts, 2018 - 2030 (Kilotons) (USD Million)
Fig. 45 Japan Biodegradable Plastic Market Estimates & Forecasts, 2018 - 2030 (Kilotons) (USD Million)
Fig. 46 Central & South America Biodegradable Plastic Market Estimates & Forecasts, 2018 - 2030 (Kilotons) (USD Million)
Fig. 47 Brazil Biodegradable Plastic Market Estimates & Forecasts, 2018 - 2030 (Kilotons) (USD Million)
Fig. 48 Middle East & Africa Biodegradable Plastic Market Estimates & Forecasts, 2018 - 2030 (Kilotons) (USD Million)
Fig. 49 Saudi Arabia Biodegradable Plastic Market Estimates & Forecasts, 2018 - 2030 (Kilotons) (USD Million)
Fig. 50 Key Company Categorization
Fig. 51 Company Market Positioning
Fig. 52 Key Company Market Share Analysis, 2023
Fig. 53 Strategy Mapping

What questions do you have? Get quick response from our industry experts. Request a Free Consultation

Market Segmentation

  • Biodegradable Plastics Material Outlook (Volume, Kilotons; Revenue, USD Million, 2018 - 2030)
    • Starch Based
    • PLA
    • PBAT
    • PBS
    • PHA
    • Others
  • Biodegradable Plastics End Use Outlook (Volume, Kilotons; Revenue, USD Million, 2018 - 2030)
    • Packaging
      • Food Packaging
      • Non-Food Packaging
    • Agriculture
    • Textiles
    • Consumer Goods
    • Others
  • Biodegradable Plastics Regional Outlook (Volume, Kilotons; Revenue, USD Million, 2018 - 2030)
    • North America
      • North America Biodegradable Plastic Market, By Material
        • Starch Based
        • PLA
        • PBAT
        • PBS
        • PHA
        • Others
      • North America Biodegradable Plastic Market, By End Use
        • Packaging
          • Food Packaging
          • Non-Food Packaging
        • Agriculture
        • Textiles
        • Consumer Goods
        • Others
      • U.S.
        • U.S. Biodegradable Plastic Market, By Material
          • Starch Based
          • PLA
          • PBAT
          • PBS
          • PHA
          • Others
        • U.S. Biodegradable Plastic Market, By End Use
          • Packaging
            • Food Packaging
            • Non-Food Packaging
          • Agriculture
          • Textiles
          • Consumer Goods
          • Others
      • Canada
        • Canada Biodegradable Plastic Market, By Material
          • Starch Based
          • PLA
          • PBAT
          • PBS
          • PHA
          • Others
        • Canada Biodegradable Plastic Market, By End Use
          • Packaging
            • Food Packaging
            • Non-Food Packaging
          • Agriculture
          • Textiles
          • Consumer Goods
          • Others
      • Mexico
        • Mexico Biodegradable Plastic Market, By Material
          • Starch Based
          • PLA
          • PBAT
          • PBS
          • PHA
          • Others
        • Mexico Biodegradable Plastic Market, By End Use
          • Packaging
            • Food Packaging
            • Non-Food Packaging
          • Agriculture
          • Textiles
          • Consumer Goods
          • Others
    • Europe
      • Europe Biodegradable Plastic Market, By Material
        • Starch Based
        • PLA
        • PBAT
        • PBS
        • PHA
        • Others
      • Europe Biodegradable Plastic Market, By End Use
        • Packaging
          • Food Packaging
          • Non-Food Packaging
        • Agriculture
        • Textiles
        • Consumer Goods
        • Others
      • Germany
        • Germany Biodegradable Plastic Market, By Material
          • Starch Based
          • PLA
          • PBAT
          • PBS
          • PHA
          • Others
        • Germany Biodegradable Plastic Market, By End Use
          • Packaging
            • Food Packaging
            • Non-Food Packaging
          • Agriculture
          • Textiles
          • Consumer Goods
          • Others
      • UK
        • UK Biodegradable Plastic Market, By Material
          • Starch Based
          • PLA
          • PBAT
          • PBS
          • PHA
          • Others
        • UK Biodegradable Plastic Market, By End Use
          • Packaging
            • Food Packaging
            • Non-Food Packaging
          • Agriculture
          • Textiles
          • Consumer Goods
          • Others
      • Italy
        • Italy Biodegradable Plastic Market, By Material
          • Starch Based
          • PLA
          • PBAT
          • PBS
          • PHA
          • Others
        • Italy Biodegradable Plastic Market, By End Use
          • Packaging
            • Food Packaging
            • Non-Food Packaging
          • Agriculture
          • Textiles
          • Consumer Goods
          • Others
      • Spain
        • Spain Biodegradable Plastic Market, By Material
          • Starch Based
          • PLA
          • PBAT
          • PBS
          • PHA
          • Others
        • Spain Biodegradable Plastic Market, By End Use
          • Packaging
            • Food Packaging
            • Non-Food Packaging
          • Agriculture
          • Textiles
          • Consumer Goods
          • Others
      • France
        • France Biodegradable Plastic Market, By Material
          • Starch Based
          • PLA
          • PBAT
          • PBS
          • PHA
          • Others
        • France Biodegradable Plastic Market, By End Use
          • Packaging
            • Food Packaging
            • Non-Food Packaging
          • Agriculture
          • Textiles
          • Consumer Goods
          • Others
    • Asia Pacific
      • Asia Pacific Biodegradable Plastic Market, By Material
        • Starch Based
        • PLA
        • PBAT
        • PBS
        • PHA
        • Others
      • Asia Pacific Biodegradable Plastic Market, By End Use
        • Packaging
          • Food Packaging
          • Non-Food Packaging
        • Agriculture
        • Textiles
        • Consumer Goods
        • Others
      • China
        • China Biodegradable Plastic Market, By Material
          • Starch Based
          • PLA
          • PBAT
          • PBS
          • PHA
          • Others
        • China Biodegradable Plastic Market, By End Use
          • Packaging
            • Food Packaging
            • Non-Food Packaging
          • Agriculture
          • Textiles
          • Consumer Goods
          • Others
      • India
        • India Biodegradable Plastic Market, By Material
          • Starch Based
          • PLA
          • PBAT
          • PBS
          • PHA
          • Others
        • India Biodegradable Plastic Market, By End Use
          • Packaging
            • Food Packaging
            • Non-Food Packaging
          • Agriculture
          • Textiles
          • Consumer Goods
          • Others
      • Japan
        • Japan Biodegradable Plastic Market, By Material
          • Starch Based
          • PLA
          • PBAT
          • PBS
          • PHA
          • Others
        • Japan Biodegradable Plastic Market, By End Use
          • Packaging
            • Food Packaging
            • Non-Food Packaging
          • Agriculture
          • Textiles
          • Consumer Goods
          • Others
      • South Korea
        • South Korea Biodegradable Plastic Market, By Material
          • Starch Based
          • PLA
          • PBAT
          • PBS
          • PHA
          • Others
        • South Korea Biodegradable Plastic Market, By End Use
          • Packaging
            • Food Packaging
            • Non-Food Packaging
          • Agriculture
          • Textiles
          • Consumer Goods
          • Others
    • Central & South America
      • Central & South America Biodegradable Plastic Market, By Material
        • Starch Based
        • PLA
        • PBAT
        • PBS
        • PHA
        • Others
      • Central & South America Biodegradable Plastic Market, By End Use
        • Packaging
          • Food Packaging
          • Non-Food Packaging
        • Agriculture
        • Textiles
        • Consumer Goods
        • Others
      • Brazil
        • Brazil Biodegradable Plastic Market, By Material
          • Starch Based
          • PLA
          • PBAT
          • PBS
          • PHA
          • Others
        • Brazil Biodegradable Plastic Market, By End Use
          • Packaging
            • Food Packaging
            • Non-Food Packaging
          • Agriculture
          • Textiles
          • Consumer Goods
          • Others
    • Middle East & Africa
      • Middle East & Africa Biodegradable Plastic Market, By Material
        • Starch Based
        • PLA
        • PBAT
        • PBS
        • PHA
        • Others
      • Middle East & Africa Biodegradable Plastic Market, By End Use
        • Packaging
          • Food Packaging
          • Non-Food Packaging
        • Agriculture
        • Textiles
        • Consumer Goods
        • Others
      • Saudi Arabia
        • Saudi Arabia Biodegradable Plastic Market, By Material
          • Starch Based
          • PLA
          • PBAT
          • PBS
          • PHA
          • Others
        • Saudi Arabia Biodegradable Plastic Market, By End Use
          • Packaging
            • Food Packaging
            • Non-Food Packaging
          • Agriculture
          • Textiles
          • Consumer Goods
          • Others

Report content

Qualitative Analysis

  • Industry overview
  • Industry trends
  • Market drivers and restraints
  • Market size
  • Growth prospects
  • Porter’s analysis
  • PESTEL analysis
  • Key market opportunities prioritized
  • Competitive landscape
    • Company overview
    • Financial performance
    • Product benchmarking
    • Latest strategic developments

Quantitative Analysis

  • Market size, estimates, and forecast from 2018 to 2030
  • Market estimates and forecast for product segments up to 2030
  • Regional market size and forecast for product segments up to 2030
  • Market estimates and forecast for application segments up to 2030
  • Regional market size and forecast for application segments up to 2030
  • Company financial performance
What questions do you have? Get quick response from our industry experts. Request a Free Consultation

Research Methodology

Grand View Research employs a comprehensive and iterative research methodology focused on minimizing deviance in order to provide the most accurate estimates and forecast possible. The company utilizes a combination of bottom-up and top-down approaches for segmenting and estimating quantitative aspects of the market. In Addition, a recurring theme prevalent across all our research reports is data triangulation that looks market from three different perspectives. Critical elements of the methodology employed for all our studies include:

Preliminary data mining

Raw market data is obtained and collated on a broad front. Data is continuously filtered to ensure that only validated and authenticated sources are considered. In addition, data is also mined from a host of reports in our repository, as well as a number of reputed paid databases. For a comprehensive understanding of the market, it is essential to understand the complete value chain, and in order to facilitate this; we collect data from raw material suppliers, distributors as well as buyers.

Technical issues and trends are obtained from surveys, technical symposia, and trade journals. Technical data is also gathered from an intellectual property perspective, focusing on white space and freedom of movement. Industry dynamics with respect to drivers, restraints, pricing trends are also gathered. As a result, the material developed contains a wide range of original data that is then further cross-validated and authenticated with published sources.

Statistical model

Our market estimates and forecasts are derived through simulation models. A unique model is created customized for each study. Gathered information for market dynamics, technology landscape, application development, and pricing trends are fed into the model and analyzed simultaneously. These factors are studied on a comparative basis, and their impact over the forecast period is quantified with the help of correlation, regression, and time series analysis. Market forecasting is performed via a combination of economic tools, technological analysis, industry experience, and domain expertise.

Econometric models are generally used for short-term forecasting, while technological market models are used for long-term forecasting. These are based on an amalgamation of the technology landscape, regulatory frameworks, economic outlook, and business principles. A bottom-up approach to market estimation is preferred, with key regional markets analyzed as separate entities and integration of data to obtain global estimates. This is critical for a deep understanding of the industry as well as ensuring minimal errors. Some of the parameters considered for forecasting include:

    • Market drivers and restraints, along with their current and expected impact
    • Raw material scenario and supply v/s price trends
    • Regulatory scenario and expected developments
    • Current capacity and expected capacity additions up to 2030

We assign weights to these parameters and quantify their market impact using weighted average analysis, to derive an expected market growth rate.

Primary validation

This is the final step in estimating and forecasting for our reports. Exhaustive primary interviews are conducted, face to face as well as over the phone to validate our findings and assumptions used to obtain them. Interviewees are approached from leading companies across the value chain including suppliers, technology providers, domain experts, and buyers so as to ensure a holistic and unbiased picture of the market. These interviews are conducted across the globe, with language barriers overcome with the aid of local staff and interpreters. Primary interviews not only help in data validation but also provide critical insights into the market, current business scenario, and future expectations and enhance the quality of our reports. All our estimates and forecast are verified through exhaustive primary research with Key Industry Participants (KIPs) which typically include:

    • Market-leading companies
    • Raw material suppliers
    • Product distributors
    • Buyers

The key objectives of primary research are as follows:

    • To validate our data in terms of accuracy and acceptability
    • To gain an insight in to the current market and future expectations

Data Collection Matrix

Perspective

Primary research

Secondary research

Supply-side

  • Manufacturers
  • Technology distributors and wholesalers
  • Company reports and publications
  • Government publications
  • Independent investigations
  • Economic and demographic data

Demand-side

  • End-user surveys
  • Consumer surveys
  • Mystery shopping
  • Case studies
  • Reference customers


Industry Analysis Matrix

Qualitative analysis

Quantitative analysis

  • Industry landscape and trends
  • Market dynamics and key issues
  • Technology landscape
  • Market opportunities
  • Porter’s analysis and PESTEL analysis
  • Competitive landscape and component benchmarking
  • Policy and regulatory scenario
  • Market revenue estimates and forecast up to 2030
  • Market revenue estimates and forecasts up to 2030, by technology
  • Market revenue estimates and forecasts up to 2030, by application
  • Market revenue estimates and forecasts up to 2030, by type
  • Market revenue estimates and forecasts up to 2030, by component
  • Regional market revenue forecasts, by technology
  • Regional market revenue forecasts, by application
  • Regional market revenue forecasts, by type
  • Regional market revenue forecasts, by component


What questions do you have? Get quick response from our industry experts. Request a Free Consultation
pdf icn

GET A FREE SAMPLE

arrow icn

This FREE sample includes data points, ranging from trend analyses to estimates and forecasts. See for yourself.

gvr icn

NEED A CUSTOM REPORT?

We can customize every report - free of charge - including purchasing stand-alone sections or country-level reports, as well as offer affordable discounts for start-ups & universities. Contact us now

Certified Icon

We are GDPR and CCPA compliant! Your transaction & personal information is safe and secure. For more details, please read our privacy policy.