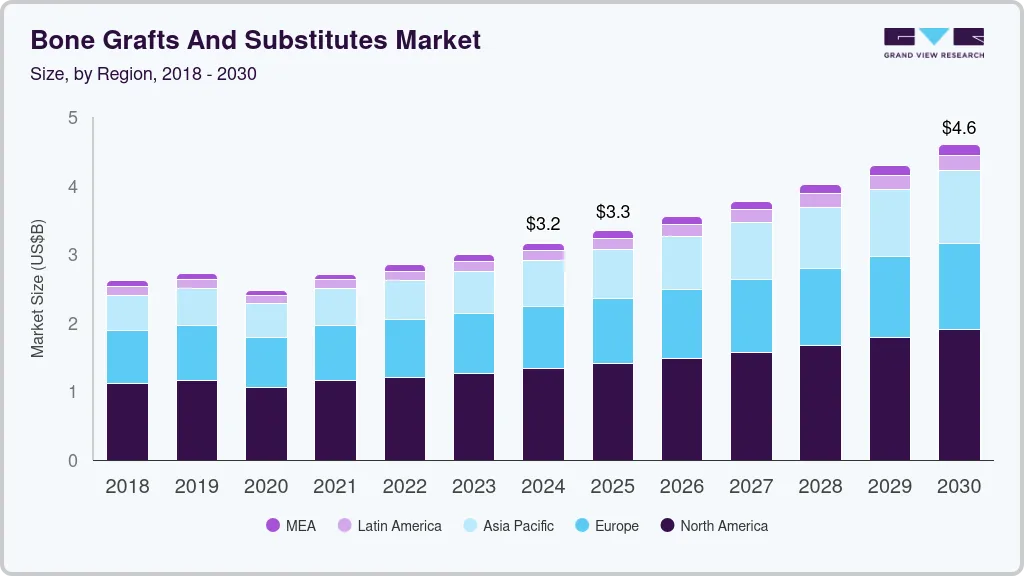
The global bone grafts and substitutes market size was valued at USD 3.12 billion in 2024 and is estimated to grow at a CAGR of 6.6% from 2025 to 2030. Increasing demand for synthetic substitutes and a rising number of product approvals by regulatory authorities in various regions are anticipated to fuel market growth during the forecast period. For instance, in October 2023, Orthofix Medical Inc., a prominent company specializing in spine and orthopedic solutions, revealed the 510k clearance and complete commercial introduction of OsteoCove, a sophisticated bioactive synthetic graft.
Similarly, in July 2020, Baxter received U.S. FDA clearance for its Altapore Shape Bioactive Bone Graft. This expanded the company’s Altapore bone graft substitute lineup. Furthermore, various benefits and advantages of bone grafts and substitutes, such as biocompatibility, safety, and osteoconductivity to fractured bones, have propelled the adoption of these products in recent years.
The COVID-19 pandemic has had a significant impact on the market. Like many other industries, the bone grafts and substitutes market has experienced disruptions in supply chains, manufacturing, and distribution due to the pandemic. One of the major impacts of COVID-19 on the market has been a decline in elective procedures. To conserve hospital resources and reduce the risk of COVID-19 transmission, many hospitals and clinics have postponed elective surgeries. This has led to a decrease in demand for grafts and substitutes, which are often used in elective procedures such as joint replacements. In addition, the pandemic severely disrupted global supply chains, including those that produce the raw materials needed to manufacture bone grafts and substitutes. This has led to shortages of some products and increased costs for others. But, after the COVID-19 pandemic, the market has started to gain momentum and is growing at a significant pace in the coming years.
Furthermore, a supportive regulatory framework and growing efforts from market participants to develop new products with better bioactivity, biocompatibility, and suitable mechanical properties are further driving market expansion. For instance, in March 2022, Molecular Matrix, Inc. announced the commercial launch of Osteo-P Synthetic Bone Graft Substitute for use in the musculoskeletal system. This product is developed by using HCCP technology which is very beneficial in bone regeneration and repair. Similarly, in October 2020, Graftys received Medical Device Single Audit Program (MDSAP) certification for its Sterile Calcium Phosphate Resorbable Bone Void Fillers and related delivery systems in Australia, Brazil, Canada, and the U.S.
The rising adoption of minimally invasive procedures is further escalating the demand for bone grafts and substitutes. Surgeons are choosing minimally invasive procedures instead of open or traditional approaches owing to various benefits associated with MIS such as quick procedures, less recovery time, shorter hospital stays, and fewer incisions. According to data from the American Academy of Orthopedic Surgeons (AAOS), the number of minimally invasive orthopedic procedures performed in the U.S. has been increasing steadily over the years. Some of the commonly performed minimally invasive orthopedic procedures in the U.S. are arthroscopy, spine surgeries, fracture repair, and joint replacement procedures. Thus, the rising number of MIS is anticipated to drive the global bone grafts and substitutes market at a significant pace.
The increasing incidence of bone disorders due to road accidents and sports injuries is driving the market for bone grafts and substitutes. Bone grafts can be used for the following purposes:
To repair a broken bone
To repair previously injured bone that has not healed.
Spinal fusion (in case of an unstable spine)
Bone regeneration
To heal the bone around surgical implantation (joint & knee replacement)
Spinal fusion surgery is mostly performed among all the above-mentioned bone grafting procedures. According to a study published by NCBI in October 2022, the prevalence of Adult Spinal Deformities (ASD) is around 68% in the geriatric population. The burden of ASD is higher in people as compared to other chronic conditions such as diabetes, arthritis, chronic lung disease, and congestive heart failure. The common causes of spinal fusion injury are trauma, falls, collisions, and road traffic accidents. According to the American Association for the Surgery of Trauma, more than 3 million nonfatal injuries are reported in the U.S. every year. An increase in trauma incidents is anticipated to contribute to the market growth during the forecast period.
The global market is characterized by a high degree of innovation, with new technologies and methods being developed and introduced at regular intervals. For instance, in June 2023, BONESUPPORT, a leading company in orthobiologics for treating bone injuries, revealed the introduction of the latest version of the company's innovative antibiotic-releasing bone graft substitute, CERAMENT G. Enhancements to CERAMENT G have been implemented to enhance usability and minimize environmental footprint.
Several market players engage in mergers and acquisitions to strengthen their market position. This strategy enables companies to increase their capabilities, expand their product portfolios, and improve competency. Key players engaging in this growth strategy include Baxter International Inc., Medtronic, and Smith & Nephew, among others. In June 2023, Biocomposites, a global company specializing in medical devices for bone regeneration and infection management, revealed its purchase of Artoss GmbH (Artoss), a company that specializes in creating advanced bone graft substitutes for orthopedics, spinal, foot, and ankle, and dental applications.
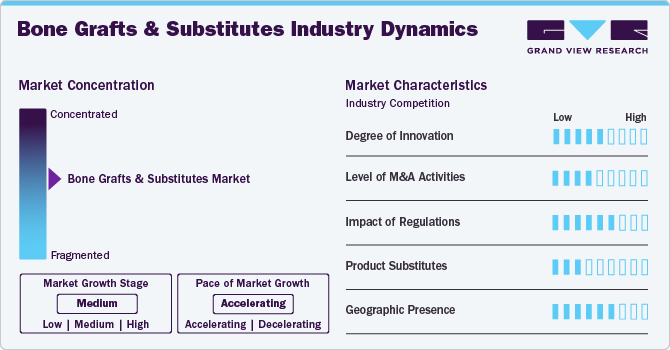
Stringent regulatory guidelines issued by various regulatory agencies, such as the U.S. FDA, limit the market growth. For instance, in March 2022, the U.S. FDA rejected OsteoLife Biomedical LLC’s Flexo-Membrane, Freeze-Dried Particulate Bone products, and Flexo-Plate. The FDA found significant contamination due to the presence of Bacillus, Stenotrophomonas maltophilia, and Pseudomonas aeruginosa post-processing.
Various companies in the bone grafts and substitute market are adopting this strategy to maintain a competitive edge and to be ahead of the newly evolving landscape in the market. For instance, in August 2024, LifeNet Health, a regenerative health company, revealed the introduction of its latest bone allograft, created in partnership with the healthcare leader Johnson & Johnson MedTech, as the company prepares to enter the demineralized bone matrix (DBM) market.
Major players in the market are adopting various strategies including partnerships, collaborations, mergers, and acquisitions to expand their footprints in global markets. For instance, in August 2022, Orthofix Medical, Inc. entered a partnership with CGBio for the commercialization and development of Novosis rhBMP-2 for Canada and U.S. markets.
The allograft segment held the largest revenue share of 60.2% in 2024 and is anticipated to witness significant growth opportunities from 2025 to 2030. The allograft adoption is significantly increasing owing to its properties such as osteoconductivity, and immediate structural support. In addition, positive patient outcomes with allograft products and various recent launches of allografts have supported the segment expansion. Axogen Inc. launched the Avive+ soft tissue matrix in June 2024. It is designed to serve as a barrier for safeguarding and facilitating the recovery of the peripheral nerve following sudden traumatic injury. Also, allografts do not require other surgery to harvest bone, which results in rapid wound healing, lesser surgery time, and higher success rates. For instance, according to a study published by NCBI in February 2022, bone fusion with allograft showed a success rate between the range of 87% and 94.3%.
The synthetic segment is projected to exhibit the fastest growth over the forecast period. The robust growth of the segment is owing to the products’ lesser risk of disease transmission, better biocompatibility, and better acceptance among patients when compared to allografts. The synthetic segment is further classified into ceramic, composite, polymers, and BMP. The segment is also expected to be driven by the rising burden of orthopedic disorders coupled with increasing demand for synthetic products in developed countries.
In the application segment, the spinal fusion sub-segment held the largest market share of 59.9% in 2024. The increasing adoption of bone graft materials for spondylosyndesis and the rising geriatric population prone to a number of orthopedic ailments are responsible for higher revenue share of the segment. The geriatric population is steadily increasing. According to the U.S. Census Bureau, in 2022, the country had geriatric population of around 56 million, accounting for 16.9% of the country’s total population, and this number is projected to surpass 73.1 million in 2030. This indicates that more than one in five people will be of retirement age. Thus, the high number of elderly populations is fueling demand for orthopedic solutions.
The rising adoption of grafts for dental procedures is likely to provide lucrative opportunities for the dental segment throughout the forecast period. The grafts are usually used as scaffold and filler to facilitate bone formation as well as to promote healing. The increasing acceptance of dental implant surgical procedures along with advanced techniques such as bone grafts and bone regeneration are projected to boost market growth. Moreover, the rising success rates of dental implants is also resulting into the high demand for bone grafts & substitutes in the market.
North America bone grafts and substitutes market dominated the global market in 2024 and accounted for the largest revenue share of 41.4%. The rising geriatric population and increasing incidence of sports injuries & fatal accidents are among the key factors boosting the demand for bone grafts and substitutes in North America. In addition, the presence of well-established healthcare infrastructure, supportive reimbursement policies, and the presence of a large number of orthopedic surgeons performing surgeries with bone grafts are further fueling the adoption of such products in the region. For instance, according to Definitive Healthcare, LLC, the U.S. currently has 24,350 orthopedic surgeons.
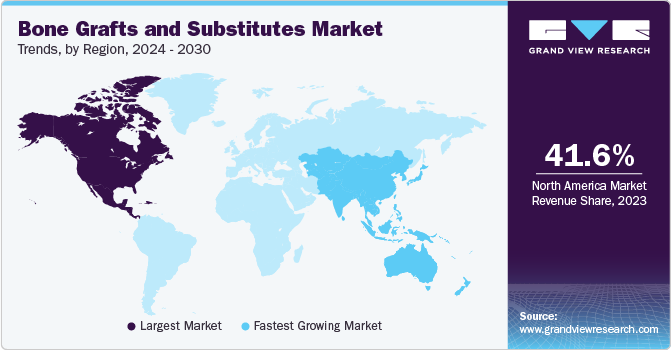
The bone grafts & substitutes market in the U.S. is anticipated to grow at a significant rate during the forecast period. Increasing sports injuries will supplement the demand for bone grafts and substitutes. For instance, in the United States, approximately 30 million kids and teenagers engage in various organized sports, resulting in over 3.5 million injuries annually.
Canada bone grafts & substitutes market is anticipated to grow at a significant rate soon. Healthcare funding in the country has increased, accounting for 11.5% of the total GDP in 2022. The easy availability of advanced products and the presence of wide distribution networks of international players in Canada are among the factors anticipated to boost the market. Moreover, an increase in the incidence of sports-related injuries is expected to boost the market in the coming years.
The bone grafts & substitutes market in Europe is projected to witness the fastest growth over the forecast period from 2025 to 2030. The increasing prevalence of orthopedic conditions and road accidents that require bone grafts and substitutes are fostering market growth. In Italy, the year 2022 saw a 9.9% increase in road accident fatalities, with 3,159 people losing their lives. The number of injuries also rose by 9.2% to reach 223,475, and the total number of road accidents was 165,889.
Germany bone grafts & substitutes market is anticipated to grow at a significant rate during the forecast period. Growing cases of bone fracture in the region are fostering market growth. According to a report by the International Osteoporosis Foundation, Germany experiences over 831,000 fragility fractures every year, which is equal to 95 broken bones per hour.
Asia Pacific is projected to witness the fastest growth over the forecast period from 2025 to 2030. The presence of a larger patient pool with a range of orthopedic conditions, and rising investments by market participants to expand their presence in the region are expected to drive the APAC market. For instance, in October 2021, CoreBone raised USD 3.7 million in investment to expand its activity in China and commercialize bioactive bone graft material for orthopedic and dental treatments.
China bone grafts & substitutes market is expected to have the largest geriatric population in the world in the near future owing to the rapidly aging population in the country. As a result, the prevalence of orthopedic diseases is expected to increase rapidly in China. Furthermore, a less stringent regulatory framework for product approval is resulting in easy entry of advanced products into the market. In addition, the availability of resources that enable the development of advanced technology at a cheaper cost is resulting in an increased number of manufacturing facilities in the country. For instance, in October 2021, CoreBone raised USD 3.7 million in investment to expand its activity in China and commercialize bioactive bone graft material for orthopedic and dental treatments.
The bone grafts & substitutes market in Latin America is projected to witness the fastest growth over the forecast period from 2025 to 2030. An increasing geriatric population coupled with rising orthopedic diseases is anticipated to boost market growth.Latin America and the Caribbean have 88.6 million people aged 60 years and over as of 2022, comprising 13.4% of the total population. This proportion is projected to reach 16.5% by 2030.
Brazil bone grafts & substitutes market is anticipated to grow at a significant rate during the forecast period. An increasing number of joint replacements and fractures in Brazil will supplement the market growth. As per a 2023 publication by the National Library of Medicine, the occurrence of hip fractures rises significantly with age, and women aged 70 and above have a risk about 50% higher than men of the same age.
The bone grafts & substitutes market in the Middle East & Africa is projected to witness the fastest growth over the forecast period from 2025 to 2030. Increasing dental procedures and growing sports participation in the region are supplementing regional growth. Furthermore, the increasing prevalence of orthopedic diseases will further escalate market growth.
South Africa bone grafts and substitutes is projected to witness the fastest growth over the forecast period from 2025 to 2030. The increasing prevalence of orthopedic conditions including osteoporosis is escalating market growth. According to the NOFSA (National Osteoporosis Foundation of South Africa), in South Africa, it is estimated that one out of every three women and one out of every five men may develop osteoporosis during their lifetime.
The market is marked by the presence of various large and small business operators. It is competitive and dominated by participants such as Orthofix, Stryker, Nuvasive, Medtronic, DePuy Synthes, and Wright Medical, among others. Key players are emphasizing executing innovative strategies like market penetration, mergers and acquisitions, partnerships, and distribution agreements to bolster their revenue.
The following are the leading companies in the bone grafts & substitutes market. These companies collectively hold the largest market share and dictate industry trends.
View a comprehensive list of companies in the Bone Grafts & Substitutes Market
Some innovators in the bone grafts and substitutes market are:
Stryker Corporation: Vitoss is the present synthetic bone graft market leader and has been used in over 425,000 implantations worldwide. It is meant to fill bone gaps and voids in the skeletal system, specifically at the pelvis or posterolateral spine.
Depuy Synthes: The top product is chronOS Bone Void Filler. This filler has been used in clinics in Europe for over 20 years. It is replaced with bone in 6 to 18 months. The compressive strength of the product is approximated to that of the human cancellous bone. ChronOS can be used in bony voids or caps that are not intrinsic to the stability of a bony structure.
Baxter International Inc: Actifuse is a biosimulative scaffold bone graft substitute made up of silicate-substituted calcium phosphate that is devised to fill gaps in the skeletal system that are not inherent to the strength of the bony structure. When compared to the gold standard of iliac crest autograft care, Actifuse demonstrated comparable bone fusion rates. Actifuse is versatile and resistant to irrigation, and it contains 0.8% silicon, which has been shown in both preclinical and clinical studies to successfully accelerate bone formation.
In October 2023, Orthofix Medical Inc. announced the 510k approval and full commercial launch of OsteoCoveTM, an innovative bioactive synthetic graft. OsteoCove, which comes in putty and strip form, offers exceptional bone-forming qualities for various orthopedic and spine procedures.
In March 2022, Zimmer Biomet entered into an agreement with Biocomposites for the distribution of genex bone graft substitutes.
In February 2022, Orthofix Medical Inc. unveiled Opus BA, a synthetic bioactive bone graft solution designed for lumbar and cervical spine fusion surgeries.
Report Attribute |
Details |
The market size value in 2025 |
USD 3.30 billion |
The revenue forecast in 2030 |
USD 4.54 billion |
Growth rate |
CAGR of 6.6% from 2025 to 2030 |
Actual data |
2018 - 2024 |
Forecast period |
2025 - 2030 |
Quantitative units |
Revenue in USD million/billion& CAGR from 2025 to 2030 |
Report coverage |
Revenue forecast, company ranking, competitive landscape, growth factors, and trends |
Segments covered |
Material type, application, region |
Regions covered |
North America; Europe; Asia Pacific; Latin America; MEA |
Country Scope |
U.S.; Canada; UK; Germany; Italy; France; Spain; Denmark, Norway, Sweden, Japan; China; India; South Korea; Australia, Brazil; Mexico; Argentina, South Africa, Saudi Arabia, UAE, Kuwait |
Key companies profiled |
AlloSource; Baxter; DePuy Synthes; Medtronic; NuVasive, Inc.; Orthofix Medical, Inc.; Smith + Nephew; Stryker.; OST Laboratories; Zimmer Biomet; Geistlich Pharma AG; Biobank |
Customization scope |
Free report customization (equivalent up to 8 analysts’ working days) with purchase. Addition or alteration to country, regional & segment scope. |
Pricing and purchase options |
Avail customized purchase options to meet your exact research needs. Explore purchase options |
This report forecasts revenue growth at the global, regional & country level and provides an analysis of the latest trends and opportunities in each of the sub-segments from 2018 to 2030. For this report, Grand View Research has segmented the global bone grafts and substitutes market report based on the material type, application, and region:
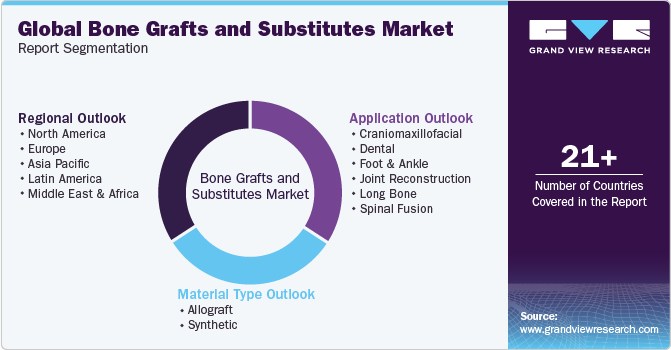
Material Type Outlook (Revenue, USD Million, 2018 - 2030)
Allograft
Demineralized Bone Matrix
Others
Synthetic
Ceramics
HAP
β-TCP
α-TCP
Bi-phasic Calcium Phosphates (BCP)
Others
Composites
Polymers
Bone Morphogenic Proteins (BMP)
Application Outlook (Revenue, USD Million, 2018 - 2030)
Craniomaxillofacial
Dental
Foot & Ankle
Joint Reconstruction
Long Bone
Spinal Fusion
Regional Outlook (Revenue, USD Million, 2018 - 2030)
North America
U.S.
Canada
Europe
Germany
UK
France
Italy
Spain
Denmark
Sweden
Norway
Asia Pacific
China
India
Japan
South Korea
Australia
Latin America
Brazil
Mexico
Argentina
MEA
South Africa
Saudi Arabia
UAE
Kuwait
b. The global bone graft and substitutes market size was estimated at USD 3.12 billion in 2024 and is expected to reach USD 3.30 billion in 2025.
b. The global bone graft and substitutes market is expected to grow at a compound annual growth rate of 6.6% from 2025 to 2030 to reach USD 4.54 billion by 2030.
b. The allograft material type segment dominated the bone graft and substitutes market in 2024. This is attributable to properties such as immediate structural support and osteoconductivity. Moreover, allografts do not require another surgery to harvest bone, which results in reduced surgery time and rapid wound healing.
b. Some key players operating in the bone graft and substitutes market include DePuy Synthes; Medtronic PLC; Nuvasive, Inc.; Orthofix Holdings, Inc.; Wright Medical Group N.V.; AlloSource, Inc.; and Stryker Corp.
b. Key factors that are driving the bone graft and substitutes market growth include the increasing number of spinal fusion surgeries, target population, and adoption of allografts.
Table of Contents
Chapter 1 Research Methodology & Scope
1.1 Market Segmentation & Scope
1.1.1 Estimates and Forecast Timeline
1.2 Research Methodology
1.3 Information Procurement
1.3.1 Purchased database:
1.3.2 GVR’s Internal Database
1.3.3 Secondary sources
1.3.4 Primary Research:
1.3.5 Details of Primary Research
1.4 Information or Data Analysis
1.4.1 Data Analysis Models
1.5 Market Formulation & Validation
1.6 Model Details
1.7 List of Secondary Sources
1.8 List of Primary Sources
1.9 Abbreviations
1.10 Report Objectives
Chapter 2 Executive Summary
2.1 Market Outlook
2.2 Segment Outlook
2.2.1. Material type outlook
2.2.2. Application outlook
2.2.3. Regional outlook
2.3 Competitive Insights
Chapter 3 Bone Grafts & Substitutes Market Variables, Trends & Scope
3.1 Regulatory Framework
3.2 USFDA Consideration
3.2.1 Bone grafts & substitutes that are found to be medically necessary
3.3 Reimbursement framework
3.3.1 CPT Coding
3.3.2 HCPCS Coding
3.3.3 Market driver analysis
3.3.3.1 Rising incidence of bone & joint disorders
3.3.3.2 Advent of biocompatible synthetic graft
3.3.3.3 Rising demand for dental bone grafts
3.3.3.4 Technological advancement
3.3.3.5 Rising geriatric population
3.3.4 Market restraint analysis
3.3.4.1 Stringent regulatory guidelines
3.3.4.2 Risk of disease transmission
3.3.4.3 High cost of bone grafts and substitutes
3.4 Bone Grafts & Substitutes Market Analysis Tools: Porter’s
3.5 PESTEL Analysis
3.6 Estimated Market Volume, By Material Type, Global & Regional, 2018-2030
3.7 Pricing Analysis, By Material Type
Chapter 5 Bone Grafts & Substitutes Market: Material Type Estimates & Trend Analysis
5.1 Material Type Dashboard
5.1.1 Allograft
5.1.1.1 Allograft market estimates and forecasts, 2018 - 2030 (USD Million)
5.1.1.2 Demineralized Bone Matrix (DBM)
5.1.1.2.1. Demineralized Bone Matrix (DBM) market estimates and forecasts, 2018 - 2030 (USD Million)
5.1.1.3 Others
5.1.1.3.1 Others market estimates and forecasts, 2018 - 2030 (USD Million)
5.1.2 Synthetic
5.1.2.1 Synthetic market estimates and forecasts, 2018 - 2030 (USD Million)
5.1.2.2 Ceramic
5.1.2.2.1 Ceramic market estimates and forecasts, 2018 - 2030 (USD Million)
5.1.2.2.2 HAP
5.1.2.2.2.1 HAP market estimates and forecasts, 2018 - 2030 (USD Million)
5.1.2.2.3 ß-TCP
5.1.2.2.3.1 ß-TCP market estimates and forecasts, 2018 - 2030 (USD Million)
5.1.2.2.4 αlpha-tricalcium phosphate (αlpha-TCP)
5.1.2.2.4.1 αlpha-TCP market estimates and forecasts, 2018 - 2030 (USD Million)
5.1.2.2.5 Bi-phasic calcium phosphates (BCP)
5.1.2.2.5.1 Bi-phasic calcium phosphates (BCP) market estimates and forecasts, 2018 - 2030 (USD Million)
5.1.2.2.6 Others
5.1.2.2.6.1 Others market estimates and forecasts, 2018 - 2030 (USD Million)
5.1.2.3 Composite
5.1.2.3.1 Composite market estimates and forecasts, 2018 - 2030 (USD Million)
5.1.2.4 Polymers
5.1.2.4.1 Polymers market estimates and forecasts, 2018 - 2030 (USD Million)
5.1.2.5 BMP
5.1.2.5.1 BMP market estimates and forecasts, 2018 - 2030 (USD Million)
Chapter 6 Bone Grafts & Substitutes Market: Application Estimates & Trend Analysis
6.1. Application Dashboard
6.2 Craniomaxillofacial
6.2.1 Craniomaxillofacial market estimates and forecasts, 2018 - 2030 (USD Million)
6.3 Dental
6.3.1 Dental market estimates and forecasts, 2018 - 2030 (USD Million)
6.4 Foot & Ankle
6.4.1 Foot & Ankle market estimates and forecasts, 2018 - 2030 (USD Million)
6.5 Joint Reconstruction
6.5.1 Joint Reconstruction market estimates and forecasts, 2018 - 2030 (USD Million)
6.6 Long Bone
6.6.1 Long Bone market estimates and forecasts, 2018 - 2030 (USD Million)
6.7 Spinal Fusion
6.7.1 Spinal Fusion market estimates and forecasts, 2018 - 2030 (USD Million)
Chapter 7 Bone Grafts & Substitutes Market: Regional Estimates & Trend Analysis, By, Material Type, & Application
7.1 Regional Market Snapshot
7.2 North America
7.2.1 North America Bone Grafts & Substitutes Market estimates and forecasts, 2018 - 2030 (USD Million)
7.2.2 U.S.
7.2.2.1 U.S. Bone Grafts & Substitutes Market estimates and forecasts, 2018 - 2030 (USD Million)
7.2.3 Canada
7.2.3.1 Canada Bone Grafts & Substitutes Market estimates and forecasts, 2018 - 2030 (USD Million)
7.3 Europe
7.3.1 Europe Bone Grafts & Substitutes Market estimates and forecasts, 2018 - 2030 (USD Million)
7.3.2 UK
7.3.2.1 UK Bone Grafts & Substitutes Market estimates and forecasts, 2018 - 2030 (USD Million)
7.3.3 Germany
7.3.3.1 Germany Bone Grafts & Substitutes Market estimates and forecasts, 2018 - 2030 (USD Million)
7.3.4 France
7.3.4.1 France Bone Grafts & Substitutes Market estimates and forecasts, 2018 - 2030 (USD Million)
7.3.5 Italy
7.3.5.1 Italy Bone Graft and Substitutes Market, 2018 - 2030 (USD Million)
7.3.6 Spain
7.3.6.1 Spain Bone Graft and Substitutes Market, 2018 - 2030 (USD Million)
7.3.7 Denmark
7.3.7.1 Denmark Bone Graft and Substitutes Market, 2018 - 2030 (USD Million)
7.3.7 Norway
7.3.7.1 Norway Bone Graft and Substitutes Market, 2018 - 2030 (USD Million)
7.3.9 Sweden
7.3.9.1 Sweden Bone Graft and Substitutes Market, 2018 - 2030 (USD Million)
7.4 Asia Pacific
7.4.1 Asia Pacific Bone Grafts & Substitutes Market estimates and forecasts, 2018 - 2030 (USD Million)
7.4.2 China
7.4.2.1 China Bone Graft and Substitutes Market, 2018 - 2030 (USD Million)
7.4.3 Japan
7.4.3.1 Japan Bone Graft and Substitutes Market, 2018 - 2030 (USD Million)
7.4.4 India
7.4.4.1 India Bone Graft and Substitutes Market, 2018 - 2030 (USD Million)
7.4.5 South Korea
7.4.5.1 South Korea Bone Graft and Substitutes Market, 2018 - 2030 (USD Million)
7.4.6 Australia
7.4.6.1 Australia Bone Graft and Substitutes Market, 2018 - 2030 (USD Million)
7.5 Latin America
7.5.1 Latin America Bone Grafts & Substitutes Market estimates and forecasts, 2018 - 2030 (USD Million)
7.5.2 Mexico
7.5.2.1 Mexico Bone Grafts & Substitutes Market estimates and forecasts, 2018 - 2030 (USD Million)
7.5.3 Brazil
7.5.3.1 Brazil Bone Grafts & Substitutes Market estimates and forecasts, 2018 - 2030 (USD Million)
7.5.2 Mexico
7.5.2.1 Mexico Bone Grafts & Substitutes Market estimates and forecasts, 2018 - 2030 (USD Million)
7.5.4 Argentina
7.5.4.1 Argentina Bone Grafts & Substitutes Market estimates and forecasts, 2018 - 2030 (USD Million)
7.6 MEA
7.6.1 MEA Bone Grafts & Substitutes Market estimates and forecasts, 2018 - 2030 (USD Million)
7.6.2 South Africa
7.6.2.1 South Africa Bone Grafts & Substitutes Market estimates and forecasts, 2018 - 2030 (USD Million)
7.6.3 Saudi Arabia
7.6.3.1 Saudi Arabia Bone Grafts & Substitutes Market estimates and forecasts, 2018 - 2030 (USD Million)
7.6.4 UAE
7.6.4.1 UAE Bone Grafts & Substitutes Market estimates and forecasts, 2018 - 2030 (USD Million)
7.6.5 Kuwait
7.6.5.1 Kuwait Bone Grafts & Substitutes Market estimates and forecasts, 2018 - 2030 (USD Million)
Chapter 8 Company Profiles
8.1. Recent Developments & Impact Analysis, By Key Market Participants
8.2. Company Categorization
8.3 AlloSource
8.3.1 Company overview
8.3.2 Financial Performance
8.3.3 Product benchmarking
8.3.4 Strategic Initiatives
8.4 Baxter
8.4.1 Company overview
8.4.2 Financial Performance
8.4.3 Product benchmarking
8.4.4 Strategic Initiatives
8.5 DePuy Synthes
8.5.1 Company overview
8.5.2 Financial Performance
8.5.3 Product benchmarking
8.5.4 Strategic Initiatives
8.6 Medtronic
8.6.1 Company overview
8.6.2 Financial Performance
8.6.3 Product benchmarking
8.6.6 Strategic Initiatives
8.7 NuVasive, Inc.
8.7.1 Company overview
8.7.2 Financial Performance
8.7.3 Product benchmarking
8.7.4 Strategic Initiatives
8.8 Orthofix Medical, Inc.
8.8.1 Company overview
8.8.2 Financial Performance
8.8.3 Product benchmarking
8.8.4 Strategic Initiatives
8.9 Smith + Nephew
8.9.1 Company overview
8.9.2 Financial Performance
8.9.3 Product benchmarking
8.9.4 Strategic Initiatives
8.10 Stryker
8.10.1 Company overview
8.10.2 Financial Performance
8.10.3 Product benchmarking
8.10.4 Strategic Initiatives
8.11 Biobank
11.11.1 Company overview
11.11.2 Financial Performance
11.11.3 Product benchmarking
11.11.4 Strategic Initiatives
8.12 OST Laboratories
8.12.1 Company overview
8.12.2 Financial Performance
8.12.3 Product benchmarking
8.12.4 Product benchmarking
8.13 Zimmer Biomet
8.13.1 Company overview
8.13.2 Financial performance
8.13.3 Product benchmarking
8.13.4 Strategic initiatives
8.14 Geistlich Pharma AG
8.14.1 Company overview
8.14.2 Financial performance
8.14.3 Product benchmarking
8.14.4 Strategic initiatives
List of Tables
Table 1 List of Secondary Sources
Table 2 List of Abbreviations
Table 3 Global bone graft & substitutes market, by region, 2018 - 2030 (USD Million)
Table 4 Global bone graft & substitutes market, by material type, 2018 - 2030 (USD Million)
Table 5 Global bone graft & substitutes market, by application, 2018 - 2030 (USD Million)
Table 6 North America bone graft & substitutes market, by region, 2018 - 2030 (USD Million)
Table 7 North America bone graft & substitutes market, by material type, 2018 - 2030 (USD Million)
Table 8 North America bone graft & substitutes market, by application, 2018 - 2030 (USD Million)
Table 9 U.S. bone graft & substitutes market, by material type, 2018 - 2030 (USD Million)
Table 10 U.S. bone graft & substitutes market, by application, 2018 - 2030 (USD Million)
Table 11 Canada bone graft & substitutes market, by material type, 2018 - 2030 (USD Million)
Table 12 Canada bone graft & substitutes market, by application, 2018 - 2030 (USD Million)
Table 13 Mexico bone graft & substitutes market, by material type, 2018 - 2030 (USD Million)
Table 14 Mexico bone graft & substitutes market, by application, 2018 - 2030 (USD Million)
Table 15 Europe bone graft & substitutes market, by region, 2018 - 2030 (USD Million)
Table 16 Europe bone graft & substitutes market, by material type, 2018 - 2030 (USD Million)
Table 17 Europe bone graft & substitutes market, by application, 2018 - 2030 (USD Million)
Table 18 Germany bone graft & substitutes market, by material type, 2018 - 2030 (USD Million)
Table 19 Germany bone graft & substitutes market, by application, 2018 - 2030 (USD Million)
Table 20 UK bone graft & substitutes market, by material type, (USD million) 2018-2030
Table 21 UK bone graft & substitutes market, by application, 2018 - 2030 (USD Million)
Table 22 France bone graft & substitutes market, by material type, 2018 - 2030 (USD Million)
Table 23 France bone graft & substitutes market, by application, 2018 - 2030 (USD Million)
Table 24 Italy bone graft & substitutes market, by material type, 2018 - 2030 (USD Million)
Table 25 Italy bone graft & substitutes market, by application, 2018 - 2030 (USD Million)
Table 26 Spain bone graft & substitutes market, by material type, 2018 - 2030 (USD Million)
Table 27 Spain bone graft & substitutes market, by application, 2018 - 2030 (USD Million)
Table 28 Denmark bone graft & substitutes market, by material type, 2018 - 2030 (USD Million)
Table 29 Denmark bone graft & substitutes market, by application, 2018 - 2030 (USD Million)
Table 30 Sweden bone graft & substitutes market, by material type, 2018 - 2030 (USD Million)
Table 31 Sweden bone graft & substitutes market, by application, 2018 - 2030 (USD Million)
Table 32 Norway bone graft & substitutes market, by material type, 2018 - 2030 (USD Million)
Table 33 Norway bone graft & substitutes market, by application, 2018 - 2030 (USD Million)
Table 34 Asia Pacific bone graft & substitutes market, by region, 2018 - 2030 (USD Million)
Table 35 Asia Pacific Demineralized bone matrix (DBM) market, by material type, 2018 - 2030 (USD Million)
Table 36 Asia Pacific bone graft & substitutes market, by application, 2018 - 2030 (USD Million)
Table 37 China bone graft & substitutes market, by material type, 2018 - 2030 (USD Million)
Table 38 China bone graft & substitutes market, by application, 2018 - 2030 (USD Million)
Table 39 Japan bone graft & substitutes market, by material type, 2018 - 2030 (USD Million)
Table 40 Japan bone graft & substitutes market, by application, 2018 - 2030 (USD Million)
Table 41 India bone graft & substitutes market, by material type, 2018 - 2030 (USD Million)
Table 42 India bone graft & substitutes market, by application, 2018 - 2030 (USD Million)
Table 43 South Korea bone graft & substitutes market, by material type, 2018 - 2030 (USD Million)
Table 44 South Korea bone graft & substitutes market, by application, 2018 - 2030 (USD Million)
Table 45 Australia bone graft & substitutes market, by material type, 2018 - 2030 (USD Million)
Table 46 Australia bone graft & substitutes market, by application, 2018 - 2030 (USD Million)
Table 47 Thailand bone graft & substitutes market, by material type, 2018 - 2030 (USD Million)
Table 48 Thailand Demineralized bone matrix (DBM) market, by application, 2018 - 2030 (USD Million)
Table 49 Latin America bone graft & substitutes market, by region, 2018 - 2030 (USD Million)
Table 50 Latin America bone graft & substitutes market, by material type, 2018 - 2030 (USD Million)
Table 51 Latin America bone graft & substitutes market, by distribution channels, 2018 - 2030 (USD Million)
Table 52 Brazil bone graft & substitutes market, by material type, 2018 - 2030 (USD Million)
Table 53 Brazil bone graft & substitutes market, by application, 2018 - 2030 (USD Million)
Table 54 Argentina bone graft & substitutes market, by material type, 2018 - 2030 (USD Million)
Table 55 Argentina bone graft & substitutes market, by application, 2018 - 2030 (USD Million)
Table 56 MEA bone graft & substitutes market, by region, 2018 - 2030 (USD Million)
Table 57 MEA bone graft & substitutes market, by material type, 2018 - 2030 (USD Million)
Table 58 MEA bone graft & substitutes market, by distribution channels, 2018 - 2030 (USD Million)
Table 59 South Africa bone graft & substitutes market, by material type, 2018 - 2030 (USD Million)
Table 60 South Africa bone graft & substitutes market, by application, 2018 - 2030 (USD Million)
Table 61 Saudi Arabia bone graft & substitutes market, by material type, 2018 - 2030 (USD Million)
Table 62 Saudi Arabia bone graft & substitutes market, by application, 2018 - 2030 (USD Million)
Table 63 UAE bone graft & substitutes market, by material type, 2018 - 2030 (USD Million)
Table 64 UAE bone graft & substitutes market, by application, 2018 - 2030 (USD Million)
Table 65 Kuwait bone graft & substitutes market, by material type, 2018 - 2030 (USD Million)
Table 66 Kuwait bone graft & substitutes market, by application, 2018 - 2030 (USD Million)
List of Figures
Fig. 1 Market research process
Fig. 2 Data triangulation techniques
Fig. 3 Primary research pattern
Fig. 4 Market research approaches
Fig. 5 Value-chain-based sizing & forecasting
Fig. 6 QFD modeling for market share assessment
Fig. 7 Market formulation & validation
Fig. 8 Bone grafts & substitutes market: outlook
Fig. 9 Bone grafts & substitutes competitive insights
Fig. 10 Ancillary market outlook
Fig. 11 Bone grafts & substitutes market driver impact
Fig. 12 Bone grafts & substitutes market restraint impact
Fig. 13 Porter’s Analysis
Fig. 14 PESTLE Analysis
Fig. 15 Bone grafts & substitutes market: Material movement analysis
Fig. 16 Bone grafts & substitutes market: Product outlook and key takeaways
Fig. 17 Allograft market estimates and forecast, 2018 - 2030
Fig. 18 Demineralized Bone Matrix market estimates and forecast, 2018 - 2030
Fig. 19 Others market estimates and forecast, 2018 - 2030
Fig. 20 Synthetic market estimates and forecast, 2018 - 2030
Fig. 21 Ceramics market estimates and forecast, 2018 - 2030
Fig. 22 HAP market estimates and forecast, 2018 - 2030
Fig. 23 ß-TCP market estimates and forecast, 2018 - 2030
Fig. 24 α-TCP market estimates and forecast, 2018 - 2030
Fig. 25 bi-phasic calcium phosphates (BCP) market estimates and forecast, 2018 - 2030
Fig. 26 Others market estimates and forecast, 2018 - 2030
Fig. 27 Composites market estimates and forecast, 2018 - 2030
Fig. 28 Polymers market estimates and forecast, 2018 - 2030
Fig. 29 Bone Morphogenic Proteins (BMP) market estimates and forecast, 2018 - 2030
Fig. 30 Bone grafts & substitutes market: Application movement analysis
Fig. 31 Bone grafts & substitutes market: Application outlook and key takeaways
Fig. 32 Craniomaxillofacial market estimates and forecasts, 2018 - 2030
Fig. 33 Dental market estimates and forecasts,2018 - 2030
Fig. 34 Foot and Ankle market estimates and forecasts,2018 - 2030
Fig. 35 Joint Reconstruction market estimates and forecasts,2018 - 2030
Fig. 36 Long Bone market estimates and forecasts,2018 - 2030
Fig. 37 Spinal Fusion market estimates and forecasts,2018 - 2030
Fig. 38 Global bone grafts & substitutes market: Regional movement analysis
Fig. 39 Global bone grafts & substitutes market: Regional outlook and key takeaways
Fig. 40 North America bone grafts & substitutes market estimates and forecasts, 2018 - 2030 (USD Million)
Fig. 41 Key country dynamics
Fig. 42 U.S. bone grafts & substitutes market estimates and forecasts, 2018 - 2030 (USD Million)
Fig. 43 Key country dynamics
Fig. 44 Canada bone grafts & substitutes market estimates and forecasts, 2018 - 2030 (USD Million)
Fig. 45 Key country dynamics
Fig. 46 Mexico bone grafts & substitutes market estimates and forecasts, 2018 - 2030 (USD Million)
Fig. 47 Europe bone grafts & substitutes market estimates and forecasts, 2018 - 2030 (USD Million)
Fig. 48 Key country dynamics
Fig. 49 UK bone grafts & substitutes market estimates and forecasts, 2018 - 2030 (USD Million)
Fig. 50 Key country dynamics
Fig. 51 Germany bone grafts & substitutes market estimates and forecasts, 2018 - 2030 (USD Million)
Fig. 52 Key country dynamics
Fig. 53 Spain bone grafts & substitutes market estimates and forecasts, 2018 - 2030 (USD Million)
Fig. 54 Key country dynamics
Fig. 55 France bone grafts & substitutes market estimates and forecasts, 2018 - 2030 (USD Million)
Fig. 56 Key country dynamics
Fig. 57 Italy bone grafts & substitutes market estimates and forecasts, 2018 - 2030 (USD Million)
Fig. 58 Key country dynamics
Fig. 59 Norway bone grafts & substitutes market estimates and forecasts, 2018 - 2030 (USD Million)
Fig. 60 Key country dynamics
Fig. 61 Denmark bone grafts & substitutes market estimates and forecasts, 2018 - 2030 (USD Million)
Fig. 62 Key country dynamics
Fig. 63 Sweden bone grafts & substitutes market estimates and forecasts, 2018 - 2030 (USD Million)
Fig. 64 Asia Pacific bone grafts & substitutes market estimates and forecasts, 2018 - 2030 (USD Million)
Fig. 65 Key country dynamics
Fig. 66 Japan bone grafts & substitutes market estimates and forecasts, 2018 - 2030 (USD Million)
Fig. 67 Key country dynamics
Fig. 68 China bone grafts & substitutes market estimates and forecasts, 2018 - 2030 (USD Million)
Fig. 69 Key country dynamics
Fig. 70 India bone grafts & substitutes market estimates and forecasts, 2018 - 2030 (USD Million)
Fig. 71 Key country dynamics
Fig. 72 Australia bone grafts & substitutes market estimates and forecasts, 2018 - 2030 (USD Million)
Fig. 73 Key country dynamics
Fig. 74 South Korea bone grafts & substitutes market estimates and forecasts, 2018 - 2030 (USD Million)
Fig. 75 Key country dynamics
Fig. 76 Thailand bone grafts & substitutes market estimates and forecasts, 2018 - 2030 (USD Million)
Fig. 77 Latin America bone grafts & substitutes market estimates and forecasts, 2018 - 2030 (USD Million)
Fig. 78 Key country dynamics
Fig. 79 Brazil bone grafts & substitutes market estimates and forecasts, 2018 - 2030 (USD Million)
Fig. 80 Key country dynamics
Fig. 81 Argentina bone grafts & substitutes market estimates and forecasts, 2018 - 2030 (USD Million)
Fig. 82 MEA bone grafts & substitutes market estimates and forecasts, 2018 - 2030 (USD Million)
Fig. 83 Key country dynamics
Fig. 84 South Africa bone grafts & substitutes market estimates and forecasts, 2018 - 2030 (USD Million)
Fig. 85 Key country dynamics
Fig. 86 Saudi Arabia bone grafts & substitutes market estimates and forecasts, 2018 - 2030 (USD Million)
Fig. 87 Key country dynamics
Fig. 88 UAE bone grafts & substitutes market estimates and forecasts, 2018 - 2030 (USD Million)
Fig. 89 Key country dynamics
Fig. 90 Kuwait bone grafts & substitutes market estimates and forecasts, 2018 - 2030 (USD Million)
Fig. 91 Key company categorization
Fig. 92 Heat map analysis, 2024
Market Segmentation
Report content
Qualitative Analysis
Quantitative Analysis
Research Methodology
Grand View Research employs a comprehensive and iterative research methodology focused on minimizing deviance in order to provide the most accurate estimates and forecast possible. The company utilizes a combination of bottom-up and top-down approaches for segmenting and estimating quantitative aspects of the market. In Addition, a recurring theme prevalent across all our research reports is data triangulation that looks market from three different perspectives. Critical elements of the methodology employed for all our studies include:
Preliminary data mining
Raw market data is obtained and collated on a broad front. Data is continuously filtered to ensure that only validated and authenticated sources are considered. In addition, data is also mined from a host of reports in our repository, as well as a number of reputed paid databases. For a comprehensive understanding of the market, it is essential to understand the complete value chain, and in order to facilitate this; we collect data from raw material suppliers, distributors as well as buyers.
Technical issues and trends are obtained from surveys, technical symposia, and trade journals. Technical data is also gathered from an intellectual property perspective, focusing on white space and freedom of movement. Industry dynamics with respect to drivers, restraints, pricing trends are also gathered. As a result, the material developed contains a wide range of original data that is then further cross-validated and authenticated with published sources.
Statistical model
Our market estimates and forecasts are derived through simulation models. A unique model is created customized for each study. Gathered information for market dynamics, technology landscape, application development, and pricing trends are fed into the model and analyzed simultaneously. These factors are studied on a comparative basis, and their impact over the forecast period is quantified with the help of correlation, regression, and time series analysis. Market forecasting is performed via a combination of economic tools, technological analysis, industry experience, and domain expertise.
Econometric models are generally used for short-term forecasting, while technological market models are used for long-term forecasting. These are based on an amalgamation of the technology landscape, regulatory frameworks, economic outlook, and business principles. A bottom-up approach to market estimation is preferred, with key regional markets analyzed as separate entities and integration of data to obtain global estimates. This is critical for a deep understanding of the industry as well as ensuring minimal errors. Some of the parameters considered for forecasting include:
• Market drivers and restraints, along with their current and expected impact
• Raw material scenario and supply v/s price trends
• Regulatory scenario and expected developments
• Current capacity and expected capacity additions up to 2030
We assign weights to these parameters and quantify their market impact using weighted average analysis, to derive an expected market growth rate.
Primary validation
This is the final step in estimating and forecasting for our reports. Exhaustive primary interviews are conducted, face to face as well as over the phone to validate our findings and assumptions used to obtain them. Interviewees are approached from leading companies across the value chain including suppliers, technology providers, domain experts, and buyers so as to ensure a holistic and unbiased picture of the market. These interviews are conducted across the globe, with language barriers overcome with the aid of local staff and interpreters. Primary interviews not only help in data validation but also provide critical insights into the market, current business scenario, and future expectations and enhance the quality of our reports. All our estimates and forecast are verified through exhaustive primary research with Key Industry Participants (KIPs) which typically include:
• Market-leading companies
• Raw material suppliers
• Product distributors
• Buyers
The key objectives of primary research are as follows:
• To validate our data in terms of accuracy and acceptability
• To gain an insight in to the current market and future expectations
Data Collection Matrix
Perspective |
Primary research |
Secondary research |
Supply-side |
|
|
Demand-side |
|
|
Industry Analysis Matrix
Qualitative analysis |
Quantitative analysis |
|
|
NEED A CUSTOM REPORT?
We can customize every report - free of charge - including purchasing stand-alone sections or country-level reports, as well as offer affordable discounts for start-ups & universities. Contact us now
We are GDPR and CCPA compliant! Your transaction & personal information is safe and secure. For more details, please read our privacy policy.
"The quality of research they have done for us has been excellent."