- Home
- »
- Next Generation Technologies
- »
-
Interactive Kiosk Market Size & Share, Industry Report, 2030GVR Report cover
![Interactive Kiosk Market Size, Share & Trends Report]()
Interactive Kiosk Market (2025 - 2030) Size, Share & Trends Analysis Report By Component (Hardware, Software, Services), By Type (Automated Teller Machines, Retail Self-checkout Kiosk, Self-service Kiosk, Vending Kiosk), By End-use, By Region, And Segment Forecasts
- Report ID: GVR-3-68038-017-0
- Number of Report Pages: 100
- Format: PDF
- Historical Range: 2018 - 2024
- Forecast Period: 2025 - 2030
- Industry: Technology
- Report Summary
- Table of Contents
- Interactive Charts
- Methodology
- Download FREE Sample
-
Download Sample Report
Interactive Kiosk Market Summary
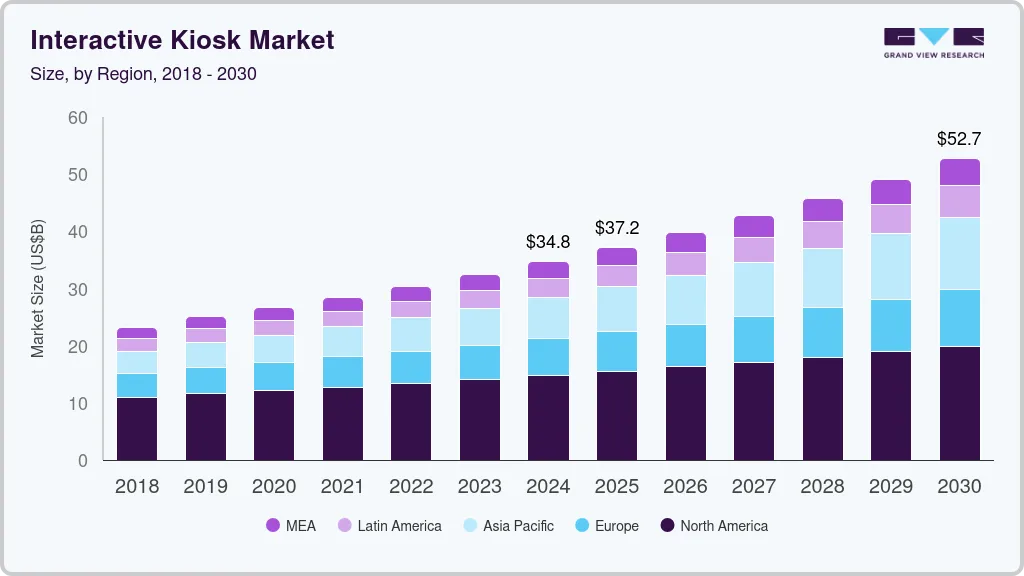
The global interactive kiosk market size was estimated at USD 34.79 billion in 2024 and is projected to reach USD 52.74 billion by 2030, growing at a CAGR of 7.2% from 2025 to 2030. Driven by factors such as technological advancements, shifting consumer preferences, and increased demand for self-service solutions across various industries.
Key Market Trends & Insights
- North America interactive kiosk market held a significant share of over 42.0% in 2024.
- The interactive kiosk market in the U.S. is expected to grow significantly at a CAGR of 4.9% from 2025 to 2030.
- By type, the automated teller machines (ATMs) segment dominated the industry and accounted for a revenue share of nearly 50.0% in 2024.
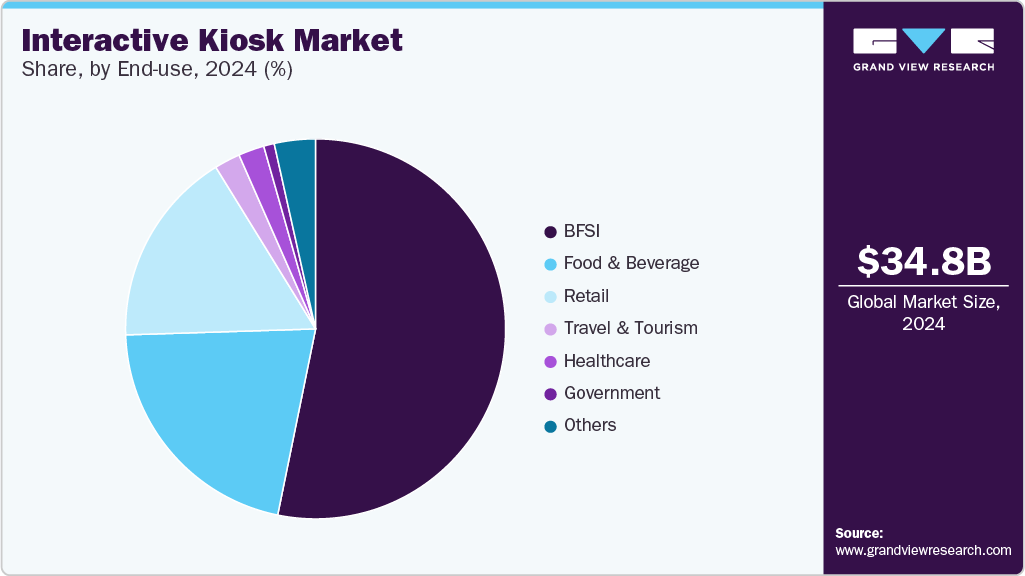
- By end use, the BFSI segment dominated the industry and accounted for a revenue share of over 53.0% in 2024.
- By component, the hardware segment dominated the industry and accounted for a revenue share of over 44.0% in 2024
Market Size & Forecast
- 2024 Market Size: USD 34.79 Billion
- 2030 Projected Market Size: USD 52.74 Billion
- CAGR (2025-2030): 7.2%
- North America: Largest market in 2024
Businesses in retail, hospitality, transportation, healthcare, and banking are adopting interactive kiosks to streamline services, reduce wait times, and offer 24/7 access to information and transactions. These self-service terminals allow companies to reduce labor costs while enhancing user experience, making them a strategic investment in competitive markets.
Technological innovation is another key factor fueling market expansion. The integration of artificial intelligence (AI), facial recognition, touchscreen technology, and advanced data analytics into interactive kiosks has significantly improved their functionality and user interface. These enhancements allow for more personalized services, improved accessibility, and real-time data collection, which can be leveraged for targeted marketing and operational efficiency. Furthermore, the adoption of cloud-based management systems enables remote monitoring and updates, reducing maintenance efforts and downtime.
The rise of digital transformation initiatives, particularly in emerging economies, is also accelerating the deployment of interactive kiosks. Governments and enterprises are investing in digital infrastructure to offer smarter services to citizens and customers. For example, smart city projects often include interactive kiosks for wayfinding, public information, and service access. Moreover, the growing emphasis on operational cost reduction and data-driven decision-making is motivating companies to adopt interactive kiosks. These systems not only automate routine tasks but also collect valuable customer data that can be used to optimize product offerings, manage inventory, and improve overall business strategy. As more organizations recognize the strategic value of kiosks in enhancing customer interaction while managing costs, the market is expected to continue its upward trajectory.
In addition, the rapid digitalization of banking and financial services institutions supports the growth of the interactive kiosk industry. Self-service banking kiosks equipped with biometric authentication (fingerprint, iris scanning) and AI-driven chatbots are reducing branch operational costs while improving accessibility. Governments are also leveraging smart civic kiosks for e-governance services, such as bill payments, ID renewals, and public transit ticketing, enhancing efficiency in urban centers. The healthcare sector is adopting medical check-in kiosks with symptom assessment tools and appointment scheduling, streamlining patient flow in hospitals and clinics.
Component Insights
The hardware segment dominated the industry and accounted for a revenue share of over 44.0% in 2024 due torising demand for self-service solutions, and evolving customer expectations. The proliferation of touch-enabled and contactless technologies, such as capacitive touchscreens and NFC/RFID modules, which are becoming increasingly important in a post-pandemic world where hygiene and user convenience are priorities.These advancements are not only enhancing the user experience but are also enabling more secure and efficient transactions across industries such as retail, healthcare, and banking.
The services segment is anticipated to grow at a CAGR of 8.3% during the forecast period due to the increasing complexity of kiosk deployments and the rising demand for end-to-end support across the product lifecycle. As organizations adopt kiosks across diverse applications, from ticketing and check-ins to product discovery and financial services, there is a growing need for professional services such as consulting, system integration, and deployment support. These services ensure that kiosks are customized to meet specific business needs, integrated seamlessly with existing IT infrastructure, and comply with regional regulations, especially in sectors like healthcare and banking, where data privacy and accessibility are paramount.
Type Insights
The automated teller machines (ATMs) segment dominated the industry and accounted for a revenue share of nearly 50.0% in 2024 due to the increasing demand for self-service banking in both developed and emerging economies. As banks strive to reduce operating costs and expand service reach, especially in rural or underserved areas, ATMs offer a cost-effective solution to deliver basic banking services such as cash withdrawal, deposits, fund transfers, and balance inquiries without the need for physical bank branches.
The self-service kiosk segment is expected to grow at a significant CAGR over the forecast period, owing to the integration of advanced technologies such as AI, computer vision, and IoT into self-service kiosks. These technologies enable more intelligent and personalized interactions, such as product recommendations, dynamic pricing, real-time inventory updates, and multilingual support. For example, in QSRs, kiosks can now remember past orders and suggest meals based on customer preferences, while in retail environments, interactive kiosks can offer virtual try-on solutions or detailed product comparisons. These capabilities not only improve customer engagement but also drive upselling and cross-selling opportunities.
End-use Insights
The BFSI segment dominated the industry and accounted for a revenue share of over 53.0% in 2024, driven by the sector’s ongoing digital transformation and the need to enhance customer engagement while optimizing operational efficiency. One of the foremost growth drivers is the rising demand for self-service banking solutions, particularly in urban areas where consumers expect fast, 24/7 access to financial services. Interactive kiosks, including advanced ATMs, are helping banks and financial institutions extend services such as cash deposits and withdrawals, bill payments, account openings, and loan applications without requiring in-branch visits.

The healthcare segment is expected to grow at a significant CAGR over the forecast period owing to the rising adoption of Electronic Health Records (EHRs) and patient portals is fueling demand for kiosks that can integrate seamlessly with hospital information systems. Interactive kiosks enable patients to access their medical history, update personal information, and receive real-time updates on appointments or test results. This level of self-service empowers patients to take more control over their healthcare journeys while allowing providers to maintain accurate and up-to-date records.
Regional Insights
North America interactive kiosk market held a significant share of over 42.0% in 2024. The North American market is poised for continued growth, with advancements in AI, IoT, and contactless technologies shaping the future of self-service solutions. Businesses are increasingly recognizing the strategic value of kiosks in enhancing customer interaction, reducing costs, and improving operational efficiency. As new applications emerge and kiosk solutions continue to evolve, the market is expected to remain a dynamic and integral component of the region's digital transformation efforts.

U.S. Interactive Kiosk Market Trends
The interactive kiosk market in the U.S. is expected to grow significantly at a CAGR of 4.9% from 2025 to 2030. The retail and quick-service restaurant (QSR) sectors are at the forefront of kiosk adoption. Chains like Shake Shack and KFC have implemented kiosks to streamline operations and enhance customer experience. For instance, Shake Shack has installed kiosks in nearly all its U.S. locations, accounting for over half of in-restaurant orders, leading to increased average spending per customer.
Europe Interactive Kiosk Market Trends
The interactive kiosk market in Europe is anticipated to register considerable growth from 2025 to 2030. In the transportation and tourism sectors, interactive kiosks are being deployed at airports, train stations, and tourist attractions to offer services such as check-ins, ticketing, wayfinding, and information dissemination. These kiosks help streamline passenger flow, reduce queues, and enhance the overall customer experience, particularly in high-traffic locations. For instance, major airports in Europe, including Heathrow and Schiphol, have integrated self-service kiosks for check-in and baggage drop, significantly reducing wait times and improving customer satisfaction.
The UK interactive kiosk market is expected to grow rapidly in the coming years. The healthcare sector in the UK is increasingly adopting interactive kiosks to improve patient engagement, streamline administrative processes, and enhance the overall patient experience. Kiosks facilitate functions such as patient check-ins, appointment scheduling, and information dissemination, contributing to the efficiency and effectiveness of healthcare services.
The interactive kiosk market in Germany held a substantial share in 2024. Government policies in Germany are promoting the deployment of interactive kiosks to improve public service delivery and enhance customer engagement. These policies include guidelines for accessibility and usability standards, funding support for smart city projects integrating interactive kiosks, and regulatory frameworks ensuring data privacy and security in kiosk operations. Such initiatives are stimulating growth in the interactive kiosk market by fostering an environment conducive to innovation and adoption.
Asia Pacific Interactive Kiosk Market Trends
The interactive kiosk market in Asia Pacific is expected to register the fastest CAGR of 10.0% from 2025 to 2030. Rapid urbanization and infrastructure development across APAC countries are significant drivers of the interactive kiosk market. The proliferation of retail outlets, transportation hubs, and entertainment venues creates a robust demand for interactive kiosks to streamline operations, improve efficiency, and enhance customer experiences. This growth is particularly evident in countries like China and India, where urbanization is accelerating.
Japan interactive kiosk market is expected to grow rapidly in the coming years. The food and beverage sector in Japan is rapidly adopting automation, with interactive kiosks becoming a central element of this shift. Fast food chains, cafes, and restaurants are increasingly using kiosks for order placements, reducing wait times, and allowing customers to customize their orders easily. This trend has become even more significant as businesses look to reduce labor costs and improve operational efficiency in the face of a shrinking workforce and increased labor costs.
The interactive kiosk market in China held a substantial share in 2024. The Chinese government's emphasis on digital transformation and smart city initiatives has significantly contributed to the adoption of interactive kiosks. Policies promoting the integration of advanced technologies in public services, retail, healthcare, and transportation sectors have accelerated the deployment of kiosks as essential components of modern infrastructure.
Key Interactive Kiosk Companies Insights
Key players operating in the interactive kiosk market are undertaking various initiatives to strengthen their presence and increase the reach of their products and services. Strategies such as expansion activities and partnerships are key in propelling the market growth.
Key Interactive Kiosk Companies:
The following are the leading companies in the interactive kiosk market. These companies collectively hold the largest market share and dictate industry trends.
- Advantech Co., Ltd.
- Diebold Nixdorf, Incorporated
- DynaTouch Corporation
- Embross
- Frank Mayer and Associates, Inc.
- Glory Global Solutions Ltd.
- GRGBanking
- IER
- Kiosk Innovations
- Meridian Kiosks
- NCR VOYIX
- Olea Kiosks, Inc.
- REDYREF
- SAMSUNG
- Slabb Kiosks
Recent Developments
-
In January 2025, Diebold Nixdorf, Incorporated announced an expansion of its partnership with Geldmaat, a Dutch consumer financial services provider. As part of the agreement, Diebold Nixdorf, Incorporated is expected to deliver ATM Managed Services for ATMs for long-term and cash systems across the Dutch market. The comprehensive solution includes helpdesk support, monitoring services, and extensive maintenance and repair services.
-
In May 2024, NCR Voyix unveiled the Aloha Kiosk, a solution powered by GRUBBRR. This new offering comes as a result of the partnership between NCR Voyix and GRUBBRR, delivering a fully integrated and platform-enabled kiosk solution. The seamless connection with NCR Voyix Payments enhances operational flexibility, improves order accuracy, and contributes to increased revenue for restaurants.
-
In March 2024, Advantech Co., Ltd. announced its acquisition of Aures Technologies SA, a French provider of point-of-sale (POS) and kiosk solutions. This strategic acquisition will increase the company's global presence in the smart retail sector and position it to further advance its standing among the top smart retail solution providers worldwide.
Interactive Kiosk Market Report Scope
Report Attribute
Details
Market size in 2025
USD 37.24 billion
Revenue forecast in 2030
USD 52.74 billion
Growth rate
CAGR of 7.2% from 2025 to 2030
Actual data
2018 - 2024
Forecast period
2025 - 2030
Quantitative units
Revenue in USD million/billion, and CAGR from 2025 to 2030
Report coverage
Revenue forecast, company share, competitive landscape, growth factors, and trends
Segments covered
Component, type, end use, and region
Regional scope
North America; Europe; Asia Pacific; Latin America; MEA
Country scope
U.S.; Canada; Mexico; UK; Germany; France; China; India; Japan; Australia; South Korea; Brazil; UAE; Kingdom of Saudi Arabia; and South Africa
Key companies profiled
Advantech Co., Ltd.; Diebold Nixdorf; Incorporated; DynaTouch Corporation; Embross; Frank Mayer and Associates, Inc.; Glory Global Solutions Ltd.; GRGBanking; IER; Kiosk Innovations; Meridian Kiosks; NCR VOYIX; Olea Kiosks, Inc.; REDYREF; SAMSUNG; Slabb Kiosks
Customization scope
Free report customization (equivalent to 8 analysts working days) with purchase. Addition or alteration to country, regional & segment scope.
Pricing and purchase options
Avail customized purchase options to meet your exact research needs. Explore purchase options
Global Interactive Kiosk Market Report Segmentation
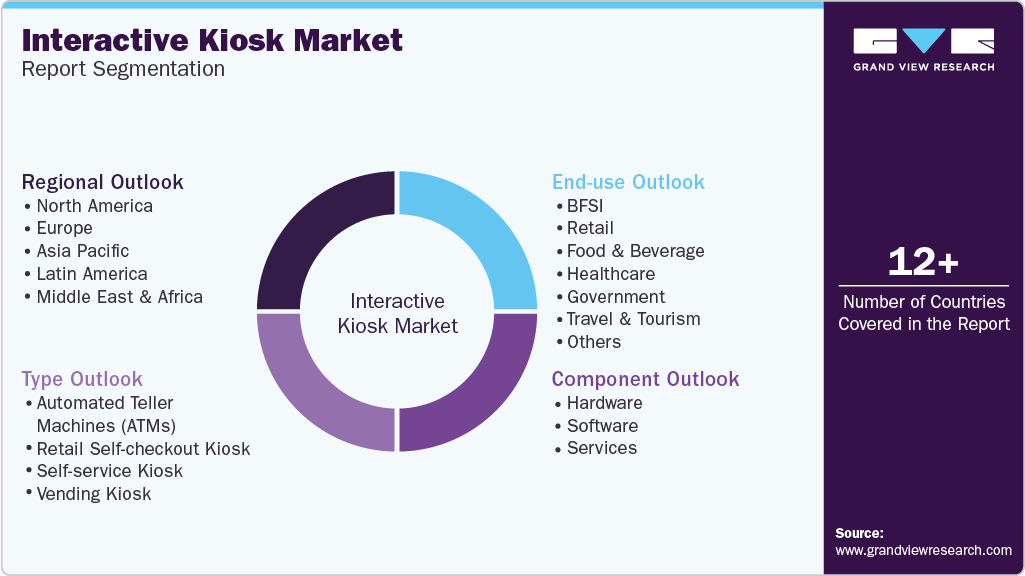
This report forecasts revenue growth at the global, regional, and country levels and provides an analysis of the latest industry trends in each of the sub-segments from 2018 to 2030. For this study, Grand View Research has segmented the global interactive kiosk market report based on component, type, end-use, and region.

-
Component Outlook (Revenue, USD Billion, 2018 - 2030)
-
Hardware
-
Display
-
Printer
-
Others
-
-
Software
-
Windows
-
Android
-
Linux
-
Others
-
-
Services
-
Integration & Deployment
-
Managed Services
-
-
-
Type Outlook (Revenue, USD Billion, 2018 - 2030)
-
Automated Teller Machines (ATMs)
-
Retail Self-checkout Kiosk
-
Self-service Kiosk
-
Vending Kiosk
-
-
End-use Outlook (Revenue, USD Billion, 2018 - 2030)
-
BFSI
-
Retail
-
Food & Beverage
-
Healthcare
-
Government
-
Travel & Tourism
-
Others
-
-
Regional Outlook (Revenue, USD Billion, 2018 - 2030)
-
North America
-
U.S.
-
Canada
-
Mexico
-
-
Europe
-
UK
-
Germany
-
France
-
-
Asia Pacific
-
China
-
India
-
Japan
-
South Korea
-
Australia
-
-
Latin America
-
Brazil
-
-
Middle East & Africa
-
UAE
-
Saudi Arabia
-
South Africa
-
-
Frequently Asked Questions About This Report
b. Some key players operating in the interactive kiosk market include Advantech Co., Ltd., Diebold Nixdorf, Incorporated, DynaTouch Corporation, Embross, Frank Mayer and Associates, Inc., Glory Global Solutions Ltd., GRGBanking, IER, Kiosk Innovations, Meridian Kiosks, NCR VOYIX, Olea Kiosks, Inc., REDYREF, SAMSUNG, Slabb Kiosks
b. Key factors that are driving the interactive kiosk market growth include technological advancements, shifting consumer preferences, and increased demand for self-service solutions across various industries. Businesses in retail, hospitality, transportation, healthcare, and banking are adopting interactive kiosks to streamline services, reduce wait times, and offer 24/7 access to information and transactions.
b. The global interactive kiosk market size was estimated at USD 34.79 billion in 2024 and is expected to reach USD 37.24 billion in 2025.
b. The global interactive kiosk market is expected to grow at a compound annual growth rate of 7.2% from 2025 to 2030 to reach USD 52.74 billion by 2030.
b. North America dominated the interactive kiosk market with a share of over 42.0% in 2024. This is attributable to advancements in AI, IoT, and contactless technologies shaping the future of self-service solutions. Businesses are increasingly recognizing the strategic value of kiosks in enhancing customer interaction, reducing costs, and improving operational efficiency.
Share this report with your colleague or friend.
Need a Tailored Report?
Customize this report to your needs — add regions, segments, or data points, with 20% free customization.

ISO 9001:2015 & 27001:2022 Certified
We are GDPR and CCPA compliant! Your transaction & personal information is safe and secure. For more details, please read our privacy policy.
Trusted market insights - try a free sample
See how our reports are structured and why industry leaders rely on Grand View Research. Get a free sample or ask us to tailor this report to your needs.


