GVR Report cover Plastic Compounding Market Size, Share & Trends Report

Plastic Compounding Market Size, Share & Trends Analysis Report By Source (Fossil-based, Bio-based, Recycled), By Product, By Application (Automotive, Aerospace & defense), By Region, And Segment Forecasts, 2024 - 2030

  • Report ID: 978-1-68038-446-8
  • Number of Pages: 195
  • Format: Electronic (PDF)

Plastic Compounding Market Size & Trends

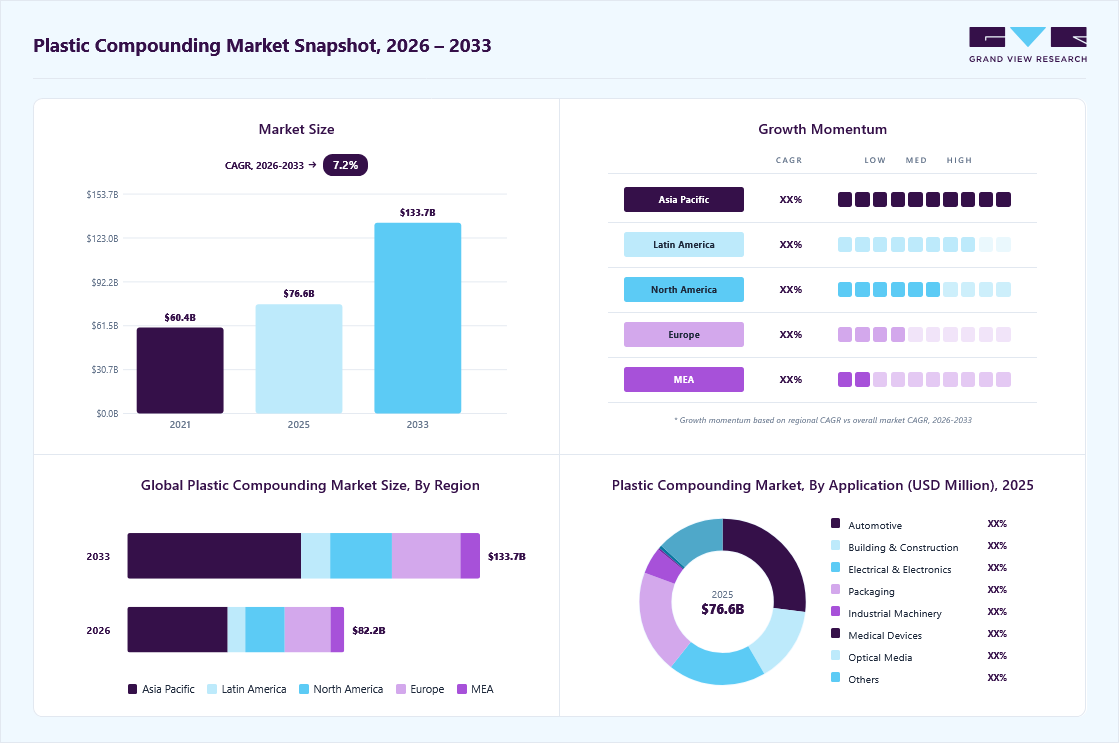
The global plastic compounding market size was estimated at USD 67.17 billion in 2023 and is expected to grow at a compound annual growth rate (CAGR) of 7.4% from 2024 to 2030. Increasing substitution for natural rubber, wood, metals, glass, and concrete by plastic is expected to drive the growth of the plastic compounding industry over the forecast period. The demand for plastic is rising due to its use in various industrial applications because of its ability to form desired shapes and easy molding. Plastic fittings are considered very easy to install compared to metal or wood fittings. These fittings are available in a wide range of color combinations, which adds to their aesthetic appeal.

U.S. Plastic Compounding Market size and growth rate, 2023 - 2030

Moreover, plastic fittings can be sealed very tightly, thus creating a barrier to external unwanted factors like dust or water. The properties of plastic compounds can drive its market growth in the coming years. Plastic compounding process involves various stages, such as determining additives ratio, high-speed mixing via twin screw extruders and other plastic compounding machines, melt mixing, and cooling before final pellet cutting and packaging.

The U.S. dominated the North American market for plastic compounding in 2023 and is expected to continue its dominance over the forecast period. The demand for plastic compounding in the country is majorly generated from the expanding automotive industry coupled with the rise in a number of construction activities. Capacity addition and plant expansion by automotive companies in the U.S. are further expected to augment the demand for plastics compounding.

Polyethylene Terephthalate (PET) is expected to be one of the fastest-growing segments in the U.S. plastics market due to its high demand from the packaging sector. PET is mostly used in the production of bottles and contributes to a significant market share in plastics industry. Most PET processors in the U.S. are increasingly focusing on implementing Good Manufacturing Practices (GMPs) in an attempt to optimally utilize available resources, conserve resources, and increase production efficiency. These initiatives are further expected to boost the market growth of PET over the forecast period.

Rising demand for plastic compounded resins in comparison to the traditional plastic resins across various industries including automotive and others has provided an opportunity for the plastic compounding market to propel globally. Compared to traditional materials such as rubber or metals, the usage of plastic compounded goods in automotive applications helps minimize fuel consumption by reducing the density and weight of cars. Over the projected period, rising consumer awareness of consumer safety and health concerns in different industries such as electronics, healthcare, wire & cable, construction, and automotive is expected to increase global demand for plastic compounding for manufacturing of plastic compounded resins.

Market Concentration & Characteristics

The global plastic compounding market is highly consolidated in nature with the presence of various key players such as BASF SE, SABIC, Dow Inc., DuPont de Nemours, Inc., LyondellBasell Industries Holdings B.V., RTP Company, and Kingfa SCI. & TECH. CO., LTD. as well as a few medium and small regional players operating in different parts of the world. The global players face intense competition from each other as well as from the regional players who have strong distribution networks and good knowledge about suppliers & regulations.

The companies in the market compete on the basis of product quality offered and the technology used for the production of plastics. Major players, in particular, compete on the basis of application development capability and new technologies used in product formulation. Established players such as BASF SE are investing in research & development activities to formulate new and advanced plastics compounds, which gives them a competitive edge over the other players.

Plastic Compounding Market Concentration & Characteristics

To maintain strong and healthy competitive environment across the marketspace, the global plastic compounding companies manufacturing compounded plastics have implemented various strategic initiatives such as acquisition & merger, new product launch, production expansion, and various others. For instance, in October 2023, Covestro AG launched their new mechanical recycling polycarbonate compounding production unit in Shanghai, China with a plastic compounding capacity of 25 kilotons per annum.

Source Insights

Fossil-based compounded plastics dominated the source segmentation in 2023 with a market revenue share of above 56.0%. This growth rate is attributed to the major utilization of petrochemical-based plastics from major end-use industries such as automotive, building & construction, medical, packaging, and others, for which fossils act as raw materials. Furthermore, the derivation of petrochemical from fossil fuels and further manufacturing of plastics is highly convenient and economic for the manufacturers in comparison to the manufacturing of their counter parts such as bio-based plastics.

Followed by recycled plastics with a market revenue share of more than 30.0% in 2023, owing to the rise in demand for recycled plastics from end-use industries in line with the increasing concerns regarding environmental damage caused due to increased consumption of virgin plastics, along with companies moving towards sustainability and circular economy. This has propelled the plastic recyclers to increase their recycling capacities across the globe in recent years.

Additionally, bio-based plastics have gained popularity in recent years owing to the rising governmental concerns to reduce landfilling, including programs such as U.S. 2030 Food Loss and Waste Reduction Goal, and expanding composting infrastructure are anticipated to augment the demand for compostable bags or bio-based bags used for the collection of food leftovers and other organic waste material over the forecast period.

Product Insights

Polypropylene (PP) dominated the product segmentation in 2023 with a market revenue share of above 29.0%. Polypropylene can be processed using any of the thermoplastic processing methods including injection molding, extrusion blow molding, and general-purpose extrusion. It has good fatigue and chemical & temperature resistance. Although, polypropylene is vulnerable to oxidative degradation in contact with copper and certain other materials. This has made it a popular material in developed and emerging economies for several application industries.

Automotive is the largest application segment for polypropylene (PP) compounds due to their high impact resistance and ease of maintenance. The rise of auto manufacturing in the Asian and Latin American markets has fueled the growth of the automotive sector, both in terms of vehicle sales and domestic production. Consumption of plastic compounds in automotive applications is expected to increase significantly over the forecast period due to continued growth in the automotive output market as well as regulatory trends forcing manufacturers to must reduce vehicle weight and improve energy efficiency.

Followed by polyethylene (PE) with a market revenue share of above 21.0% in 2023. Polyethylene compounds are widely used in various industries such as automotive, construction, electrical & electronics, and packaging. PE is an integral material for the packaging industry. Construction is the leading application market for polyethylene compounds with a significant market share in the global market.

Application Insights

Automotive sub-segment dominated the application segmentation in 2023 with a market revenue share above 25.0%. Exterior body parts, wiper arm casings and housings, bumpers, moldings, ignition, front grilles, cladding, roof trim, and other automobile applications all use PP and PET compounds. Low thermal expansion, high stiffness, lightweight, dimensional stability, moisture resistance, exceptional scratch resistance, and impact resistance in low temperatures are just a few of the properties that these materials possess.

Several grades of PP and PET compounds have been developed over the past years to meet diverse performance requirements. The growing demand for sustainable materials in this segment has been a major driver for lightweight plastic. In addition, the implementation of emission norms and vehicular weight regulations in the automotive industry owing to rising greenhouse gas emissions is anticipated to propel the demand for global automotive plastic compounding over the forecast period.

Global Plastic Compounding Market share and size, 2022

Followed by packaging with a market revenue share above 18.0% in 2023. Demand for compounded plastics in the packaging industry is driven by mass consumption in major economies such as China, India, Germany, the United States, and Brazil. Various regulatory agencies have established guidelines for packaging materials for food contact applications. The polypropylene formulation provides a cost-effective packaging solution that helps improve impact strength, flexibility, transparency, and process efficiency. The high demand for polyethylene in the packaging industry has contributed significantly to the growth of the plastic compounding market.

Regional Insights

Asia Pacific dominated the market and held a revenue share of over 44.0% in 2023 owing to the favorable conditions in Asia Pacific, such as increasing manufacturing output, booming e-commerce market, and favorable demographics, are promising. Investments in six Asian economies (China, Thailand, Indonesia, India, Vietnam, and Malaysia) for developing talent, improving infrastructure, and supply chain facilities are expected to drive the market growth.

Increasing demand for consumer goods such as refrigerators and washing machine in countries such as India, Vietnam, the Philippines, China, and Thailand is expected to fuel the demand for plastic compounding in these applications. Growing demand for automotive in the region coupled with favorable FDI norms by governments is further projected to facilitate investment in the Asia Pacific. In addition, low manufacturing cost in China and India as compared to Europe is expected to propel the use of plastic compounding in automobiles.

Plastic Compounding Market Trends by Region, 2023 - 2030

Followed by Europe with a market revenue share of above 21.0% in 2023. Growth in automotive production, high standard of living, and growing aging population, are significantly contributing towards a positive growth for plastic compounding in Europe. Well-developed infrastructure along with the presence of renowned automakers including Fiat, BMW, and Volkswagen among others are propelling the development of automotive market in this region which in turn is creating application scope of plastic compounding in this region.

Key Companies & Market Share Insights

Key companies are adopting several organic and inorganic growth strategies, such as capacity expansion, mergers & acquisitions, and joint ventures, to maintain and expand their market share.

  • In December 2023, Sirmax, an Italian plastic processor, announced their expansion of plastic compounding in India with a production capacity of 20 kilotons per annum. The plant is scheduled to be completely operational by the end of 2026.

  • In November 2023, Borealis AG announced its expansion of mechanically recycled plastic compounding production, increasing its compounding capacity to over 50 kilotons per annum. This expansion was possible with the acquisition of Rialti S.p.A., an Italian polypropylene (PP) compounder of recyclates.

Key Plastic Compounding Companies:

  • BASF SE
  • SABIC
  • Dow, Inc.
  • KRATON CORPORATION
  • LyondellBasell Industries Holdings B.V.
  • DuPont de Nemours, Inc.
  • RTP Company
  • S&E Specialty Polymers, LLC (Aurora Plastics)
  • Asahi Kasei Corporation
  • Covestro AG
  • Washington Penn
  • Eurostar Engineering Plastics
  • KURARAY CO., LTD.
  • Arkema
  • TEIJIN LIMITED
  • LANXESS
  • Solvay
  • SO.F.TER
  • Polyvisions, Inc.
  • Ravago

Plastic Compounding Market Report Scope

Report Attribute

Details

Market size value in 2024

USD 71.59 billion

Revenue forecast in 2030

USD 112.08 billion

Growth rate

CAGR of 7.4% from 2024 to 2030

Historical data

2018 - 2023

Forecast period

2024 - 2030

Quantitative Units

Volume in kilotons, revenue in USD million and CAGR from 2024 to 2030

Report coverage

Volume forecast, revenue forecast, competitive landscape, growth factors, and trends

Segments covered

Source, product, application, region

Regional scope

North America; Europe; Asia Pacific; Central & South America; Middle East & Africa

Country scope

U.S.; Canada; Mexico; Germany; UK; France; Italy; Spain; Netherlands; China; India; Japan; South Korea; Singapore; Malaysia; Indonesia; Thailand; Vietnam; Australia; Brazil; Argentina; Saudi Arabia; United Arab Emirates (UAE); South Africa

Key companies profiled

BASF SE; SABIC; Dow, Inc.; KRATON CORPORATION; LyondellBasell Industries Holdings B.V.; DuPont de Nemours, Inc.; RTP Company; S&E Specialty Polymers, LLC (Aurora Plastics); Asahi Kasei Corporation; Covestro AG; Washington Penn; Eurostar Engineering Plastics; KURARAY CO., LTD.; Arkema; TEIJIN LIMITED; LANXESS; Solvay; SO.F.TER; Polyvisions, Inc.; Ravago; Heritage Plastics; Chevron Phillips Chemical Company LLC; Sumitomo Bakelite Co., Ltd.; Nova Polymers, Inc.; Adell Plastics, Inc.; Foster Corporation; MRC Polymers, Inc.; Flex Technologies; Dyneon GmbH & Co. KG; Kingfa SCI. & TECH. CO. LTD.; China XD Plastics, Co., Ltd.; Avient Corporation; Guangdong Silver Age Sci; China General Plastics Corporation (CGPC)

Customization scope

Free report customization (equivalent up to 8 analysts working days) with purchase. Addition or alteration to country, regional & segment scope.

Pricing and purchase options

Avail customized purchase options to meet your exact research needs. Explore purchase options


Global Plastic Compounding Market Report  Segmentation

This report forecasts revenue and volume growth at the global, regional, and country levels and provides an analysis of the latest industry trends and opportunities in each of the sub-segments from 2018 to 2030. For this study, Grand View Research has segmented the global plastic compounding market report based on source, product, application, and region:

Global Plastic Compounding Market Report Segmentation


  • Source Outlook (Volume, Kilotons; Revenue, USD Million, 2018 - 2030)

    • Fossil-based

    • Bio-based

    • Recycled

  • Product Outlook (Volume, Kilotons; Revenue, USD Million, 2018 - 2030)

    • Polyethylene (PE)

    • Polypropylene (PP)

    • Thermoplastic Vulcanizates (TPV)

    • Thermoplastic Polyolefins (TPO)

    • Polyvinyl Chloride (PVC)

    • Polystyrene (PS)

    • Polyethylene Terephthalate (PET)

    • Polybutylene Terephthalate (PBT)

    • Polyamide (PA)

    • Polycarbonate (PC)

    • Polyurethane (PU)

    • Polymethyl Methacrylate (PMMA)

    • Acrylonitrile Butadiene Styrene (ABS)

    • Others

  • Application Outlook (Volume, Kilotons; Revenue, USD Million, 2018 - 2030)

    • Automotive

    • Building & construction

    • Electrical & electronics

    • Packaging

    • Consumer goods

    • Industrial machinery

    • Medical devices

    • Optical media

    • Aerospace & defense

    • Others

  • Regional Outlook (Volume, Kilotons; Revenue, USD Billion, 2018 - 2030)

    • North America

      • U.S.

      • Canada

      • Mexico

    • Europe

      • Germany

      • UK

      • France

      • Italy

      • Spain

      • Netherlands

    • Asia Pacific

      • China

      • India

      • Japan

      • South Korea

      • Singapore

      • Malaysia

      • Indonesia

      • Thailand

      • Vietnam

      • Australia

    • Central & South America

      • Brazil

      • Argentina

    • Middle East & Africa

      • Saudi Arabia

      • United Arab Emirates (UAE)

      • South Africa

Frequently Asked Questions About This Report

Table of Contents

Chapter 1. Plastic Compounding Market: Methodology and Scope
                      1.1. Market Segmentation & Scope
                      1.2. Market Definition
                      1.3. Information Procurement
                          1.3.1. Purchased Database
                          1.3.2. GVR’s Internal Database
                          1.3.3. Secondary Sources & Third-Party Perspectives
                          1.3.4. Primary Research
                      1.4. Information Analysis
                          1.4.1. Data Analysis Models
                      1.5. Market Formulation & Data Visualization
                      1.6. Data Validation & Publishing
Chapter 2. Plastic Compounding Market: Executive Summary
                      2.1. Market Snapshot, 2023
                      2.2. Segment Snapshot, 2023
                      2.3. Competitive Landscape Snapshot
Chapter 3. Plastic Compounding Market: Variables, Trends & Scope
                      3.1. Global Plastics Market Outlook
                      3.2. Industry Value Chain Analysis
                          3.2.1. Raw Material Trends
                      3.3. Regulatory Framework
                      3.4. Market Dynamics
                          3.4.1. Market Driver Analysis
                          3.4.2. Market Restraint Analysis
                          3.4.3. Industry Opportunity Analysis
                          3.4.4. Industry Challenges Analysis
                      3.5. Porter’s Five Forces Analysis
                          3.5.1. Supplier Power
                          3.5.2. Buyer Power
                          3.5.3. Substitution Threat
                          3.5.4. Threat from New Entrant
                          3.5.5. Competitive Rivalry
                      3.6. PESTEL Analysis
                          3.6.1. Political Landscape
                          3.6.2. Economic Landscape
                          3.6.3. Social Landscape
                          3.6.4. Technological Landscape
                          3.6.5. Environmental Landscape
                          3.6.6. Legal Landscape
                      3.7. East European Geopolitical Implication of the Industry Overview
                      3.8. Impact of COVID-19 on plastic compounding market
Chapter 4. Plastic Compounding Market: Source Outlook Estimates & Forecasts
                      4.1. Plastic Compounding Market: Source Movement Analysis, 2023 & 2030
                      4.2. Fossil-based
                          4.2.1. Plastic compounding market estimates and forecast, by fossil-based, 2018 - 2030 (Kilotons) (USD Million)
                      4.3. Bio-based
                          4.3.1. Plastic compounding market estimates and forecast, by bio-based, 2018 - 2030 (Kilotons) (USD Million)
                      4.4. Recycled
                          4.4.1. Plastic compounding market estimates and forecast, by recycled, 2018 - 2030 (Kilotons) (USD Million)
Chapter 5. Plastic Compounding Market: Product Outlook Estimates & Forecasts
                      5.1. Plastic Compounding Market: Product Movement Analysis, 2023 & 2030
                      5.2. Polyethylene (PE)
                          5.2.1. Plastic compounding market estimates and forecast, by PE, 2018 - 2030 (Kilotons) (USD Million)
                      5.3. Polypropylene (PP)
                          5.3.1. Plastic compounding market estimates and forecast, by PP, 2018 - 2030 (Kilotons) (USD Million)
                      5.4. Thermoplastic Vulcanizates (TPV)
                          5.4.1. Plastic compounding market estimates and forecast, by TPV, 2018 - 2030 (Kilotons) (USD Million)
                      5.5. Thermoplastic Polyolefins (TPO)
                          5.5.1. Plastic compounding market estimates and forecast, by TPO, 2018 - 2030 (Kilotons) (USD Million)
                      5.6. Polyvinyl Chloride (PVC)
                          5.6.1. Plastic compounding market estimates and forecast, by PVC, 2018 - 2030 (Kilotons) (USD Million)
                      5.7. Polystyrene (PS)
                          5.7.1. Plastic compounding market estimates and forecast, by PS, 2018 - 2030 (Kilotons) (USD Million)
                      5.8. Polyethylene Terephthalate (PET)
                          5.8.1. Plastic compounding market estimates and forecast, by PET, 2018 - 2030 (Kilotons) (USD Million)
                      5.9. Polybutylene Terephthalate (PBT)
                          5.9.1. Plastic compounding market estimates and forecast, by PBT, 2018 - 2030 (Kilotons) (USD Million)
                      5.10. Polyamide (PA)
                          5.10.1. Plastic compounding market estimates and forecast, by PA, 2018 - 2030 (Kilotons) (USD Million)
                      5.11. Polycarbonate (PC)
                          5.11.1. Plastic compounding market estimates and forecast, by PC, 2018 - 2030 (Kilotons) (USD Million)
                      5.12. Polyurethane (PU)
                          5.12.1. Plastic compounding market estimates and forecast, by PU, 2018 - 2030 (Kilotons) (USD Million)
                      5.13. Polymethyl Methacrylate (PMMA)
                          5.13.1. Plastic compounding market estimates and forecast, by PMMA, 2018 - 2030 (Kilotons) (USD Million)
                      5.14. Acrylonitrile Butadiene Styre (ABS)
                          5.14.1. Plastic compounding market estimates and forecast, by ABS, 2018 - 2030 (Kilotons) (USD Million)
                      5.15. Others
                          5.15.1. Plastic compounding market estimates and forecast, by Others, 2018 - 2030 (Kilotons) (USD Million)
Chapter 6. Plastic Compounding Market: Application Outlook Estimates & Forecasts
                      6.1. Plastic Compounding Market: Application Movement Analysis, 2023 & 2030
                      6.2. Automotive
                          6.2.1. Plastic compounding market estimates and forecast, by automotive, 2018 - 2030 (Kilotons) (USD Million)
                      6.3. Building & construction
                          6.3.1. Plastic compounding market estimates and forecast, by building & construction, 2018 - 2030 (Kilotons) (USD Million)
                      6.4. Electrical & electronics
                          6.4.1. Plastic compounding market estimates and forecast, by electrical & electronics, 2018 - 2030 (Kilotons) (USD Million)
                      6.5. Packaging
                          6.5.1. Plastic compounding market estimates and forecast, by packaging, 2018 - 2030 (Kilotons) (USD Million)
                      6.6. Consumer goods
                          6.6.1. Plastic compounding market estimates and forecast, by consumer goods, 2018 - 2030 (Kilotons) (USD Million)
                      6.7. Industrial machinery
                          6.7.1. Plastic compounding market estimates and forecast, by industrial machinery, 2018 - 2030 (Kilotons) (USD Million)
                      6.8. Medical devices
                          6.8.1. Plastic compounding market estimates and forecast, by medical devices, 2018 - 2030 (Kilotons) (USD Million)
                      6.9. Optical media
                          6.9.1. Plastic compounding market estimates and forecast, by optical media, 2018 - 2030 (Kilotons) (USD Million)
                      6.10. Aerospace & defense
                          6.10.1. Plastic compounding market estimates and forecast, by aerospace & defense, 2018 - 2030 (Kilotons) (USD Million)
                      6.11. Others
                          6.11.1. Plastic compounding market estimates and forecast, by others, 2018 - 2030 (Kilotons) (USD Million)
Chapter 7. Plastic Compounding Market Regional Outlook Estimates & Forecasts
                      7.1. Regional Movement Analysis & Market Share, 2023 & 2030
                      7.2. Plastic Compounding Market: Regional Movement Analysis, 2023 & 2030
                      7.3. North America
                          7.3.1. North America Market estimates and forecast, 2018 - 2030 (Kilotons) (USD Million)
                          7.3.2. North America Market estimates and forecast, by source, 2018 - 2030 (Kilotons) (USD Million)
                          7.3.3. North America Market estimates and forecast, by product, 2018 - 2030 (Kilotons) (USD Million)
                          7.3.4. North America Market estimates and forecast, by application, 2018 - 2030 (Kilotons) (USD Million)
                          7.3.5. U.S.
                              7.3.5.1. U.S. Market estimates and forecast, 2018 - 2030 (Kilotons) (USD Million)
                              7.3.5.2. U.S. Market estimates and forecast, by source, 2018 - 2030 (Kilotons) (USD Million)
                              7.3.5.3. U.S. Market estimates and forecast, by product, 2018 - 2030 (Kilotons) (USD Million)
                              7.3.5.4. U.S. Market estimates and forecast, by application, 2018 - 2030 (Kilotons) (USD Million)
                          7.3.6. Canada
                              7.3.6.1. Canada Market estimates and forecast, 2018 - 2030 (Kilotons) (USD Million)
                              7.3.6.2. Canada Market estimates and forecast, by source, 2018 - 2030 (Kilotons) (USD Million)
                              7.3.6.3. Canada Market estimates and forecast, by product, 2018 - 2030 (Kilotons) (USD Million)
                              7.3.6.4. Canada Market estimates and forecast, by application, 2018 - 2030 (Kilotons) (USD Million)
                          7.3.7. Mexico
                              7.3.7.1. Mexico Market estimates and forecast, 2018 - 2030 (Kilotons) (USD Million)
                              7.3.7.2. Mexico Market estimates and forecast, by source, 2018 - 2030 (Kilotons) (USD Million)
                              7.3.7.3. Mexico Market estimates and forecast, by product, 2018 - 2030 (Kilotons) (USD Million)
                              7.3.7.4. Mexico Market estimates and forecast, by application, 2018 - 2030 (Kilotons) (USD Million)
                      7.4. Europe
                          7.4.1. Europe Market estimates and forecast, 2018 - 2030 (Kilotons) (USD Million)
                          7.4.2. Europe Market estimates and forecast, by source, 2018 - 2030 (Kilotons) (USD Million)
                          7.4.3. Europe Market estimates and forecast, by product, 2018 - 2030 (Kilotons) (USD Million)
                          7.4.4. Europe Market estimates and forecast, by application, 2018 - 2030 (Kilotons) (USD Million)
                          7.4.5. Germany
                              7.4.5.1. Germany Market estimates and forecast, 2018 - 2030 (Kilotons) (USD Million)
                              7.4.5.2. Germany Market estimates and forecast, by source, 2018 - 2030 (Kilotons) (USD Million)
                              7.4.5.3. Germany Market estimates and forecast, by product, 2018 - 2030 (Kilotons) (USD Million)
                              7.4.5.4. Germany Market estimates and forecast, by application, 2018 - 2030 (Kilotons) (USD Million)
                          7.4.6. France
                              7.4.6.1. France Market estimates and forecast, 2018 - 2030 (Kilotons) (USD Million)
                              7.4.6.2. France Market estimates and forecast, by source, 2018 - 2030 (Kilotons) (USD Million)
                              7.4.6.3. France Market estimates and forecast, by product, 2018 - 2030 (Kilotons) (USD Million)
                              7.4.6.4. France Market estimates and forecast, by application, 2018 - 2030 (Kilotons) (USD Million)
                          7.4.7. UK
                              7.4.7.1. UK Market estimates and forecast, 2018 - 2030 (Kilotons) (USD Million)
                              7.4.7.2. UK Market estimates and forecast, by source, 2018 - 2030 (Kilotons) (USD Million)
                              7.4.7.3. UK Market estimates and forecast, by product, 2018 - 2030 (Kilotons) (USD Million)
                              7.4.7.4. UK Market estimates and forecast, by application, 2018 - 2030 (Kilotons) (USD Million)
                          7.4.8. Italy
                              7.4.8.1. Italy Market estimates and forecast, 2018 - 2030 (Kilotons) (USD Million)
                              7.4.8.2. Italy Market estimates and forecast, by source, 2018 - 2030 (Kilotons) (USD Million)
                              7.4.8.3. Italy Market estimates and forecast, by product, 2018 - 2030 (Kilotons) (USD Million)
                              7.4.8.4. Italy Market estimates and forecast, by application, 2018 - 2030 (Kilotons) (USD Million)
                          7.4.9. France
                              7.4.9.1. France Market estimates and forecast, 2018 - 2030 (Kilotons) (USD Million)
                              7.4.9.2. France Market estimates and forecast, by source, 2018 - 2030 (Kilotons) (USD Million)
                              7.4.9.3. France Market estimates and forecast, by product, 2018 - 2030 (Kilotons) (USD Million)
                              7.4.9.4. France Market estimates and forecast, by application, 2018 - 2030 (Kilotons) (USD Million)
                          7.4.10. Spain
                              7.4.10.1. Spain Market estimates and forecast, 2018 - 2030 (Kilotons) (USD Million)
                              7.4.10.2. Spain Market estimates and forecast, by source, 2018 - 2030 (Kilotons) (USD Million)
                              7.4.10.3. Spain Market estimates and forecast, by product, 2018 - 2030 (Kilotons) (USD Million)
                              7.4.10.4. Spain Market estimates and forecast, by application, 2018 - 2030 (Kilotons) (USD Million)
                          7.4.11. Netherlands
                              7.4.11.1. Netherlands Market estimates and forecast, 2018 - 2030 (Kilotons) (USD Million)
                              7.4.11.2. Netherlands Market estimates and forecast, by source, 2018 - 2030 (Kilotons) (USD Million)
                              7.4.11.3. Netherlands Market estimates and forecast, by product, 2018 - 2030 (Kilotons) (USD Million)
                              7.4.11.4. Netherlands Market estimates and forecast, by application, 2018 - 2030 (Kilotons) (USD Million)
                      7.5. Asia Pacific
                          7.5.1. Asia Pacific Market estimates and forecast, 2018 - 2030 (Kilotons) (USD Million)
                          7.5.2. Asia Pacific Market estimates and forecast, by source, 2018 - 2030 (Kilotons) (USD Million)
                          7.5.3. Asia Pacific Market estimates and forecast, by product, 2018 - 2030 (Kilotons) (USD Million)
                          7.5.4. Asia Pacific Market estimates and forecast, by application, 2018 - 2030 (Kilotons) (USD Million)
                          7.5.5. China
                              7.5.5.1. China Market estimates and forecast, 2018 - 2030 (Kilotons) (USD Million)
                              7.5.5.2. China Market estimates and forecast, by source, 2018 - 2030 (Kilotons) (USD Million)
                              7.5.5.3. China Market estimates and forecast, by product, 2018 - 2030 (Kilotons) (USD Million)
                              7.5.5.4. China Market estimates and forecast, by application, 2018 - 2030 (Kilotons) (USD Million)
                          7.5.6. India
                              7.5.6.1. India Market estimates and forecast, 2018 - 2030 (Kilotons) (USD Million)
                              7.5.6.2. India Market estimates and forecast, by source, 2018 - 2030 (Kilotons) (USD Million)
                              7.5.6.3. India Market estimates and forecast, by product, 2018 - 2030 (Kilotons) (USD Million)
                              7.5.6.4. India Market estimates and forecast, by application, 2018 - 2030 (Kilotons) (USD Million)
                          7.5.7. Japan
                              7.5.7.1. Japan Market estimates and forecast, 2018 - 2030 (Kilotons) (USD Million)
                              7.5.7.2. Japan Market estimates and forecast, by source, 2018 - 2030 (Kilotons) (USD Million)
                              7.5.7.3. Japan Market estimates and forecast, by product, 2018 - 2030 (Kilotons) (USD Million)
                              7.5.7.4. Japan Market estimates and forecast, by application, 2018 - 2030 (Kilotons) (USD Million)
                          7.5.8. South Korea
                              7.5.8.1. South Korea Market estimates and forecast, 2018 - 2030 (Kilotons) (USD Million)
                              7.5.8.2. South Korea Market estimates and forecast, by source, 2018 - 2030 (Kilotons) (USD Million)
                              7.5.8.3. South Korea Market estimates and forecast, by product, 2018 - 2030 (Kilotons) (USD Million)
                              7.5.8.4. South Korea Market estimates and forecast, by application, 2018 - 2030 (Kilotons) (USD Million)
                          7.5.9. Malaysia
                              7.5.9.1. Malaysia Market estimates and forecast, 2018 - 2030 (Kilotons) (USD Million)
                              7.5.9.2. Malaysia Market estimates and forecast, by source, 2018 - 2030 (Kilotons) (USD Million)
                              7.5.9.3. Malaysia Market estimates and forecast, by product, 2018 - 2030 (Kilotons) (USD Million)
                              7.5.9.4. Malaysia Market estimates and forecast, by application, 2018 - 2030 (Kilotons) (USD Million)
                          7.5.10. Thailand
                              7.5.10.1. Thailand Market estimates and forecast, 2018 - 2030 (Kilotons) (USD Million)
                              7.5.10.2. Thailand Market estimates and forecast, by source, 2018 - 2030 (Kilotons) (USD Million)
                              7.5.10.3. Thailand Market estimates and forecast, by product, 2018 - 2030 (Kilotons) (USD Million)
                              7.5.10.4. Thailand Market estimates and forecast, by application, 2018 - 2030 (Kilotons) (USD Million)
                          7.5.11. Indonesia
                              7.5.11.1. Indonesia Market estimates and forecast, 2018 - 2030 (Kilotons) (USD Million)
                              7.5.11.2. Indonesia Market estimates and forecast, by source, 2018 - 2030 (Kilotons) (USD Million)
                              7.5.11.3. Indonesia Market estimates and forecast, by product, 2018 - 2030 (Kilotons) (USD Million)
                              7.5.11.4. Indonesia Market estimates and forecast, by application, 2018 - 2030 (Kilotons) (USD Million)
                          7.5.12. Vietnam
                              7.5.12.1. Vietnam Market estimates and forecast, 2018 - 2030 (Kilotons) (USD Million)
                              7.5.12.2. Vietnam Market estimates and forecast, by source, 2018 - 2030 (Kilotons) (USD Million)
                              7.5.12.3. Vietnam Market estimates and forecast, by product, 2018 - 2030 (Kilotons) (USD Million)
                              7.5.12.4. Vietnam Market estimates and forecast, by application, 2018 - 2030 (Kilotons) (USD Million)
                          7.5.13. Australia
                              7.5.13.1. Australia Market estimates and forecast, 2018 - 2030 (Kilotons) (USD Million)
                              7.5.13.2. Australia Market estimates and forecast, by source, 2018 - 2030 (Kilotons) (USD Million)
                              7.5.13.3. Australia Market estimates and forecast, by product, 2018 - 2030 (Kilotons) (USD Million)
                              7.5.13.4. Australia Market estimates and forecast, by application, 2018 - 2030 (Kilotons) (USD Million)
                      7.6. Central & South America
                          7.6.1. Central & South America Market estimates and forecast, 2018 - 2030 (Kilotons) (USD Million)
                          7.6.2. Central & South America Market estimates and forecast, by source, 2018 - 2030 (Kilotons) (USD Million)
                          7.6.3. Central & South America Market estimates and forecast, by product, 2018 - 2030 (Kilotons) (USD Million)
                          7.6.4. Central & South America Market estimates and forecast, by application, 2018 - 2030 (Kilotons) (USD Million)
                          7.6.5. Brazil
                              7.6.5.1. Brazil Market estimates and forecast, 2018 - 2030 (Kilotons) (USD Million)
                              7.6.5.2. Brazil Market estimates and forecast, by source, 2018 - 2030 (Kilotons) (USD Million)
                              7.6.5.3. Brazil Market estimates and forecast, by product, 2018 - 2030 (Kilotons) (USD Million)
                              7.6.5.4. Brazil Market estimates and forecast, by application, 2018 - 2030 (Kilotons) (USD Million)
                          7.6.6. Argentina
                              7.6.6.1. Argentina Market estimates and forecast, 2018 - 2030 (Kilotons) (USD Million)
                              7.6.6.2. Argentina Market estimates and forecast, by source, 2018 - 2030 (Kilotons) (USD Million)
                              7.6.6.3. Argentina Market estimates and forecast, by product, 2018 - 2030 (Kilotons) (USD Million)
                              7.6.6.4. Argentina Market estimates and forecast, by application, 2018 - 2030 (Kilotons) (USD Million)
                      7.7. Middle East & Africa
                          7.7.1. Middle East & Africa Market estimates and forecast, 2018 - 2030 (Kilotons) (USD Million)
                          7.7.2. Middle East & Africa Market estimates and forecast, by source, 2018 - 2030 (Kilotons) (USD Million)
                          7.7.3. Middle East & Africa Market estimates and forecast, by product, 2018 - 2030 (Kilotons) (USD Million)
                          7.7.4. Middle East & Africa Market estimates and forecast, by application, 2018 - 2030 (Kilotons) (USD Million)
                          7.7.5. Saudi Arabia
                              7.7.5.1. Saudi Arabia Market estimates and forecast, 2018 - 2030 (Kilotons) (USD Million)
                              7.7.5.2. Saudi Arabia Market estimates and forecast, by source, 2018 - 2030 (Kilotons) (USD Million)
                              7.7.5.3. Saudi Arabia Market estimates and forecast, by product, 2018 - 2030 (Kilotons) (USD Million)
                              7.7.5.4. Saudi Arabia Market estimates and forecast, by application, 2018 - 2030 (Kilotons) (USD Million)
                          7.7.6. United Arab Emirates (UAE)
                              7.7.6.1. United Arab Emirates (UAE) Market estimates and forecast, 2018 - 2030 (Kilotons) (USD Million)
                              7.7.6.2. United Arab Emirates (UAE) Market estimates and forecast, by source, 2018 - 2030 (Kilotons) (USD Million)
                              7.7.6.3. United Arab Emirates (UAE) Market estimates and forecast, by product, 2018 - 2030 (Kilotons) (USD Million)
                              7.7.6.4. United Arab Emirates (UAE) Market estimates and forecast, by application, 2018 - 2030 (Kilotons) (USD Million)
                          7.7.7. South Africa
                              7.7.7.1. South Africa Market estimates and forecast, 2018 - 2030 (Kilotons) (USD Million)
                              7.7.7.2. South Africa Market estimates and forecast, by source, 2018 - 2030 (Kilotons) (USD Million)
                              7.7.7.3. South Africa Market estimates and forecast, by product, 2018 - 2030 (Kilotons) (USD Million)
                              7.7.7.4. South Africa Market estimates and forecast, by application, 2018 - 2030 (Kilotons) (USD Million)
Chapter 8. Competitive Landscape
                      8.1. Recent Developments & Impact Analysis, By Key Market Participants
                      8.2. Company Categorization
                      8.3. Company Market Share/Position Analysis, 2023
                      8.4. Company Heat Map Analysis
                      8.5. Strategy Mapping
                          8.5.1. Expansion
                          8.5.2. Mergers & Acquisition
                          8.5.3. Partnerships & Collaborations
                          8.5.4. New Product Launches
                          8.5.5. Research And Development
                      8.6. Company Profiles
                          8.6.1. BASF SE
                              8.6.1.1. Participant’s overview
                              8.6.1.2. Financial performance
                              8.6.1.3. Product benchmarking
                              8.6.1.4. Recent developments
                          8.6.2. SABIC
                              8.6.2.1. Participant’s overview
                              8.6.2.2. Financial performance
                              8.6.2.3. Product benchmarking
                              8.6.2.4. Recent developments
                          8.6.3. Dow, Inc.
                              8.6.3.1. Participant’s overview
                              8.6.3.2. Financial performance
                              8.6.3.3. Product benchmarking
                              8.6.3.4. Recent developments
                          8.6.4. KRATON CORPORATION
                              8.6.4.1. Participant’s overview
                              8.6.4.2. Financial performance
                              8.6.4.3. Product benchmarking
                              8.6.4.4. Recent developments
                          8.6.5. LyondellBasell Industries Holdings B.V.
                              8.6.5.1. Participant’s overview
                              8.6.5.2. Financial performance
                              8.6.5.3. Product benchmarking
                              8.6.5.4. Recent developments
                          8.6.6. DuPont de Nemours
                              8.6.6.1. Participant’s overview
                              8.6.6.2. Financial performance
                              8.6.6.3. Product benchmarking
                              8.6.6.4. Recent developments
                          8.6.7. RTP Company
                              8.6.7.1. Participant’s overview
                              8.6.7.2. Financial performance
                              8.6.7.3. Product benchmarking
                              8.6.7.4. Recent developments
                          8.6.8. S&E Specialty Polymers, LLC
                              8.6.8.1. Participant’s overview
                              8.6.8.2. Financial performance
                              8.6.8.3. Product benchmarking
                              8.6.8.4. Recent developments
                          8.6.9. Asahi Kasei Corporation
                              8.6.9.1. Participant’s overview
                              8.6.9.2. Financial performance
                              8.6.9.3. Product benchmarking
                              8.6.9.4. Recent developments
                          8.6.10. Covestro AG
                              8.6.10.1. Participant’s overview
                              8.6.10.2. Financial performance
                              8.6.10.3. Product benchmarking
                              8.6.10.4. Recent developments
                          8.6.11. Washington Penn
                              8.6.11.1. Participant’s overview
                              8.6.11.2. Financial performance
                              8.6.11.3. Product benchmarking
                              8.6.11.4. Recent developments
                          8.6.12. Eurostar Engineering Plastics
                              8.6.12.1. Participant’s overview
                              8.6.12.2. Financial performance
                              8.6.12.3. Product benchmarking
                              8.6.12.4. Recent developments
                          8.6.13. KURARAY CO., LTD.
                              8.6.13.1. Participant’s overview
                              8.6.13.2. Financial performance
                              8.6.13.3. Product benchmarking
                              8.6.13.4. Recent developments
                          8.6.14. Arkema
                              8.6.14.1. Participant’s overview
                              8.6.14.2. Financial performance
                              8.6.14.3. Product benchmarking
                              8.6.14.4. Recent developments
                          8.6.15. TEIJIN LIMITED
                              8.6.15.1. Participant’s overview
                              8.6.15.2. Financial performance
                              8.6.15.3. Product benchmarking
                              8.6.15.4. Recent developments
                          8.6.16. LANXESS
                              8.6.16.1. Participant’s overview
                              8.6.16.2. Financial performance
                              8.6.16.3. Product benchmarking
                              8.6.16.4. Recent developments
                          8.6.17. Solvay
                              8.6.17.1. Participant’s overview
                              8.6.17.2. Financial performance
                              8.6.17.3. Product benchmarking
                              8.6.17.4. Recent developments
                           8.6.18. SO.F.TER
                              8.6.18.1. Participant’s overview
                              8.6.18.2. Financial performance
                              8.6.18.3. Product benchmarking
                              8.6.18.4. Recent developments
                          8.6.19. Polyvisions, Inc.
                              8.6.19.1. Participant’s overview
                              8.6.19.2. Financial performance
                              8.6.19.3. Product benchmarking
                              8.6.19.4. Recent developments
                          8.6.20. Ravago
                              8.6.20.1. Participant’s overview
                              8.6.20.2. Financial performance
                              8.6.20.3. Product benchmarking
                              8.6.20.4. Recent developments
                          8.6.21. Heritage Plastics
                              8.6.21.1. Participant’s overview
                              8.6.21.2. Financial performance
                              8.6.21.3. Product benchmarking
                              8.6.21.4. Recent developments
                          8.6.22. Chevron Phillips Chemical Company LLC
                              8.6.22.1. Participant’s overview
                              8.6.22.2. Financial performance
                              8.6.22.3. Product benchmarking
                              8.6.22.4. Recent developments
                          8.6.23. Sumitomo Bakelite Co., Ltd.
                              8.6.23.1. Participant’s overview
                              8.6.23.2. Financial performance
                              8.6.23.3. Product benchmarking
                              8.6.23.4. Recent developments
                          8.6.24. Nova Polymers, Inc.
                              8.6.24.1. Participant’s overview
                              8.6.24.2. Financial performance
                              8.6.24.3. Product benchmarking
                              8.6.24.4. Recent developments
                          8.6.25. Adell Plastics, Inc.
                              8.6.25.1. Participant’s overview
                              8.6.25.2. Financial performance
                              8.6.25.3. Product benchmarking
                              8.6.25.4. Recent developments
                          8.6.26. Foster Corporation
                              8.6.26.1. Participant’s overview
                              8.6.26.2. Financial performance
                              8.6.26.3. Product benchmarking
                              8.6.26.4. Recent developments
                          8.6.27. MRC Polymers, Inc.
                              8.6.27.1. Participant’s overview
                              8.6.27.2. Financial performance
                              8.6.27.3. Product benchmarking
                              8.6.27.4. Recent developments
                          8.6.28. Flex Technologies
                              8.6.28.1. Participant’s overview
                              8.6.28.2. Financial performance
                              8.6.28.3. Product benchmarking
                              8.6.28.4. Recent developments
                          8.6.29. Dyneon GmbH & Co. KG
                              8.6.29.1. Participant’s overview
                              8.6.29.2. Financial performance
                              8.6.29.3. Product benchmarking
                              8.6.29.4. Recent developments
                          8.6.30. Kingfa SCI. & TECH. CO., LTD.
                              8.6.30.1. Participant’s overview
                              8.6.30.2. Financial performance
                              8.6.30.3. Product benchmarking
                              8.6.30.4. Recent developments
                          8.6.31. China XD Plastics, Co., Ltd.
                              8.6.31.1. Participant’s overview
                              8.6.31.2. Financial performance
                              8.6.31.3. Product benchmarking
                              8.6.31.4. Recent developments
                          8.6.32. Avient Corporation
                              8.6.32.1. Participant’s overview
                              8.6.32.2. Financial performance
                              8.6.32.3. Product benchmarking
                              8.6.32.4. Recent developments
                          8.6.33. Guangdong Silver Afe Sci
                              8.6.33.1. Participant’s overview
                              8.6.33.2. Financial performance
                              8.6.33.3. Product benchmarking
                              8.6.33.4. Recent developments
                          8.6.34. China General Plastics Corporation (CGPC)
                              8.6.34.1. Participant’s overview
                              8.6.34.2. Financial performance
                              8.6.34.3. Product benchmarking
                              8.6.34.4. Recent developments


List of Tables

Table 1. Plastic Compounding Market estimates and forecasts, 2018 - 2030 (Kilotons) (USD Million)
Table 2. Plastic Compounding Market estimates and forecasts, by PE, 2018 - 2030 (Kilotons) (USD Million)
Table 3. Plastic Compounding Market estimates and forecasts, by PP, 2018 - 2030 (Kilotons) (USD Million)
Table 4. Plastic Compounding Market estimates and forecasts, by TPV, 2018 - 2030 (Kilotons) (USD Million)
Table 5. Plastic Compounding Market estimates and forecasts, by TPO, 2018 - 2030 (Kilotons) (USD Million)
Table 6. Plastic Compounding Market estimates and forecasts, by PVC, 2018 - 2030 (Kilotons) (USD Million)
Table 7. Plastic Compounding Market estimates and forecasts, by PS, 2018 - 2030 (Kilotons) (USD Million)
Table 8. Plastic Compounding Market estimates and forecasts, by PET, 2018 - 2030 (Kilotons) (USD Million)
Table 9. Plastic Compounding Market estimates and forecasts, by PBT, 2018 - 2030 (Kilotons) (USD Million)
Table 10. Plastic Compounding Market estimates and forecasts, by PA, 2018 - 2030 (Kilotons) (USD Million)
Table 11. Plastic Compounding Market estimates and forecasts, by PC, 2018 - 2030 (Kilotons) (USD Million)
Table 12. Plastic Compounding Market estimates and forecasts, by PU, 2018 - 2030 (Kilotons) (USD Million)
Table 13. Plastic Compounding Market estimates and forecasts, by PMMA, 2018 - 2030 (Kilotons) (USD Million)
Table 14. Plastic Compounding Market estimates and forecasts, by ABS, 2018 - 2030 (Kilotons) (USD Million)
Table 15. Plastic Compounding Market estimates and forecasts, by Others, 2018 - 2030 (Kilotons) (USD Million)
Table 16. Plastic Compounding Market estimates and forecasts, by automotive, 2018 - 2030 (Kilotons) (USD Million)
Table 17. Plastic Compounding Market estimates and forecasts, by building & construction, 2018 - 2030 (Kilotons) (USD Million)
Table 18. Plastic Compounding Market estimates and forecasts, in electrical & electronics, 2018 - 2030 (Kilotons) (USD Million)
Table 19. Plastic Compounding Market estimates and forecasts, in packaging, 2018 - 2030 (Kilotons) (USD Million)
Table 20. Plastic Compounding Market estimates and forecasts, in consumer goods, 2018 - 2030 (Kilotons) (USD Million)
Table 21. Plastic Compounding Market estimates and forecasts, in industrial machinery, 2018 - 2030 (Kilotons) (USD Million)
Table 22. Plastic Compounding Market estimates and forecasts, in medical devices, 2018 - 2030 (Kilotons) (USD Million)
Table 23. Plastic Compounding Market estimates and forecasts, in optical media, 2018 - 2030 (Kilotons) (USD Million)
Table 24. Plastic Compounding Market estimates and forecasts, in aerospace & defense, 2018 - 2030 (Kilotons) (USD Million)
Table 25. Plastic Compounding Market estimates and forecasts, in others, 2018 - 2030 (Kilotons) (USD Million)
Table 26. North America Plastic Compounding Market estimates and forecasts, 2018 - 2030 (Kilotons) (USD Million)
Table 27. North America Plastic Compounding Market estimates and forecasts, by source, 2018 - 2030 (Kilotons) (USD Million)
Table 28. North America Plastic Compounding Market estimates and forecasts, by product, 2018 - 2030 (Kilotons) (USD Million)
Table 29. North America Plastic Compounding Market estimates and forecasts, by application, 2018 - 2030 (Kilotons) (USD Million)
Table 30. U.S. Plastic Compounding Market estimates and forecasts, 2018 - 2030 (Kilotons) (USD Million)
Table 31. U.S. Plastic Compounding Market estimates and forecasts, by source, 2018 - 2030 (Kilotons) (USD Million)
Table 32. U.S. Plastic Compounding Market estimates and forecasts, by product, 2018 - 2030 (Kilotons) (USD Million)
Table 33. U.S. Plastic Compounding Market estimates and forecasts, by application, 2018 - 2030 (Kilotons) (USD Million)
Table 34. Canada Plastic Compounding Market estimates and forecasts, 2018 - 2030 (Kilotons) (USD Million)
Table 35. Canada Plastic Compounding Market estimates and forecasts, by source, 2018 - 2030 (Kilotons) (USD Million)
Table 36. Canada Plastic Compounding Market estimates and forecasts, by product, 2018 - 2030 (Kilotons) (USD Million)
Table 37. Canada Plastic Compounding Market estimates and forecasts, by application, 2018 - 2030 (Kilotons) (USD Million)
Table 38. Mexico Plastic Compounding Market estimates and forecasts, 2018 - 2030 (Kilotons) (USD Million)
Table 39. Mexico Plastic Compounding Market estimates and forecasts, by source, 2018 - 2030 (Kilotons) (USD Million)
Table 40. Mexico Plastic Compounding Market estimates and forecasts, by product, 2018 - 2030 (Kilotons) (USD Million)
Table 41. Mexico Plastic Compounding Market estimates and forecasts, by application, 2018 - 2030 (Kilotons) (USD Million)
Table 42. Europe Plastic Compounding Market estimates and forecasts, 2018 - 2030 (Kilotons) (USD Million)
Table 43. Europe Plastic Compounding Market estimates and forecasts, by source, 2018 - 2030 (Kilotons) (USD Million)
Table 44. Europe Plastic Compounding Market estimates and forecasts, by product, 2018 - 2030 (Kilotons) (USD Million)
Table 45. Europe Plastic Compounding Market estimates and forecasts, by application, 2018 - 2030 (Kilotons) (USD Million)
Table 46. Germany Plastic Compounding Market estimates and forecasts, 2018 - 2030 (Kilotons) (USD Million)
Table 47. Germany Plastic Compounding Market estimates and forecasts, by source, 2018 - 2030 (Kilotons) (USD Million)
Table 48. Germany Plastic Compounding Market estimates and forecasts, by product, 2018 - 2030 (Kilotons) (USD Million)
Table 49. Germany Plastic Compounding Market estimates and forecasts, by application, 2018 - 2030 (Kilotons) (USD Million)
Table 50. UK Plastic Compounding Market estimates and forecasts, 2018 - 2030 (Kilotons) (USD Million)
Table 51. UK Plastic Compounding Market estimates and forecasts, by source, 2018 - 2030 (Kilotons) (USD Million)
Table 52. UK Plastic Compounding Market estimates and forecasts, by product, 2018 - 2030 (Kilotons) (USD Million)
Table 53. UK Plastic Compounding Market estimates and forecasts, by application, 2018 - 2030 (Kilotons) (USD Million)
Table 54. France Plastic Compounding Market estimates and forecasts, 2018 - 2030 (Kilotons) (USD Million)
Table 55. France Plastic Compounding Market estimates and forecasts, by source, 2018 - 2030 (Kilotons) (USD Million)
Table 56. France Plastic Compounding Market estimates and forecasts, by product, 2018 - 2030 (Kilotons) (USD Million)
Table 57. France Plastic Compounding Market estimates and forecasts, by application, 2018 - 2030 (Kilotons) (USD Million)
Table 58. Italy Plastic Compounding Market estimates and forecasts, 2018 - 2030 (Kilotons) (USD Million)
Table 59. Italy Plastic Compounding Market estimates and forecasts, by source, 2018 - 2030 (Kilotons) (USD Million)
Table 60. Italy Plastic Compounding Market estimates and forecasts, by product, 2018 - 2030 (Kilotons) (USD Million)
Table 61. Italy Plastic Compounding Market estimates and forecasts, by application, 2018 - 2030 (Kilotons) (USD Million)
Table 62. Spain Plastic Compounding Market estimates and forecasts, 2018 - 2030 (Kilotons) (USD Million)
Table 63. Spain Plastic Compounding Market estimates and forecasts, by source, 2018 - 2030 (Kilotons) (USD Million)
Table 64. Spain Plastic Compounding Market estimates and forecasts, by product, 2018 - 2030 (Kilotons) (USD Million)
Table 65. Spain Plastic Compounding Market estimates and forecasts, by application, 2018 - 2030 (Kilotons) (USD Million)
Table 66. Netherlands Plastic Compounding Market estimates and forecasts, 2018 - 2030 (Kilotons) (USD Million)
Table 67. Netherlands Plastic Compounding Market estimates and forecasts, by source, 2018 - 2030 (Kilotons) (USD Million)
Table 68. Netherlands Plastic Compounding Market estimates and forecasts, by product, 2018 - 2030 (Kilotons) (USD Million)
Table 69. Netherlands Plastic Compounding Market estimates and forecasts, by application, 2018 - 2030 (Kilotons) (USD Million)
Table 70. Asia Pacific Plastic Compounding Market estimates and forecasts, 2018 - 2030 (Kilotons) (USD Million)
Table 71. Asia Pacific Plastic Compounding Market estimates and forecasts, by source, 2018 - 2030 (Kilotons) (USD Million)
Table 72. Asia Pacific Plastic Compounding Market estimates and forecasts, by product, 2018 - 2030 (Kilotons) (USD Million)
Table 73. Asia Pacific Plastic Compounding Market estimates and forecasts, by application, 2018 - 2030 (Kilotons) (USD Million)
Table 74. China Plastic Compounding Market estimates and forecasts, 2018 - 2030 (Kilotons) (USD Million)
Table 75. China Plastic Compounding Market estimates and forecasts, by source, 2018 - 2030 (Kilotons) (USD Million)
Table 76. China Plastic Compounding Market estimates and forecasts, by product, 2018 - 2030 (Kilotons) (USD Million)
Table 77. China Plastic Compounding Market estimates and forecasts, by application, 2018 - 2030 (Kilotons) (USD Million)
Table 78. India Plastic Compounding Market estimates and forecasts, 2018 - 2030 (Kilotons) (USD Million)
Table 79. India Plastic Compounding Market estimates and forecasts, by source, 2018 - 2030 (Kilotons) (USD Million)
Table 80. India Plastic Compounding Market estimates and forecasts, by product, 2018 - 2030 (Kilotons) (USD Million)
Table 81. India Plastic Compounding Market estimates and forecasts, by application, 2018 - 2030 (Kilotons) (USD Million)
Table 82. Japan Plastic Compounding Market estimates and forecasts, 2018 - 2030 (Kilotons) (USD Million)
Table 83. Japan Plastic Compounding Market estimates and forecasts, by source, 2018 - 2030 (Kilotons) (USD Million)
Table 84. Japan Plastic Compounding Market estimates and forecasts, by product, 2018 - 2030 (Kilotons) (USD Million)
Table 85. Japan Plastic Compounding Market estimates and forecasts, by application, 2018 - 2030 (Kilotons) (USD Million)
Table 86. South Korea Plastic Compounding Market estimates and forecasts, 2018 - 2030 (Kilotons) (USD Million)
Table 87. South Korea Plastic Compounding Market estimates and forecasts, by source, 2018 - 2030 (Kilotons) (USD Million)
Table 88. South Korea Plastic Compounding Market estimates and forecasts, by product, 2018 - 2030 (Kilotons) (USD Million)
Table 89. South Korea Plastic Compounding Market estimates and forecasts, by application, 2018 - 2030 (Kilotons) (USD Million)
Table 90. Singapore Plastic Compounding Market estimates and forecasts, 2018 - 2030 (Kilotons) (USD Million)
Table 91. Singapore Plastic Compounding Market estimates and forecasts, by source, 2018 - 2030 (Kilotons) (USD Million)
Table 92. Singapore Plastic Compounding Market estimates and forecasts, by product, 2018 - 2030 (Kilotons) (USD Million)
Table 93. Singapore Plastic Compounding Market estimates and forecasts, by application, 2018 - 2030 (Kilotons) (USD Million)
Table 94. Malaysia Plastic Compounding Market estimates and forecasts, 2018 - 2030 (Kilotons) (USD Million)
Table 95. Malaysia Plastic Compounding Market estimates and forecasts, by source, 2018 - 2030 (Kilotons) (USD Million)
Table 96. Malaysia Plastic Compounding Market estimates and forecasts, by product, 2018 - 2030 (Kilotons) (USD Million)
Table 97. Malaysia Plastic Compounding Market estimates and forecasts, by application, 2018 - 2030 (Kilotons) (USD Million)
Table 98. Thailand Plastic Compounding Market estimates and forecasts, 2018 - 2030 (Kilotons) (USD Million)
Table 99. Thailand Plastic Compounding Market estimates and forecasts, by source, 2018 - 2030 (Kilotons) (USD Million)
Table 100. Thailand Plastic Compounding Market estimates and forecasts, by product, 2018 - 2030 (Kilotons) (USD Million)
Table 101. Thailand Plastic Compounding Market estimates and forecasts, by application, 2018 - 2030 (Kilotons) (USD Million)
Table 102. Vietnam Plastic Compounding Market estimates and forecasts, 2018 - 2030 (Kilotons) (USD Million)
Table 103. Vietnam Plastic Compounding Market estimates and forecasts, by source, 2018 - 2030 (Kilotons) (USD Million)
Table 104. Vietnam Plastic Compounding Market estimates and forecasts, by product, 2018 - 2030 (Kilotons) (USD Million)
Table 105. Vietnam Plastic Compounding Market estimates and forecasts, by application, 2018 - 2030 (Kilotons) (USD Million)
Table 106. Indonesia Plastic Compounding Market estimates and forecasts, 2018 - 2030 (Kilotons) (USD Million)
Table 107. Indonesia Plastic Compounding Market estimates and forecasts, by source, 2018 - 2030 (Kilotons) (USD Million)
Table 108. Indonesia Plastic Compounding Market estimates and forecasts, by product, 2018 - 2030 (Kilotons) (USD Million)
Table 109. Indonesia Plastic Compounding Market estimates and forecasts, by application, 2018 - 2030 (Kilotons) (USD Million)
Table 110. Australia Plastic Compounding Market estimates and forecasts, 2018 - 2030 (Kilotons) (USD Million)
Table 111. Australia Plastic Compounding Market estimates and forecasts, by source, 2018 - 2030 (Kilotons) (USD Million)
Table 112. Australia Plastic Compounding Market estimates and forecasts, by product, 2018 - 2030 (Kilotons) (USD Million)
Table 113. Australia Plastic Compounding Market estimates and forecasts, by application, 2018 - 2030 (Kilotons) (USD Million)
Table 114. Central & South America Plastic Compounding Market estimates and forecasts, 2018 - 2030 (Kilotons) (USD Million)
Table 115. Central & South America Plastic Compounding Market estimates and forecasts, by source, 2018 - 2030 (Kilotons) (USD Million)
Table 116. Central & South America Plastic Compounding Market estimates and forecasts, by product, 2018 - 2030 (Kilotons) (USD Million)
Table 117. Central & South America Plastic Compounding Market estimates and forecasts, by application, 2018 - 2030 (Kilotons) (USD Million)
Table 118. Brazil Plastic Compounding Market estimates and forecasts, 2018 - 2030 (Kilotons) (USD Million)
Table 119. Brazil Plastic Compounding Market estimates and forecasts, by source, 2018 - 2030 (Kilotons) (USD Million)
Table 120. Brazil Plastic Compounding Market estimates and forecasts, by product, 2018 - 2030 (Kilotons) (USD Million)
Table 121. Brazil Plastic Compounding Market estimates and forecasts, by application, 2018 - 2030 (Kilotons) (USD Million)
Table 122. Argentina Plastic Compounding Market estimates and forecasts, 2018 - 2030 (Kilotons) (USD Million)
Table 123. Argentina Plastic Compounding Market estimates and forecasts, by source, 2018 - 2030 (Kilotons) (USD Million)
Table 124. Argentina Plastic Compounding Market estimates and forecasts, by product, 2018 - 2030 (Kilotons) (USD Million)
Table 125. Argentina Plastic Compounding Market estimates and forecasts, by application, 2018 - 2030 (Kilotons) (USD Million)
Table 126. Middle East & Africa Plastic Compounding Market estimates and forecasts, 2018 - 2030 (Kilotons) (USD Million)
Table 127. Middle East & Africa Plastic Compounding Market estimates and forecasts, by source, 2018 - 2030 (Kilotons) (USD Million)
Table 128. Middle East & Africa Plastic Compounding Market estimates and forecasts, by product, 2018 - 2030 (Kilotons) (USD Million)
Table 129. Middle East & Africa Plastic Compounding Market estimates and forecasts, by application, 2018 - 2030 (Kilotons) (USD Million)
Table 130. Saudi Arabia Plastic Compounding Market estimates and forecasts, 2018 - 2030 (Kilotons) (USD Million)
Table 131. Saudi Arabia Plastic Compounding Market estimates and forecasts, by source, 2018 - 2030 (Kilotons) (USD Million)
Table 132. Saudi Arabia Plastic Compounding Market estimates and forecasts, by product, 2018 - 2030 (Kilotons) (USD Million)
Table 133. Saudi Arabia Plastic Compounding Market estimates and forecasts, by application, 2018 - 2030 (Kilotons) (USD Million)
Table 134. United Arab Emirates (UAE) Plastic Compounding Market estimates and forecasts, 2018 - 2030 (Kilotons) (USD Million)
Table 135. United Arab Emirates (UAE) Plastic Compounding Market estimates and forecasts, by source, 2018 - 2030 (Kilotons) (USD Million)
Table 136. United Arab Emirates (UAE) Plastic Compounding Market estimates and forecasts, by product, 2018 - 2030 (Kilotons) (USD Million)
Table 137. United Arab Emirates (UAE) Plastic Compounding Market estimates and forecasts, by application, 2018 - 2030 (Kilotons) (USD Million)
Table 138. South Africa Plastic Compounding Market estimates and forecasts, 2018 - 2030 (Kilotons) (USD Million)
Table 139. Argentina Plastic Compounding Market estimates and forecasts, by source, 2018 - 2030 (Kilotons) (USD Million)
Table 140. South Africa Plastic Compounding Market estimates and forecasts, by product, 2018 - 2030 (Kilotons) (USD Million)
Table 141. South Africa Plastic Compounding Market estimates and forecasts, by application, 2018 - 2030 (Kilotons) (USD Million)


List of Figures

Fig 1. Market segmentation
Fig 2. Information procurement
Fig 3. Data Analysis Models
Fig 4. Market Formulation and Validation
Fig 5. Market snapshot, 2023 (USD Million)
Fig 6. Segmental outlook- Source, product, and application (2023, USD Million)
Fig 7. Competitive outlook
Fig 8. Plastic compounding Market, 2018-2030 (Kilotons) (USD Million)
Fig 9. Value chain analysis
Fig 10. Market dynamics
Fig 11. Porter’s Analysis
Fig 12. PESTEL Analysis
Fig 13. Plastic compounding Market, by source: Key takeaways
Fig 14. Plastic compounding Market, by source: Market share, 2023 & 2030
Fig 15. Plastic compounding Market, by product: Key takeaways
Fig 16. Plastic compounding Market, by product: Market share, 2023 & 2030
Fig 17. Plastic compounding Market, by application: Key takeaways
Fig 18. Plastic compounding Market, by application: Market share, 2023 & 2030
Fig 19. Plastic compounding Market, by region: Key takeaways
Fig 20. Plastic compounding Market, by region: Market share, 2023 & 2030

What questions do you have? Get quick response from our industry experts. Request a Free Consultation

Market Segmentation

  • Plastic Compounding Source Outlook (Volume, Kilotons; Revenue, USD Million, 2018 - 2030)
    • Fossil-based
    • Bio-based
    • Recycled
  • Plastic Compounding Product Outlook (Volume, Kilotons; Revenue, USD Million, 2018 - 2030)
    • Polyethylene (PE)
    • Polypropylene (PP)
    • Thermoplastic Vulcanizates (TPV)
    • Thermoplastic Polyolefins (TPO)
    • Polyvinyl Chloride (PVC)
    • Polystyrene (PS)
    • Polyethylene Terephthalate (PET)
    • Polybutylene Terephthalate (PBT)
    • Polyamide (PA)
    • Polycarbonate (PC)
    • Polyurethane (PU)
    • Polymethyl Methacrylate (PMMA)
    • Acrylonitrile Butadiene Styrene (ABS)
    • Others
  • Plastic Compounding Application Outlook (Volume, Kilotons; Revenue, USD Million, 2018 - 2030)
    • Automotive
    • Building & construction
    • Electrical & electronics
    • Packaging
    • Consumer goods
    • Industrial machinery
    • Medical devices
    • Optical media
    • Aerospace & defense
    • Others
  • Plastic Compounding Regional Outlook (Volume, Kilotons; Revenue, USD Million, 2018 - 2030)
    • North America
      • North America Plastic Compounding Market, By Source
        • Fossil-based
        • Bio-based
        • Recycled
      • North America Plastic Compounding Market, By Product
        • Polyethylene (PE)
        • Polypropylene (PP)
        • Thermoplastic Vulcanizates (TPV)
        • Thermoplastic Polyolefins (TPO)
        • Polyvinyl Chloride (PVC)
        • Polystyrene (PS)
        • Polyethylene Terephthalate (PET)
        • Polybutylene Terephthalate (PBT)
        • Polyamide (PA)
        • Polycarbonate (PC)
        • Polyurethane (PU)
        • Polymethyl Methacrylate (PMMA)
        • Acrylonitrile Butadiene Styrene (ABS)
        • Others
      • North America Plastic Compounding Market, By Application
        • Automotive
        • Building & construction
        • Electrical & electronics
        • Packaging
        • Consumer goods
        • Industrial machinery
        • Medical devices
        • Optical media
        • Aerospace & defense
        • Others
      • U.S.
        • U.S. Plastic Compounding Market, By Source
          • Fossil-based
          • Bio-based
          • Recycled
        • U.S. Plastic Compounding Market, By Product
          • Polyethylene (PE)
          • Polypropylene (PP)
          • Thermoplastic Vulcanizates (TPV)
          • Thermoplastic Polyolefins (TPO)
          • Polyvinyl Chloride (PVC)
          • Polystyrene (PS)
          • Polyethylene Terephthalate (PET)
          • Polybutylene Terephthalate (PBT)
          • Polyamide (PA)
          • Polycarbonate (PC)
          • Polyurethane (PU)
          • Polymethyl Methacrylate (PMMA)
          • Acrylonitrile Butadiene Styrene (ABS)
          • Others
        • U.S. Plastic Compounding Market, By Application
          • Automotive
          • Building & construction
          • Electrical & electronics
          • Packaging
          • Consumer goods
          • Industrial machinery
          • Medical devices
          • Optical media
          • Aerospace & defense
          • Others
        • Canada
          • Canada Plastic Compounding Market, By Source
            • Fossil-based
            • Bio-based
            • Recycled
          • Canada Plastic Compounding Market, By Product
            • Polyethylene (PE)
            • Polypropylene (PP)
            • Thermoplastic Vulcanizates (TPV)
            • Thermoplastic Polyolefins (TPO)
            • Polyvinyl Chloride (PVC)
            • Polystyrene (PS)
            • Polyethylene Terephthalate (PET)
            • Polybutylene Terephthalate (PBT)
            • Polyamide (PA)
            • Polycarbonate (PC)
            • Polyurethane (PU)
            • Polymethyl Methacrylate (PMMA)
            • Acrylonitrile Butadiene Styrene (ABS)
            • Others
          • Canada Plastic Compounding Market, By Application
            • Automotive
            • Building & construction
            • Electrical & electronics
            • Packaging
            • Consumer goods
            • Industrial machinery
            • Medical devices
            • Optical media
            • Aerospace & defense
            • Others
        • Mexico
          • Mexico Plastic Compounding Market, By Source
            • Fossil-based
            • Bio-based
            • Recycled
          • Mexico Plastic Compounding Market, By Product
            • Polyethylene (PE)
            • Polypropylene (PP)
            • Thermoplastic Vulcanizates (TPV)
            • Thermoplastic Polyolefins (TPO)
            • Polyvinyl Chloride (PVC)
            • Polystyrene (PS)
            • Polyethylene Terephthalate (PET)
            • Polybutylene Terephthalate (PBT)
            • Polyamide (PA)
            • Polycarbonate (PC)
            • Polyurethane (PU)
            • Polymethyl Methacrylate (PMMA)
            • Acrylonitrile Butadiene Styrene (ABS)
            • Others
          • Mexico Plastic Compounding Market, By Application
            • Automotive
            • Building & construction
            • Electrical & electronics
            • Packaging
            • Consumer goods
            • Industrial machinery
            • Medical devices
            • Optical media
            • Aerospace & defense
            • Others
    •  Europe
      • Europe Plastic Compounding Market, By Source
        • Fossil-based
        • Bio-based
        • Recycled
      • Europe Plastic Compounding Market, By Product
        • Polyethylene (PE)
        • Polypropylene (PP)
        • Thermoplastic Vulcanizates (TPV)
        • Thermoplastic Polyolefins (TPO)
        • Polyvinyl Chloride (PVC)
        • Polystyrene (PS)
        • Polyethylene Terephthalate (PET)
        • Polybutylene Terephthalate (PBT)
        • Polyamide (PA)
        • Polycarbonate (PC)
        • Polyurethane (PU)
        • Polymethyl Methacrylate (PMMA)
        • Acrylonitrile Butadiene Styrene (ABS)
        • Others
      • Europe Plastic Compounding Market, By Application
        • Automotive
        • Building & construction
        • Electrical & electronics
        • Packaging
        • Consumer goods
        • Industrial machinery
        • Medical devices
        • Optical media
        • Aerospace & defense
        • Others
      • Germany
        • Europe Plastic Compounding Market, By Source
          • Fossil-based
          • Bio-based
          • Recycled
        • Europe Plastic Compounding Market, By Product
          • Polyethylene (PE)
          • Polypropylene (PP)
          • Thermoplastic Vulcanizates (TPV)
          • Thermoplastic Polyolefins (TPO)
          • Polyvinyl Chloride (PVC)
          • Polystyrene (PS)
          • Polyethylene Terephthalate (PET)
          • Polybutylene Terephthalate (PBT)
          • Polyamide (PA)
          • Polycarbonate (PC)
          • Polyurethane (PU)
          • Polymethyl Methacrylate (PMMA)
          • Acrylonitrile Butadiene Styrene (ABS)
          • Others
        • Europe Plastic Compounding Market, By Application
          • Automotive
          • Building & construction
          • Electrical & electronics
          • Packaging
          • Consumer goods
          • Industrial machinery
          • Medical devices
          • Optical media
          • Aerospace & defense
          • Others
      • UK
        • UK Plastic Compounding Market, By Source
          • Fossil-based
          • Bio-based
          • Recycled
        • UK Plastic Compounding Market, By Product
          • Polyethylene (PE)
          • Polypropylene (PP)
          • Thermoplastic Vulcanizates (TPV)
          • Thermoplastic Polyolefins (TPO)
          • Polyvinyl Chloride (PVC)
          • Polystyrene (PS)
          • Polyethylene Terephthalate (PET)
          • Polybutylene Terephthalate (PBT)
          • Polyamide (PA)
          • Polycarbonate (PC)
          • Polyurethane (PU)
          • Polymethyl Methacrylate (PMMA)
          • Acrylonitrile Butadiene Styrene (ABS)
          • Others
        • UK Plastic Compounding Market, By Application
          • Automotive
          • Building & construction
          • Electrical & electronics
          • Packaging
          • Consumer goods
          • Industrial machinery
          • Medical devices
          • Optical media
          • Aerospace & defense
          • Others
      • France
        • France Plastic Compounding Market, By Source
          • Fossil-based
          • Bio-based
          • Recycled
        • France Plastic Compounding Market, By Product
          • Polyethylene (PE)
          • Polypropylene (PP)
          • Thermoplastic Vulcanizates (TPV)
          • Thermoplastic Polyolefins (TPO)
          • Polyvinyl Chloride (PVC)
          • Polystyrene (PS)
          • Polyethylene Terephthalate (PET)
          • Polybutylene Terephthalate (PBT)
          • Polyamide (PA)
          • Polycarbonate (PC)
          • Polyurethane (PU)
          • Polymethyl Methacrylate (PMMA)
          • Acrylonitrile Butadiene Styrene (ABS)
          • Others
        • France Plastic Compounding Market, By Application
          • Automotive
          • Building & construction
          • Electrical & electronics
          • Packaging
          • Consumer goods
          • Industrial machinery
          • Medical devices
          • Optical media
          • Aerospace & defense
          • Others
      • Italy
        • Italy Plastic Compounding Market, By Source
          • Fossil-based
          • Bio-based
          • Recycled
        • Italy Plastic Compounding Market, By Product
          • Polyethylene (PE)
          • Polypropylene (PP)
          • Thermoplastic Vulcanizates (TPV)
          • Thermoplastic Polyolefins (TPO)
          • Polyvinyl Chloride (PVC)
          • Polystyrene (PS)
          • Polyethylene Terephthalate (PET)
          • Polybutylene Terephthalate (PBT)
          • Polyamide (PA)
          • Polycarbonate (PC)
          • Polyurethane (PU)
          • Polymethyl Methacrylate (PMMA)
          • Acrylonitrile Butadiene Styrene (ABS)
          • Others
        • Italy Plastic Compounding Market, By Application
          • Automotive
          • Building & construction
          • Electrical & electronics
          • Packaging
          • Consumer goods
          • Industrial machinery
          • Medical devices
          • Optical media
          • Aerospace & defense
          • Others
      • Spain
        • Spain Plastic Compounding Market, By Source
          • Fossil-based
          • Bio-based
          • Recycled
        • Spain Plastic Compounding Market, By Product
          • Polyethylene (PE)
          • Polypropylene (PP)
          • Thermoplastic Vulcanizates (TPV)
          • Thermoplastic Polyolefins (TPO)
          • Polyvinyl Chloride (PVC)
          • Polystyrene (PS)
          • Polyethylene Terephthalate (PET)
          • Polybutylene Terephthalate (PBT)
          • Polyamide (PA)
          • Polycarbonate (PC)
          • Polyurethane (PU)
          • Polymethyl Methacrylate (PMMA)
          • Acrylonitrile Butadiene Styrene (ABS)
          • Others
        • Spain Plastic Compounding Market, By Application
          • Automotive
          • Building & construction
          • Electrical & electronics
          • Packaging
          • Consumer goods
          • Industrial machinery
          • Medical devices
          • Optical media
          • Aerospace & defense
          • Others
      • Netherlands
        • Netherlands Plastic Compounding Market, By Source
          • Fossil-based
          • Bio-based
          • Recycled
        • Netherlands Plastic Compounding Market, By Product
          • Polyethylene (PE)
          • Polypropylene (PP)
          • Thermoplastic Vulcanizates (TPV)
          • Thermoplastic Polyolefins (TPO)
          • Polyvinyl Chloride (PVC)
          • Polystyrene (PS)
          • Polyethylene Terephthalate (PET)
          • Polybutylene Terephthalate (PBT)
          • Polyamide (PA)
          • Polycarbonate (PC)
          • Polyurethane (PU)
          • Polymethyl Methacrylate (PMMA)
          • Acrylonitrile Butadiene Styrene (ABS)
          • Others
        • Netherlands Plastic Compounding Market, By Application
          • Automotive
          • Building & construction
          • Electrical & electronics
          • Packaging
          • Consumer goods
          • Industrial machinery
          • Medical devices
          • Optical media
          • Aerospace & defense
          • Others
    • Asia Pacific
      • Asia Pacific Plastic Compounding Market, By Source
        • Fossil-based
        • Bio-based
        • Recycled
      • Asia Pacific Plastic Compounding Market, By Product
        • Polyethylene (PE)
        • Polypropylene (PP)
        • Thermoplastic Vulcanizates (TPV)
        • Thermoplastic Polyolefins (TPO)
        • Polyvinyl Chloride (PVC)
        • Polystyrene (PS)
        • Polyethylene Terephthalate (PET)
        • Polybutylene Terephthalate (PBT)
        • Polyamide (PA)
        • Polycarbonate (PC)
        • Polyurethane (PU)
        • Polymethyl Methacrylate (PMMA)
        • Acrylonitrile Butadiene Styrene (ABS)
        • Others
      • Asia Pacific Plastic Compounding Market, By Application
        • Automotive
        • Building & construction
        • Electrical & electronics
        • Packaging
        • Consumer goods
        • Industrial machinery
        • Medical devices
        • Optical media
        • Aerospace & defense
        • Others
      • China
        • China Plastic Compounding Market, By Source
          • Fossil-based
          • Bio-based
          • Recycled
        • China Plastic Compounding Market, By Product
          • Polyethylene (PE)
          • Polypropylene (PP)
          • Thermoplastic Vulcanizates (TPV)
          • Thermoplastic Polyolefins (TPO)
          • Polyvinyl Chloride (PVC)
          • Polystyrene (PS)
          • Polyethylene Terephthalate (PET)
          • Polybutylene Terephthalate (PBT)
          • Polyamide (PA)
          • Polycarbonate (PC)
          • Polyurethane (PU)
          • Polymethyl Methacrylate (PMMA)
          • Acrylonitrile Butadiene Styrene (ABS)
          • Others
        • China Plastic Compounding Market, By Application
          • Automotive
          • Building & construction
          • Electrical & electronics
          • Packaging
          • Consumer goods
          • Industrial machinery
          • Medical devices
          • Optical media
          • Aerospace & defense
          • Others
      • India
        • India Plastic Compounding Market, By Source
          • Fossil-based
          • Bio-based
          • Recycled
        • India Plastic Compounding Market, By Product
          • Polyethylene (PE)
          • Polypropylene (PP)
          • Thermoplastic Vulcanizates (TPV)
          • Thermoplastic Polyolefins (TPO)
          • Polyvinyl Chloride (PVC)
          • Polystyrene (PS)
          • Polyethylene Terephthalate (PET)
          • Polybutylene Terephthalate (PBT)
          • Polyamide (PA)
          • Polycarbonate (PC)
          • Polyurethane (PU)
          • Polymethyl Methacrylate (PMMA)
          • Acrylonitrile Butadiene Styrene (ABS)
          • Others
        • India Plastic Compounding Market, By Application
          • Automotive
          • Building & construction
          • Electrical & electronics
          • Packaging
          • Consumer goods
          • Industrial machinery
          • Medical devices
          • Optical media
          • Aerospace & defense
          • Others
      • Japan
        • Japan Plastic Compounding Market, By Source
          • Fossil-based
          • Bio-based
          • Recycled
        • Japan Plastic Compounding Market, By Product
          • Polyethylene (PE)
          • Polypropylene (PP)
          • Thermoplastic Vulcanizates (TPV)
          • Thermoplastic Polyolefins (TPO)
          • Polyvinyl Chloride (PVC)
          • Polystyrene (PS)
          • Polyethylene Terephthalate (PET)
          • Polybutylene Terephthalate (PBT)
          • Polyamide (PA)
          • Polycarbonate (PC)
          • Polyurethane (PU)
          • Polymethyl Methacrylate (PMMA)
          • Acrylonitrile Butadiene Styrene (ABS)
          • Others
        • Japan Plastic Compounding Market, By Application
          • Automotive
          • Building & construction
          • Electrical & electronics
          • Packaging
          • Consumer goods
          • Industrial machinery
          • Medical devices
          • Optical media
          • Aerospace & defense
          • Others
      • South Korea
        • South Korea Plastic Compounding Market, By Source
          • Fossil-based
          • Bio-based
          • Recycled
        • South Korea Plastic Compounding Market, By Product
          • Polyethylene (PE)
          • Polypropylene (PP)
          • Thermoplastic Vulcanizates (TPV)
          • Thermoplastic Polyolefins (TPO)
          • Polyvinyl Chloride (PVC)
          • Polystyrene (PS)
          • Polyethylene Terephthalate (PET)
          • Polybutylene Terephthalate (PBT)
          • Polyamide (PA)
          • Polycarbonate (PC)
          • Polyurethane (PU)
          • Polymethyl Methacrylate (PMMA)
          • Acrylonitrile Butadiene Styrene (ABS)
          • Others
        • South Korea Plastic Compounding Market, By Application
          • Automotive
          • Building & construction
          • Electrical & electronics
          • Packaging
          • Consumer goods
          • Industrial machinery
          • Medical devices
          • Optical media
          • Aerospace & defense
          • Others
      • Singapore
        • Singapore Plastic Compounding Market, By Source
          • Fossil-based
          • Bio-based
          • Recycled
        • Singapore Plastic Compounding Market, By Product
          • Polyethylene (PE)
          • Polypropylene (PP)
          • Thermoplastic Vulcanizates (TPV)
          • Thermoplastic Polyolefins (TPO)
          • Polyvinyl Chloride (PVC)
          • Polystyrene (PS)
          • Polyethylene Terephthalate (PET)
          • Polybutylene Terephthalate (PBT)
          • Polyamide (PA)
          • Polycarbonate (PC)
          • Polyurethane (PU)
          • Polymethyl Methacrylate (PMMA)
          • Acrylonitrile Butadiene Styrene (ABS)
          • Others
        • Singapore Plastic Compounding Market, By Application
          • Automotive
          • Building & construction
          • Electrical & electronics
          • Packaging
          • Consumer goods
          • Industrial machinery
          • Medical devices
          • Optical media
          • Aerospace & defense
          • Others
      • Malaysia
        • Malaysia Plastic Compounding Market, By Source
          • Fossil-based
          • Bio-based
          • Recycled
        • Malaysia Plastic Compounding Market, By Product
          • Polyethylene (PE)
          • Polypropylene (PP)
          • Thermoplastic Vulcanizates (TPV)
          • Thermoplastic Polyolefins (TPO)
          • Polyvinyl Chloride (PVC)
          • Polystyrene (PS)
          • Polyethylene Terephthalate (PET)
          • Polybutylene Terephthalate (PBT)
          • Polyamide (PA)
          • Polycarbonate (PC)
          • Polyurethane (PU)
          • Polymethyl Methacrylate (PMMA)
          • Acrylonitrile Butadiene Styrene (ABS)
          • Others
        • Malaysia Plastic Compounding Market, By Application
          • Automotive
          • Building & construction
          • Electrical & electronics
          • Packaging
          • Consumer goods
          • Industrial machinery
          • Medical devices
          • Optical media
          • Aerospace & defense
          • Others
      • Indonesia
        • Indonesia Plastic Compounding Market, By Source
          • Fossil-based
          • Bio-based
          • Recycled
        • Indonesia Plastic Compounding Market, By Product
          • Polyethylene (PE)
          • Polypropylene (PP)
          • Thermoplastic Vulcanizates (TPV)
          • Thermoplastic Polyolefins (TPO)
          • Polyvinyl Chloride (PVC)
          • Polystyrene (PS)
          • Polyethylene Terephthalate (PET)
          • Polybutylene Terephthalate (PBT)
          • Polyamide (PA)
          • Polycarbonate (PC)
          • Polyurethane (PU)
          • Polymethyl Methacrylate (PMMA)
          • Acrylonitrile Butadiene Styrene (ABS)
          • Others
        • Indonesia Plastic Compounding Market, By Application
          • Automotive
          • Building & construction
          • Electrical & electronics
          • Packaging
          • Consumer goods
          • Industrial machinery
          • Medical devices
          • Optical media
          • Aerospace & defense
          • Others
      • Thailand
        • Thailand Plastic Compounding Market, By Source
          • Fossil-based
          • Bio-based
          • Recycled
        • Thailand Plastic Compounding Market, By Product
          • Polyethylene (PE)
          • Polypropylene (PP)
          • Thermoplastic Vulcanizates (TPV)
          • Thermoplastic Polyolefins (TPO)
          • Polyvinyl Chloride (PVC)
          • Polystyrene (PS)
          • Polyethylene Terephthalate (PET)
          • Polybutylene Terephthalate (PBT)
          • Polyamide (PA)
          • Polycarbonate (PC)
          • Polyurethane (PU)
          • Polymethyl Methacrylate (PMMA)
          • Acrylonitrile Butadiene Styrene (ABS)
          • Others
        • Thailand Plastic Compounding Market, By Application
          • Automotive
          • Building & construction
          • Electrical & electronics
          • Packaging
          • Consumer goods
          • Industrial machinery
          • Medical devices
          • Optical media
          • Aerospace & defense
          • Others
      • Vietnam
        • Vietnam Plastic Compounding Market, By Source
          • Fossil-based
          • Bio-based
          • Recycled
        • Vietnam Plastic Compounding Market, By Product
          • Polyethylene (PE)
          • Polypropylene (PP)
          • Thermoplastic Vulcanizates (TPV)
          • Thermoplastic Polyolefins (TPO)
          • Polyvinyl Chloride (PVC)
          • Polystyrene (PS)
          • Polyethylene Terephthalate (PET)
          • Polybutylene Terephthalate (PBT)
          • Polyamide (PA)
          • Polycarbonate (PC)
          • Polyurethane (PU)
          • Polymethyl Methacrylate (PMMA)
          • Acrylonitrile Butadiene Styrene (ABS)
          • Others
        • Vietnam Plastic Compounding Market, By Application
          • Automotive
          • Building & construction
          • Electrical & electronics
          • Packaging
          • Consumer goods
          • Industrial machinery
          • Medical devices
          • Optical media
          • Aerospace & defense
          • Others
      • Australia
        • Australia Plastic Compounding Market, By Source
          • Fossil-based
          • Bio-based
          • Recycled
        • Australia Plastic Compounding Market, By Product
          • Polyethylene (PE)
          • Polypropylene (PP)
          • Thermoplastic Vulcanizates (TPV)
          • Thermoplastic Polyolefins (TPO)
          • Polyvinyl Chloride (PVC)
          • Polystyrene (PS)
          • Polyethylene Terephthalate (PET)
          • Polybutylene Terephthalate (PBT)
          • Polyamide (PA)
          • Polycarbonate (PC)
          • Polyurethane (PU)
          • Polymethyl Methacrylate (PMMA)
          • Acrylonitrile Butadiene Styrene (ABS)
          • Others
        • Australia Plastic Compounding Market, By Application
          • Automotive
          • Building & construction
          • Electrical & electronics
          • Packaging
          • Consumer goods
          • Industrial machinery
          • Medical devices
          • Optical media
          • Aerospace & defense
          • Others
    • Central & South America
      • Central & South America Plastic Compounding Market, By Source
        • Fossil-based
        • Bio-based
        • Recycled
      • Central & South America Plastic Compounding Market, By Product
        • Polyethylene (PE)
        • Polypropylene (PP)
        • Thermoplastic Vulcanizates (TPV)
        • Thermoplastic Polyolefins (TPO)
        • Polyvinyl Chloride (PVC)
        • Polystyrene (PS)
        • Polyethylene Terephthalate (PET)
        • Polybutylene Terephthalate (PBT)
        • Polyamide (PA)
        • Polycarbonate (PC)
        • Polyurethane (PU)
        • Polymethyl Methacrylate (PMMA)
        • Acrylonitrile Butadiene Styrene (ABS)
        • Others
      • Central & South America Plastic Compounding Market, By Application
        • Automotive
        • Building & construction
        • Electrical & electronics
        • Packaging
        • Consumer goods
        • Industrial machinery
        • Medical devices
        • Optical media
        • Aerospace & defense
        • Others
      • Brazil
        • Brazil Plastic Compounding Market, By Source
          • Fossil-based
          • Bio-based
          • Recycled
        • Brazil Plastic Compounding Market, By Product
          • Polyethylene (PE)
          • Polypropylene (PP)
          • Thermoplastic Vulcanizates (TPV)
          • Thermoplastic Polyolefins (TPO)
          • Polyvinyl Chloride (PVC)
          • Polystyrene (PS)
          • Polyethylene Terephthalate (PET)
          • Polybutylene Terephthalate (PBT)
          • Polyamide (PA)
          • Polycarbonate (PC)
          • Polyurethane (PU)
          • Polymethyl Methacrylate (PMMA)
          • Acrylonitrile Butadiene Styrene (ABS)
          • Others
        • Brazil Plastic Compounding Market, By Application
          • Automotive
          • Building & construction
          • Electrical & electronics
          • Packaging
          • Consumer goods
          • Industrial machinery
          • Medical devices
          • Optical media
          • Aerospace & defense
          • Others
      • Argentina
        • Argentina Plastic Compounding Market, By Source
          • Fossil-based
          • Bio-based
          • Recycled
        • Argentina Plastic Compounding Market, By Product
          • Polyethylene (PE)
          • Polypropylene (PP)
          • Thermoplastic Vulcanizates (TPV)
          • Thermoplastic Polyolefins (TPO)
          • Polyvinyl Chloride (PVC)
          • Polystyrene (PS)
          • Polyethylene Terephthalate (PET)
          • Polybutylene Terephthalate (PBT)
          • Polyamide (PA)
          • Polycarbonate (PC)
          • Polyurethane (PU)
          • Polymethyl Methacrylate (PMMA)
          • Acrylonitrile Butadiene Styrene (ABS)
          • Others
        • Argentina Plastic Compounding Market, By Application
          • Automotive
          • Building & construction
          • Electrical & electronics
          • Packaging
          • Consumer goods
          • Industrial machinery
          • Medical devices
          • Optical media
          • Aerospace & defense
          • Others
    • Middle East & Africa
      • Middle East & Africa Plastic Compounding Market, By Source
        • Fossil-based
        • Bio-based
        • Recycled
      • Middle East & Africa Plastic Compounding Market, By Product
        • Polyethylene (PE)
        • Polypropylene (PP)
        • Thermoplastic Vulcanizates (TPV)
        • Thermoplastic Polyolefins (TPO)
        • Polyvinyl Chloride (PVC)
        • Polystyrene (PS)
        • Polyethylene Terephthalate (PET)
        • Polybutylene Terephthalate (PBT)
        • Polyamide (PA)
        • Polycarbonate (PC)
        • Polyurethane (PU)
        • Polymethyl Methacrylate (PMMA)
        • Acrylonitrile Butadiene Styrene (ABS)
        • Others
      • Middle East & Africa Plastic Compounding Market, By Application
        • Automotive
        • Building & construction
        • Electrical & electronics
        • Packaging
        • Consumer goods
        • Industrial machinery
        • Medical devices
        • Optical media
        • Aerospace & defense
        • Others
      • Saudi Arabia
        • Saudi Arabia Plastic Compounding Market, By Source
          • Fossil-based
          • Bio-based
          • Recycled
        • Saudi Arabia Plastic Compounding Market, By Product
          • Polyethylene (PE)
          • Polypropylene (PP)
          • Thermoplastic Vulcanizates (TPV)
          • Thermoplastic Polyolefins (TPO)
          • Polyvinyl Chloride (PVC)
          • Polystyrene (PS)
          • Polyethylene Terephthalate (PET)
          • Polybutylene Terephthalate (PBT)
          • Polyamide (PA)
          • Polycarbonate (PC)
          • Polyurethane (PU)
          • Polymethyl Methacrylate (PMMA)
          • Acrylonitrile Butadiene Styrene (ABS)
          • Others
        • Saudi Arabia Plastic Compounding Market, By Application
          • Automotive
          • Building & construction
          • Electrical & electronics
          • Packaging
          • Consumer goods
          • Industrial machinery
          • Medical devices
          • Optical media
          • Aerospace & defense
          • Others
      • United Arab Emirates (UAE)
        • UAE Plastic Compounding Market, By Source
          • Fossil-based
          • Bio-based
          • Recycled
        • UAE Plastic Compounding Market, By Product
          • Polyethylene (PE)
          • Polypropylene (PP)
          • Thermoplastic Vulcanizates (TPV)
          • Thermoplastic Polyolefins (TPO)
          • Polyvinyl Chloride (PVC)
          • Polystyrene (PS)
          • Polyethylene Terephthalate (PET)
          • Polybutylene Terephthalate (PBT)
          • Polyamide (PA)
          • Polycarbonate (PC)
          • Polyurethane (PU)
          • Polymethyl Methacrylate (PMMA)
          • Acrylonitrile Butadiene Styrene (ABS)
          • Others
        • UAE Plastic Compounding Market, By Application
          • Automotive
          • Building & construction
          • Electrical & electronics
          • Packaging
          • Consumer goods
          • Industrial machinery
          • Medical devices
          • Optical media
          • Aerospace & defense
          • Others
      • South Africa
        • South Africa Plastic Compounding Market, By Source
          • Fossil-based
          • Bio-based
          • Recycled
        • South Africa Plastic Compounding Market, By Product
          • Polyethylene (PE)
          • Polypropylene (PP)
          • Thermoplastic Vulcanizates (TPV)
          • Thermoplastic Polyolefins (TPO)
          • Polyvinyl Chloride (PVC)
          • Polystyrene (PS)
          • Polyethylene Terephthalate (PET)
          • Polybutylene Terephthalate (PBT)
          • Polyamide (PA)
          • Polycarbonate (PC)
          • Polyurethane (PU)
          • Polymethyl Methacrylate (PMMA)
          • Acrylonitrile Butadiene Styrene (ABS)
          • Others
        • South Africa Plastic Compounding Market, By Application
          • Automotive
          • Building & construction
          • Electrical & electronics
          • Packaging
          • Consumer goods
          • Industrial machinery
          • Medical devices
          • Optical media
          • Aerospace & defense
          • Others

Plastic Compounding Market Dynamics

Driver: Rising demand from automotive industry

Compared to traditional materials like rubber or metals, the usage of plastic compounded goods in automotive applications helps minimize fuel consumption by reducing the density and weight of cars. Over the projected period, the rising consumer awareness of consumer safety and health concerns in different industries such as electronics, healthcare, wire & cable, construction, and automotive is expected to fuel the global demand for plastics. Compounded plastics are used in the automotive industry for underhood components as well as exteriors and interiors. The demand for safe, lightweight, and affordable multi-utility vehicle (MUV)/sport utility vehicle (SUV) models with high fuel efficiency and an emphasis on comfort and aesthetics is driving the increased use of plastic compounds in the automotive industry. Plastics' soft-touch and odor-free properties enable better steering wheels, handles, and interiors in automobiles.

Driver: Increasing demand from construction industry

Population growth in emerging economies, rapid industrialization and urbanization have prompted various federal governments to increase construction spending to meet growing infrastructure needs. get a raise. Additionally, increased government spending on construction and infrastructure, especially in India and China, is expected to boost the demand for plastics. According to the Organization for Economic Cooperation and Development (OCED), as of 2018, Asia Pacific has become one of the fastest-growing construction markets. China, India, Indonesia, Japan and Australia are some of the major countries where the construction industry is expected to witness significant growth during the forecast period. The presence of stringent regulations regarding recyclability and the depletion of conventional materials, such as wood and metal, are factors expected to drive the demand for compounded plastics in floorings, pipes, windows, insulation, cables, and storage tanks used in the construction industry.

Restraint: Volatile raw material prices

The raw materials used in plastic production include hydrocarbon fuels such as crude oil, natural gas, coal, salt, and sand. The production of polyethylene (PE) in North America is mainly dependent on natural gas, which is available at a very low cost in the region. Thus, PE producers in the region are very competitive, keeping the resins market very tight and exporting in large quantities. Changes in supply and demand in the future are also expected to cause plastic prices to fluctuate strongly in the global market. Most of the raw materials are produced by downstream petrochemical processes. Crude oil price volatility can be attributed to political instability, supply-demand imbalance and seasonal fluctuations.

What Does This Report Include?

This section will provide insights into the contents included in this plastic compounding market report and help gain clarity on the structure of the report to assist readers in navigating smoothly.

Plastic compounding market qualitative analysis

  • Industry overview

  • Industry trends

  • Market drivers and restraints

  • Market size

  • Growth prospects

  • Porter’s analysis

  • PESTEL analysis

  • Key market opportunities prioritized

  • Competitive landscape

    • Company overview

    • Financial performance

    • Product benchmarking

    • Latest strategic developments

Plastic compounding market quantitative analysis

  • Market size, estimates, and forecast from 2018 to 2030

  • Market estimates and forecast for product segments up to 2030

  • Regional market size and forecast for product segments up to 2030

  • Market estimates and forecast for application segments up to 2030

  • Regional market size and forecast for application segments up to 2030

  • Company financial performance

What questions do you have? Get quick response from our industry experts. Request a Free Consultation

Research Methodology

A three-pronged approach was followed for deducing the plastic compounding market estimates and forecasts. The process has three steps: information procurement, analysis, and validation. The whole process is cyclical, and steps repeat until the estimates are validated. The three steps are explained in detail below:

Information procurement: Information procurement is one of the most extensive and important stages in our research process, and quality data is critical for accurate analysis. We followed a multi-channel data collection process for plastic compounding market to gather the most reliable and current information possible.

  • We buy access to paid databases such as Hoover’s and Factiva for company financials, industry information, white papers, industry journals, SME journals, and more.
  • We tap into Grand View’s proprietary database of data points and insights from active and archived monitoring and reporting.
  • We conduct primary research with industry experts through questionnaires and one-on-one phone interviews.
  • We pull from reliable secondary sources such as white papers and government statistics, published by organizations like WHO, NGOs, World Bank, etc., Key Opinion Leaders (KoL) publications, company filings, investor documents, and more.
  • We purchase and review investor analyst reports, broker reports, academic commentary, government quotes, and wealth management publications for insightful third-party perspectives.

Analysis: We mine the data collected to establish baselines for forecasting, identify trends and opportunities, gain insight into consumer demographics and drivers, and so much more. We utilized different methods of plastic compounding market data depending on the type of information we’re trying to uncover in our research.

  • Market Research Efforts: Bottom-up Approach for estimating and forecasting demand size and opportunity, top-down Approach for new product forecasting and penetration, and combined approach of both Bottom-up and Top-down for full coverage analysis.

  • Value-Chain-Based Sizing & Forecasting: Supply-side estimates for understanding potential revenue through competitive benchmarking, forecasting, and penetration modeling.

  • Demand-side estimates for identifying parent and ancillary markets, segment modeling, and heuristic forecasting.

  • Qualitative Functional Deployment (QFD) Modelling for market share assessment.

Market formulation and validation: We mine the data collected to establish baselines for forecasting, identify trends and opportunities, gain insight into consumer demographics and drivers, and so much more. We utilize different methods of data analysis depending on the type of information we’re trying to uncover in our research.

  • Market Formulation: This step involves the finalization of market numbers. This step on an internal level is designed to manage outputs from the Data Analysis step.

  • Data Normalization: The final market estimates and forecasts are then aligned and sent to industry experts, in-panel quality control managers for validation.

  • This step also entails the finalization of the report scope and data representation pattern.

  • Validation: The process entails multiple levels of validation. All these steps run in parallel, and the study is forwarded for publishing only if all three levels render validated results.

Plastic Compounding Market Categorization:

The plastic compounding market was categorized into four segments, namely source (Fossil-based, Bio-based, Recycled), product (Polyethylene, Polypropylene, Thermoplastic Vulcanizates, Thermoplastic Polyolefins, Polyvinyl Chloride, Polystyrene, Polyethylene Terephthalate, Polybutylene Terephthalate, Polyamide, Polycarbonate, Polyurethane, Polymethyl Methacrylate, Acrylonitrile Butadiene Styrene), application (Automotive, Building & construction, Electrical & electronics, Packaging, Consumer goods, Industrial machinery, Medical devices, Optical media, Aerospace & defense), and region (North America, Europe, Asia Pacific, Central & South America, and Middle East & Africa).

Segment Market Methodology:

The plastic compounding market was segmented into source, product, application, and regions. The demand at a segment level was deduced using a funnel method. Concepts like the TAM, SAM, SOM, etc., were put into practice to understand the demand. We at GVR deploy three methods to deduce market estimates and determine forecasts. These methods are explained below:

Market research approaches: Bottom-up

  • Demand estimation of each product across countries/regions summed up to from the total market.

  • Variable analysis for demand forecast.

  • Demand estimation via analyzing paid database, and company financials either via annual reports or paid database.

  • Primary interviews for data revalidation and insight collection.

Market research approaches: Top-down

  • Used extensively for new product forecasting or analyzing penetration levels.

  • Tool used invoice product flow and penetration models Use of regression multi-variant analysis for forecasting Involves extensive use of paid and public databases.

  • Primary interviews and vendor-based primary research for variable impact analysis.

Market research approaches: Combined

  • This is the most common method. We apply concepts from both the top-down and bottom-up approaches to arrive at a viable conclusion.

Regional Market Methodology:

The plastic compounding market was analyzed at a regional level. The globe was divided into North America, Europe, Asia Pacific, Central & South America, and Middle East & Africa, keeping in focus variables like consumption patterns, export-import regulations, consumer expectations, etc. These regions were further divided into twenty-four countries, namely, the U.S.; Canada; Mexico; Germany; the UK; France; Italy; Spain; Netherlands; China; India; Japan; South Korea; Singapore; Malaysia; Indonesia; Thailand; Vietnam; Australia; Brazil; Argentina; Saudi Arabia; United Arab Emirates (UAE); South Africa.

All three above-mentioned market research methodologies were applied to arrive at regional-level conclusions. The regions were then summed up to form the global market.

Plastic compounding market companies & financials:

The plastic compounding market was analyzed via companies operating in the sector. Analyzing these companies and cross-referencing them to the demand equation helped us validate our assumptions and conclusions. Key market players analyzed include:

  • BASF SE: BASF SE, founded in 1865, is headquartered in Ludwigshafen, Germany. The company is engaged in the production of a broad range of products such as petrochemicals, catalysts, nutrition products, coatings, monomers, intermediates, construction chemicals, performance materials & chemicals, dispersions & pigments, crop protection products, and personal care chemicals. It caters its products to various industries including agriculture, automotive & transportation, pharmaceuticals, oil & gas, food & beverages, and construction.

  • SABIC: SABIC was founded in 1976 and is headquartered in Riyadh, Saudi Arabia. The company operates through four business segments, namely petrochemical, specialties, agri-nutrients, and metals. The products manufactured under these segments cater to agriculture, building & construction, automotive, consumer goods, electrical & electronics, healthcare, and packaging industries.

  • Dow, Inc.: Dow, Inc. is a chemical company, established in 2019 post its partition from DuPont. The company operates through three segments, namely industrial intermediates & infrastructure, performance materials & coatings, and packaging & specialty plastics. Products manufactured by the company find applications in various end-use industries including consumer goods, electronics, agriculture, infrastructure, chemical manufacturing, healthcare & hygiene, and more.

  • KRATON CORPORATION: KRATON CORPORATION, established in 1942, is headquartered in Minnesota, U.S. The company was originally a business division of the Shell Oil Company, which developed synthetic styrene-butadiene rubber to serve military vehicle tire applications during the Second World War. The products offered by Kraton Polymers were initially used in footwear production, which later found use in various markets such as adhesives, sealants, coatings, advanced materials, construction (roofing and paving), medical, and pharmaceutical.

  • LyondellBasell Industries Holdings B.V.: LyondellBasell Industries Holdings B.V. was founded in 2007 and is headquartered in Texas, U.S. The company is engaged in the manufacturing of chemicals, fuels, refining products, and plastic polymers. It operates its business through operating segments, namely olefins and polyolefins (Americas); olefins and polyolefins (Europe, Asia, and International); intermediates and derivatives; refining; technology; and advanced polymer solutions.

  • DuPont de Nemours, Inc.: DuPont de Nemours, Inc. was established in 1802 and has corporate headquarters in Delaware, U.S. It is generally known as DuPont and is an industrial chemicals manufacturer. The company is mainly engaged in the production of chemicals and plastics as well as offers solutions for biosciences and energy sector. It was originally a gunpowder mill that diversified into various production sectors and has offices across 90 countries.

  • RTP Company: RTP Company was founded in 1982 and is headquartered in Minnesota, U.S. It is a provider of specialty thermoplastic compounding. The company serves markets including automotive, electrical & electronics, energy, and healthcare. Product portfolio of the company includes color solutions for thermoplastics, conductive, thermoplastic elastomer, flame retardant, high temperature, structural, and wear resistant. As of 2019, the company had an employee base of over 1,700 across its 20 facilities in 17 global locations including Singapore, Shenzhen, Suzhou, Beaune, and Monterrey.

  • S&E Specialty Polymers, LLC: S&E Specialty Polymers, LLC was established in 1992 and has corporate headquarter in Massachusetts, U.S. The company was originally founded as Gitto Global Corp., is a specialty compounds manufacturer. The company changed its name after an M&A agreement in 2005. It produces zero-halogen flame-retardant plastic compounds, low-smoke PVC plenum, and flame-retardant polyolefins among others. These products are used in various applications including automotive, battery, footwear, wire, and cable along with other general applications. The company was acquired by Aurora Plastics in October 2017.

  • Asahi Kasei Corporation: Asahi Kasei Corporation, founded in 1922, is a plastic and advanced material solution provider. The company is headquartered in Tokyo, Japan and is engaged in three business segments including material, homes, and healthcare. Asahi Kasei Corporation manufactures plastic compounds through its U.S. subsidiary, namely Asahi Kasei Plastics North America (APNA). APNA was founded in 2000 and manufactures plastic compounding for various applications in industries such as automotive, furniture, pool & spa, industrial, housing, construction, and others.

  • Covestro AG: Covestro AG was established in 2015 and has corporate headquarters in Leverkusen, Germany. The company is an independent subsidiary of Bayer AG Group, a global producer of high-performance plastics and polymers. It was renamed to Covestro AG from Bayer MaterialScience LLC in September 2014 after a restructuring process. The Bayer AG Group has multiple businesses catering to applications such as pharmaceutical, chemical, consumer healthcare products, agriculture, biotechnology, and veterinary drugs.

Value chain-based sizing & forecasting

Supply Side Estimates

  • Company revenue estimation via referring to annual reports, investor presentations, and Hoover’s.

  • Segment revenue determination via variable analysis and penetration modeling.

  • Competitive benchmarking to identify market leaders and their collective revenue shares.

  • Forecasting via analyzing commercialization rates, pipelines, market initiatives, distribution networks, etc.

Demand side estimates

  • Identifying parent markets and ancillary markets

  • Segment penetration analysis to obtain pertinent

  • revenue/volume

  • Heuristic forecasting with the help of subject matter experts

  • Forecasting via variable analysis

Plastic Compounding Market Report Objectives:

  • Understanding market dynamics (in terms of drivers, restraints, & opportunities) in the countries.

  • Understanding trends & variables in the individual countries & their impact on growth and using analytical tools to provide high-level insights into the market dynamics and the associated growth pattern.

  • Understanding market estimates and forecasts (with the base year as 2023, historic information from 2018 to 2023, and forecast from 2024 to 2030). Regional estimates & forecasts for each category are available and are summed up to form the global market estimates.

Plastic Compounding Market Report Assumptions:

  • The report provides market value for the base year 2023 and a yearly forecast till 2030 in terms of revenue/volume or both. The market for each of the segment outlooks has been provided on region & country basis for the above-mentioned forecast period.

  • The key industry dynamics, major technological trends, and application markets are evaluated to understand their impact on the demand for the forecast period. The growth rates were estimated using correlation, regression, and time-series analysis.

  • We have used the bottom-up approach for market sizing, analyzing key regional markets, dynamics, & trends for various products and end-users. The total market has been estimated by integrating the country markets.

  • All market estimates and forecasts have been validated through primary interviews with the key industry participants.

  • Inflation has not been accounted for to estimate and forecast the market.

  • Numbers may not add up due to rounding off.

  • Europe consists of EU-8, Central & Eastern Europe, along with the Commonwealth of Independent States (CIS).

  • Asia Pacific includes South Asia, East Asia, Southeast Asia, and Oceania (Australia & New Zealand).

  • Latin America includes Central American countries and the South American continent

  • Middle East includes Western Asia (as assigned by the UN Statistics Division) and the African continent.

Primary Research

GVR strives to procure the latest and unique information for reports directly from industry experts, which gives it a competitive edge. Quality is of utmost importance to us, therefore every year we focus on increasing our experts’ panel. Primary interviews are one of the critical steps in identifying recent market trends and scenarios. This process enables us to justify and validate our market estimates and forecasts to our clients. With more than 8,000 reports in our database, we have connected with some key opinion leaders across various domains, including healthcare, technology, consumer goods, and the chemical sector. Our process starts with identifying the right platform for a particular type of report, i.e., emails, LinkedIn, seminars, or telephonic conversation, as every report is unique and requires a differentiated approach.

We send out questionnaires to different experts from various regions/ countries, which is dependent on the following factors:

  • Report/Market scope: If the market study is global, we send questionnaires to industry experts across various regions, including North America, Europe, Asia Pacific, Latin America, and MEA.

  • Market Penetration: If the market is driven by technological advancements, population density, disease prevalence, or other factors, we identify experts and send out questionnaires based on region or country dominance.

The time to start receiving responses from industry experts varies based on how niche or well-penetrated the market is. Our reports include a detailed chapter on the KoL opinion section, which helps our clients understand the perspective of experts already in the market space.

What questions do you have? Get quick response from our industry experts. Request a Free Consultation
gvr icn

GET A FREE SAMPLE

gvr icn

This FREE sample includes data points, ranging from trend analyses to estimates and forecasts. See for yourself.

gvr icn

NEED A CUSTOM REPORT?

We can customize every report - free of charge - including purchasing stand-alone sections or country-level reports, as well as offer affordable discounts for start-ups & universities. Contact us now

Certified Icon

We are GDPR and CCPA compliant! Your transaction & personal information is safe and secure. For more details, please read our privacy policy.