- Home
- »
- Automotive & Transportation
- »
-
Reverse Logistics Market Size And Share Report, 2026-2033GVR Report cover
![Reverse Logistics Market (2026 - 2033)Report]()
Reverse Logistics Market (2026 - 2033)
Size, Share & Trends Analysis Report By Return Type (B2B Returns and Commercial Returns, Repairable Returns), By Service (Transportation, Warehousing), By End User Industry, By Region, And Segment Forecasts
Market Size, 2025
$882.9BMarket Estimate, 2026
$954.9BMarket Forecast, 2033
$3,183.9BCAGR, 2026–2033
18.8%Reverse Logistics Market Summary
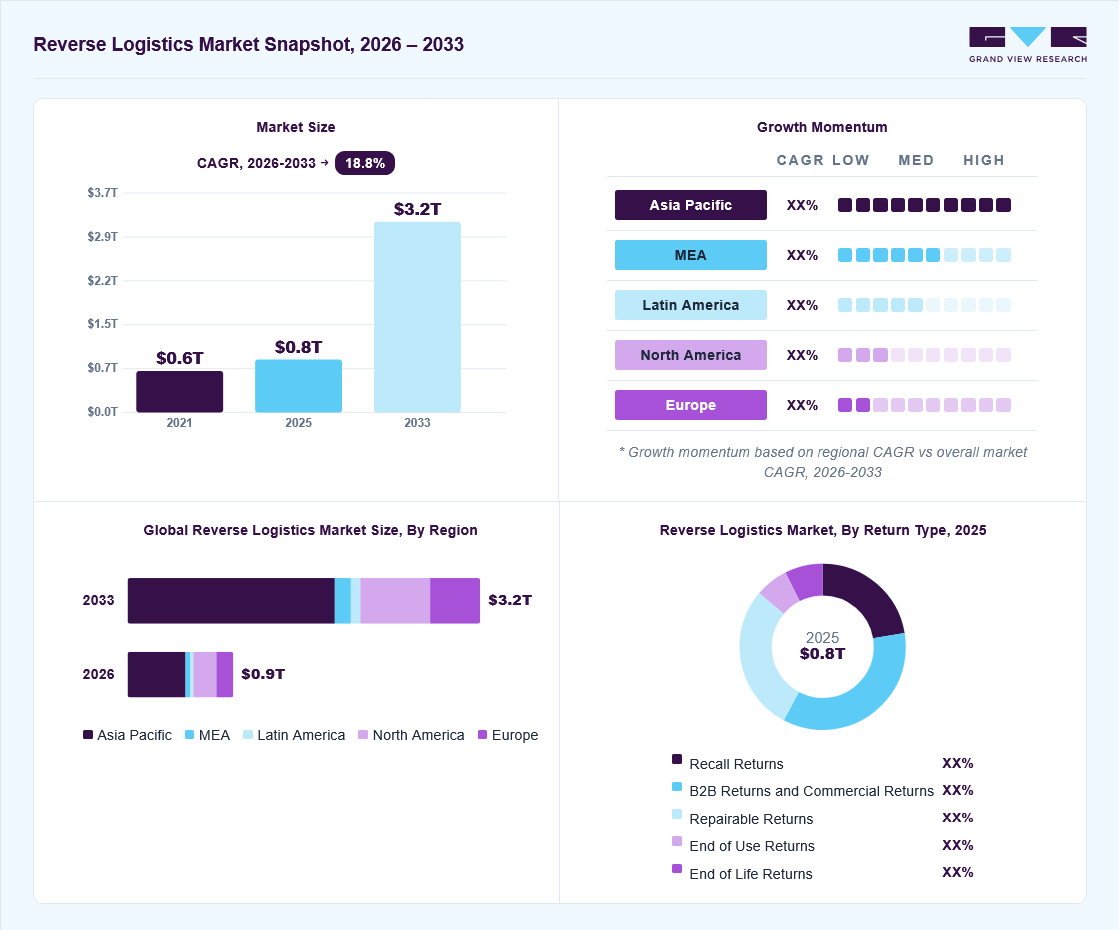
The global reverse logistics market size was valued at USD 882.9 billion in 2025 and is projected to grow from USD 954.9 billion in 2026 to USD 3,183.9 billion by 2033, at a CAGR of 18.8% from 2026 to 2033. Asia Pacific dominated the global market with the largest revenue share of 54.3% in 2025. The global expansion of e-commerce businesses and the increasing frequency of returns and replacements of products have propelled the demand for reverse logistics services.
Key Market Trends & Insights
- By return type: B2B returns and commercial returns segment dominated the market, with a revenue share of 35.4% in 2025.
- By service: Transportation segment held the largest market share of 46.2% in 2025.
- By end user: Retail & e-commerce segment held the largest market share of 51.0% in 2025.
Regional Highlights
- Largest regional market: Asia Pacific (54.3% revenue share, 2025)
- By country: The China held the largest market share in 2025.
Market Size & Forecast
- Market size in 2025: USD 882.9 Billion
- Estimated market size in 2026: USD 954.9 Billion
- Projected market size by 2033: USD 3,183.9 Billion
- CAGR (2026-2033): 18.8%
Increasing product recalls due to strict government rules and product quality standards is expected to boost market growth. The e-commerce service providers emphasize reverse logistics as certain customers prefer to initially analyze the ordered products physically and then decide whether to keep them. If the product is not worth buying, customers can return it with the help of reverse logistics. For instance, buyers can only test clothing after making a purchase decision, especially for online shopping.The increasing use of advanced technologies such as Automation, Robotics, and Augmented Reality has enabled e-commerce companies to excel in efficiency and reachability. An increasing number of consumers prefer online purchasing over in-store purchasing owing to benefits such as convenience, lead time, cost, and variety of choices. E-commerce businesses significantly depend on shipping and warehousing capabilities to transfer products from retailers or manufacturing units to end-users in a shorter lead time.
")
Automation can route customer return requests, create packaging and labeling materials, reduce wait times for returning items to physical stores, and offer customers the option to return orders by mail, among others. Companies can use robotic process automation to contact consumers once the return request is initiated or to complete the return process and audit all operations efficiently. Automation can provide transparency in the return process to ensure that customers remain updated on the process once they raise a request for a return, exchange, or submit a warranty claim. Moreover, it helps in preventing fraud in the returns process.
Market Dynamics
The reverse logistics market is experiencing substantial growth driven by rising e-commerce returns, increasing sustainability initiatives, and growing demand for product recovery and recycling solutions. Businesses are investing in reverse logistics systems to improve return management, recover product value, and strengthen supply chain efficiency. However, operational complexity and high processing costs are expected to hinder the growth of the market. Furthermore, opportunities associated with circular economy practices and technology-enabled reverse logistics platforms are further expected to contribute to the growth of the market.
The growing emphasis on environmental sustainability and circular economy models is significantly driving the reverse logistics market. Organizations are increasingly adopting strategies focused on recycling, refurbishment, remanufacturing, and responsible disposal of products to minimize environmental impact and reduce material waste. Reverse logistics systems support businesses in extending product lifecycles, recovering reusable materials, and improving resource utilization. Governments and regulatory bodies are also implementing stricter environmental regulations and waste management policies, encouraging companies to strengthen product recovery operations. Businesses are recognizing reverse logistics as an important tool for achieving sustainability goals and enhancing corporate environmental responsibility. The rising demand for eco-friendly supply chain practices is driving market growth. Increased consumer preference for sustainable brands and resource-efficient operations is further reinforcing long-term demand for reverse logistics services.
High operational costs could hamper the growth of the reverse logistics market. Reverse logistics processes often involve product collection, transportation, inspection, sorting, repair, refurbishment, recycling, and disposal activities, creating operational complexity across supply chains. Managing unpredictable return volumes, product conditions, and varying customer requirements can increase logistics costs and administrative burden.
In addition, organizations frequently face challenges related to warehouse management, labor requirements, inventory tracking, and transportation coordination. Businesses operating across multiple geographies may encounter additional complexities associated with regulatory compliance and regional logistics infrastructure. These cost and process challenges can limit adoption among organizations with constrained budgets or limited operational capabilities, thereby expected to hinder the growth of the market.
The growing use of digital technologies and automation is creating significant opportunities in the reverse logistics market. Organizations are increasingly implementing technologies such as artificial intelligence, IoT, blockchain, robotics, and data analytics to improve visibility, tracking, and operational efficiency across reverse supply chains. Advanced digital tools help businesses automate return processing, optimize transportation routes, enhance inventory management, and improve decision-making capabilities. Companies are leveraging predictive analytics and real-time monitoring solutions to better manage return volumes and product recovery processes. Technology-enabled reverse logistics systems also support improved customer communication and faster resolution of return-related activities. Vendors offering intelligent, data-driven reverse logistics platforms are expected to gain competitive advantages. Continued technological innovation is expected to contribute to the growth of the market.
Analyst Perspective
The reverse logistics market is becoming an important part of modern supply chain strategies. Companies are using reverse logistics to improve customer satisfaction, inventory efficiency, and product recovery capabilities. Market players are investing in optimized logistics networks, technology-driven operations, and specialized recovery services to strengthen performance. Growing focus on sustainability and product lifecycle management is expected to support growth of the market.
Return Type Insights
Based on return type, the B2B returns and commercial returns segment led the market with the largest revenue share of 35.4% in 2025. B2B returns and commercial returns have experienced significant growth within the realm of reverse logistics. This growth can be attributed to various factors that have influenced the dynamics of the industry. One of the primary drivers behind the rise in B2B returns is the increasing emphasis on sustainability and environmental responsibility. As companies become more aware of their environmental impact, they actively seek ways to reduce waste and adopt sustainable practices. This has led to a greater focus on managing returned products efficiently and responsibly. B2B returns, which involve products being returned from one business to another, have become a critical aspect of reverse logistics as companies strive to minimize their carbon footprint.
The repairable returns segment is expected to grow at a significant CAGR during the forecast period. Repair and return refer to fixing defective merchandise and shipping it back to the buyer. Some clients only desire the repair and return of a damaged item rather than a replacement. If a client does not want the item returned after the repairs are performed, the item can be brought back into circulation; in such cases, the total price of returns is decreased. The rising awareness and emphasis on sustainability have played a significant role in driving the growth of repairable returns. As companies and consumers become more environmentally conscious, minimizing waste and extending the lifecycle of products is greatly desired. Repairable Returns offer a viable solution by allowing returned items to be fixed and put back into circulation, reducing the need for new product manufacturing.
Service Insights
Based on service, the transportation segment led the market with the largest revenue share of 46.2% in 2025. A reliable transportation network offers improved logistics performance, reduced overall operating costs, and fosters better customer service, which is crucial for dealing with product returns. In reverse logistics, transportation refers to transporting and distributing returned or replaced merchandise. The increase in e-commerce and online shopping has led to a surge in the volume of returned products. Therefore, businesses require reliable transportation services to facilitate the movement of these goods from the customer back to the seller or manufacturer. The transportation service segment is crucial in ensuring that returned products are efficiently collected, sorted, and transported to the appropriate locations for further processing.
The warehousing segment is expected to grow at a significant CAGR during the forecast period. Warehousing in reverse logistics refers to storing returns, replacements, end-of-use or end-of-life products, and unsold merchandise. The increase in product returns, particularly in the e-commerce sector, has necessitated the growth of warehousing services in reverse logistics. With the rise of online shopping, customers can return products they are dissatisfied with or that are damaged or faulty. This surge in returns requires efficient warehousing solutions to accommodate the influx of returned goods. Warehouses play a critical role in providing temporary storage and managing the inventory of these products until they are processed, repaired, or disposed of.
End User Industry Insights
Based on end user, the retail & e-commerce segment led the market with the largest revenue share of 51.0% in 2025. The retail and e-commerce end-user industry segment has experienced significant growth within reverse logistics. This segment specifically focuses on managing product returns within the retail and e-commerce sectors. Several factors have contributed to the expansion of this segment. E-commerce has transformed the retail landscape and significantly impacted reverse logistics. With the increasing popularity of online shopping, customers have the convenience of purchasing products remotely. However, this has also led to a higher volume of product returns.

The automotive segment is projected to grow at a significant CAGR of 17.9% over the forecast period. Many stakeholders are impacted by automotive recalls, including car owners, automakers, component manufacturers, franchised dealers, insurers, and government authorities. However, reverse logistics is essential in the automobile sector for several reasons, including legal policies surrounding ecological and environmental issues. In addition, the vehicle manufacturer is responsible for maintaining the product after its useful life has expired due to the composition of ecologically sensitive components in automobiles. Some factors responsible for automotive recalls include emission recalls, electric vehicle battery defects, and electronic component defects. The significance of reverse logistics in the automotive sector increases due to all these factors and the growing awareness of consumers regarding the environment.
Regional Insights
The North America reverse logistics market held a significant revenue share in 2024. The reverse logistics market in the region is driven by the rapid expansion of online retail, rising customer expectations for seamless returns, and the push for more sustainable supply chains. Furthermore, the integration of AI, blockchain, and IoT technologies is helping companies track returns more accurately, reduce turnaround times, and enhance customer satisfaction while controlling operational costs.
U.S. Reverse Logistics Market Trends
The U.S. reverse logistics market held a dominant position in 2024 due to the high volume of e-commerce transactions and growing consumer expectations for hassle-free returns. Major retailers such as Amazon and Walmart have invested heavily in advanced return management systems, automated warehouses, and data analytics to streamline reverse logistics operations.
Europe Reverse Logistics Market Trends
The Europe reverse logistics market was identified as a lucrative region in 2024. The reverse logistics market in Europe is growing steadily, underpinned by stringent environmental regulations, an increasing focus on sustainability, and the rise of e-commerce. The European Union’s circular economy initiatives, such as the Extended Producer Responsibility (EPR) and Waste Electrical and Electronic Equipment (WEEE) directives, are compelling companies to invest in efficient product return, recycling, and reuse systems.
The UK reverse logistics market is expected to grow rapidly in the coming years due to the business's aim to enhance customer satisfaction and comply with environmental regulations such as the Waste Electrical and Electronic Equipment (WEEE) Directive. The surge in online shopping has amplified the volume of returns, leading retailers and logistics firms to adopt tech-enabled solutions, including smart labeling, AI-based return forecasting, and centralized return hubs.
The Germany reverse logistics market held a substantial revenue share in 2024. The growth in the country is driven by strong regulatory enforcement, high environmental awareness, and advanced industrial infrastructure. The country leads in recycling and re-manufacturing practices, with strict laws on packaging and end-of-life product management.
Asia Pacific Reverse Logistics Market Trends
Asia Pacific dominated the global reverse logistics market with the largest revenue share of 54.3% in 2025. The region is anticipated to retain its dominance over the forecast period owing to the growing popularity of fashionable apparel among the young population. The growth is also driven by the high proliferation of the e-commerce industry and the rapid growth of e-commerce activities in countries such as India and China. The growing use of e-commerce results in increasing returns, which is expected to contribute to regional market growth.

Japan reverse logistics market is expected to grow rapidly in the coming years due to its strong culture of recycling, high-quality standards, and technological innovation. The country places significant emphasis on efficient product recovery, particularly in the automotive and electronics sectors, where take-back systems and parts reuse are well-established.
The reverse logistics market in the China held the largest share in the Asia Pacific region in 2025. The growth of the market in the country is attributed to the explosive growth of e-commerce and increasing return rates from online shoppers. Leading platforms such as Alibaba and JD.com have developed sophisticated return and refund systems supported by AI and real-time tracking technologies.
Key Reverse Logistics Company Insights
Some key companies in the reverse logistics market include DB SCHENKER, Deutsche Post AG, FedEx Corporation, Kintetsu World Express, Inc., and others. Organizations are focusing on increasing their customer base to gain a competitive edge in the industry. Therefore, key players are taking several strategic initiatives, such as mergers and acquisitions, and partnerships with other major companies.
-
FedEx Corporation plays a significant role in reverse logistics by providing comprehensive solutions that transform product returns from a cost center into a strategic advantage. Its reverse logistics services encompass returns management, repair, refurbishment, recycling, and disposition management, helping businesses reduce waste, improve efficiency, and recover value from returned goods. FedEx leverages advanced technology platforms such as ReverseLogix RMS to streamline the returns process, enhance communication with customers, and provide real-time business intelligence.
-
DB Schenker is a logistics company actively advancing reverse logistics within the framework of the circular economy. As a diamond member of the Reverse Logistics Association, the company leverages its extensive expertise in returns management, particularly in the electronics sector, where it annually repairs over 2 million devices. DB Schenker has developed a specialized Circular Economy Logistics product line that integrates return initiation, screening, inspection, repair processing, and smart dispositioning into a modular, one-stop solution for customers worldwide. This service supports manufacturers in achieving their environmental, social, and governance (ESG) goals and enhances operational efficiency through consolidated returns management and low-carbon warehousing.
Key Reverse Logistics Companies:
The following are the leading companies in the reverse logistics market. These companies collectively hold the largest market share and dictate industry trends.
- DB SCHENKER (Deutsche Bahn AG)
- Deutsche Post AG
- FedEx Corporation
- Kintetsu World Express, Inc.
- United Parcel Service, Inc.
- Yusen Logistics Co., Ltd.
- RLG Systems AG
- Core Logistic Private Limited
- Safexpress Pvt. Ltd.
- C.H. Robinson Worldwide, Inc.
Competitive Benchmarking
Category
Operating Strategies
Competitive Edge
Weakness
Established Players (DB SCHENKER (Deutsche Bahn AG), Deutsche Post AG, FedEx Corporation, United Parcel Service, Inc. (UPS))
- Mature players focus on expanding integrated reverse logistics capabilities through global transportation networks, warehousing infrastructure, return management solutions, and technology-driven supply chain optimization.
- These providers benefit from strong global logistics networks, diversified service portfolios, advanced operational capabilities, and established enterprise customer relationships. Their large-scale infrastructure, technology integration, and expertise in managing complex supply chains provide a strong competitive advantage in reverse logistics operations.
- Mature players face challenges related to complex multi-regional logistics coordination, regulatory compliance requirements, and fluctuating transportation expenses. Managing large-scale return volumes, sustainability expectations, and evolving customer requirements may increase operational complexity and investment needs.
Emerging Players (RLG Systems AG, Core Logistic Private Limited)
- Emerging players focus on niche reverse logistics services including product take-back programs, recycling management, refurbishment support, waste recovery, and sustainability-driven logistics solutions. These companies emphasize operational flexibility, specialized expertise, and tailored service offerings to strengthen their market presence.
- Their competitive advantage comes from focused domain expertise, customized reverse logistics capabilities, faster service adaptability, and specialized sustainability-oriented operations. Their ability to address industry-specific product recovery and circular economy requirements supports market differentiation.
- Emerging players may encounter challenges related to limited market visibility, smaller operational networks, and resource constraints compared with global logistics leaders. Expanding infrastructure, scaling service capabilities, and competing against established multinational providers may affect growth potential.
Recent Developments
-
In December 2024, RapidShyp formed a partnership with Delhivery to strengthen its reverse logistics capabilities, significantly enhancing its last-mile delivery services across India. Through this collaboration, RapidShyp now offers Delhivery’s express services to 18,700 pin codes, providing e-commerce sellers with a comprehensive, end-to-end logistics solution that includes both outgoing and return shipments. The integration of advanced reverse logistics ensures that businesses can efficiently manage product returns, minimizing operational disruptions and streamlining the entire delivery process.
-
In February 2024, Loop, a returns management platform, launched a suite of new reverse logistics offerings designed to transform retail operations and improve profit margins for merchants and logistics partners. These enhancements include expanded integrations with over 35 third-party logistics providers (3PLs), enabling faster and more transparent returns processing in warehouses.
Reverse Logistics Market Report Scope
Report Attribute
Details
Market size in 2025
USD 882.9 billion
Estimated market size in 2026
USD 954.9 billion
Projected market size by 2033
USD 3,183.9 billion
Growth rate
CAGR of 18.8% from 2026 to 2033
Base year for estimation
2025
Historical data
2021 - 2024
Forecast period
2026 - 2033
Quantitative units
Revenue in USD billion and CAGR from 2026 to 2033
Report coverage
Revenue forecast, company ranking, competitive landscape, growth factors, and trends
Segments covered
Return type, service, end user, region
Regional scope
North America; Europe; Asia Pacific; Latin America; MEA
Country scope
U.S.; Canada; Mexico; Germany; UK; France; China; Japan; India; South Korea; Australia; Brazil; Argentina; GCC; South Africa
Key companies profiled
DB SCHENKER (Deutsche Bahn AG), Deutsche Post AG, FedEx Corporation, Kintetsu World Express, Inc., United Parcel Service, Inc., Yusen Logistics Co., Ltd., RLG Systems AG, Core Logistic Private Limited, Safexpress Pvt. Ltd., C.H. Robinson Worldwide, Inc.
Customization scope
Free report customization (equivalent up to 8 analysts' working days) with purchase. Addition or alteration to country, regional & segment scope.
Pricing and purchase options
Avail customized purchase options to meet your exact research needs. Explore purchase options
Global Reverse Logistics Market Report Segmentation
This report forecasts revenue growth at global, regional, and country levels and provides an analysis of the latest industry trends in each of the sub-segments from 2021 to 2033. For this study, Grand View Research has segmented the global reverse logistics market report based on return type, service, end user industry, and region.

-
Return Type Outlook (Revenue, USD Billion, 2021 - 2033)
-
Recall Returns
-
B2B Returns and Commercial Returns
-
Repairable Returns
-
End of Use Returns
-
End of Life Returns
-
-
Service Outlook (Revenue, USD Billion, 2021 - 2033)
-
Transportation
-
Warehousing
-
Reselling
-
Replacement Management
-
Refund Management
-
Others
-
-
End User Industry Outlook (Revenue, USD Billion, 2021 - 2033)
-
Retail & E-commerce
-
Clothing
-
Electronic Devices
-
Footwear
-
Home Décor
-
Others
-
-
Automotive
-
Spare Parts
-
Lubricants
-
Vehicle Accessories
-
-
Consumer Electronics
-
Refrigerator
-
Television
-
Air-Conditioner
-
Grinder
-
Others
-
-
Healthcare
-
Medicine
-
Personal Care Products
-
-
Others
-
-
Regional Outlook (Revenue, USD Billion, 2021 - 2033)
-
North America
-
U.S.
-
Canada
-
Mexico
-
-
Europe
-
Germany
-
UK
-
France
-
-
Asia Pacific
-
China
-
Japan
-
India
-
South Korea
-
Australia
-
-
Latin America
-
Brazil
-
Argentina
-
-
Middle East and Africa (MEA)
-
GCC
-
South Africa
-
-
Research Methodology
Segment Definition
Segment - Return Type
Revenue capture definition
Recall Returns
When a manufacturer or consumer advocacy group discovers defects in a product that could impair its performance, harm its consumers, or raise legal difficulties for the producer, a request to return or replace the items is issued, which is known as a product recall.
B2B Returns and Commercial Returns
B2B returns and Commercial returns are products returned to the manufacturer by the retailer. If the goods are defective or damaged, it is usually returned in bulk quantity.
Repairable Returns
Repair and return refer to the process of repairing defective merchandise and returning it to the buyer. In this type of return, the product is thoroughly examined, repaired, and then released into circulation.
End of Use Returns
The End of Use Return focuses on items or products that the customer only requires temporarily. The merchandise may be leased, rented, or temporarily supplied under the control of the recipient.
End of Life Returns
End-of-life returns program is used to remove older, out-of-date products from the primary sales channel in order to make place for new models. End-of-life returns enable the producer to keep the most recent things on the market while ensuring that older versions are pulled off in a planned manner.
Segment - Service
Revenue capture definition
Transportation
The most crucial component of any logistics supply chain is the transportation system. Transportation in reverse logistics refers to the transportation and distribution of returned or replaced products.
Warehousing
In reverse logistics, warehousing refers to the storage of replacements, returns, end-of-use or end-of-life products, as well as unsold merchandise.
Reselling
Many organizations use the reverse logistics strategy of reselling products to extract the residual value from current inventory that would otherwise have reached the end of its useful life.
Replacement Management
Replacement management refers to the process of replacing a defective product after receiving it at the warehouse.
Refund Management
Refund management refers to handling the reimbursement of the products received from the customer. The retailer chooses what to do with the inventory after the returned item is received.
Others
The other service segment includes repair management, recycling management, disposal & waste management, warranty management, among others.
Segment - End User
Revenue capture definition
Retail & E-commerce
Reverse logistics plays an important role in the e-commerce industry by helping it replace and resell products and aiding in transportation activities. The retail and e-commerce segment is further divided into clothing, electronic devices, footwear, home decor, and others.
Automotive
Many stakeholders are impacted by automotive recalls, including car owners, automakers, component manufacturers, franchised dealers, insurers, and government authorities. Some of the factors responsible for automotive recalls include emission recalls, electric vehicle battery defects, and electronic component defects. The automotive segment is further segmented into spare parts, lubricants, and vehicle accessories.
Consumer Electronics
Products and parts within the consumer goods industry as a whole could be returned for repair, refurbishment, remanufacture, or disposal through various channels for a variety of causes and in diverse conditions. The consumer electronics segment is further divided into refrigerators, televisions, air conditioners, grinders, and others.
Healthcare
Medical devices are returned due to ineffective inventory management, the complexity of the equipment, and varying machine technology. The healthcare segment is further divided into medicine, personal care products, and others.
Others
The others segment includes aerospace & defense, telecommunication, chemical, oil & gas, among others.
Estimation Model
Layer
Key Question
Description
Outcome
Product Return & Recovery Base
Who generates returns and potentially requires reverse logistics solutions?
Establishes total potential demand by identifying industries and businesses generating returned, damaged, excess, recalled, recyclable, or end-of-life products across sectors such as retail, e-commerce, electronics, automotive, and healthcare.
Defines total potential demand.
Addressable Market Layer
Who can realistically be reached and served by reverse logistics providers?
Refines the total business ecosystem into the realistically serviceable market by considering factors such as logistics infrastructure availability, regulatory compliance requirements, sustainability initiatives, digital readiness, geographic coverage, and operational outsourcing preferences.
Defines the serviceable market.
Reverse Logistics Adoption & Processing Layer
Who is actively utilizing, expanding, or optimizing reverse logistics operations?
Estimates annual demand generation by analyzing reverse logistics adoption rates, product return frequency, refurbishment and recycling activities, repair and remanufacturing requirements, inventory recovery practices, and service utilization across industries.
Identifies active demand generation.
Monetisation Layer
How much revenue is generated from reverse logistics demand?
Converts operational demand into market revenue by applying service pricing models, processing costs, refurbishment and recycling revenues, and provider pricing structures.
Derives total market revenue.
Delivered Customizations
This report has been delivered with the following In-depth customizations
CLIENT REQUEST
CUSTOMIZATION DELIVERED
VALUE ADDS
Regional & Country Opportunity Analysis
Delivered region-wise and country-wise market sizing, forecasts, and growth analysis across North America, Europe, Asia Pacific, Latin America, and Middle East & Africa
Assessment of e-commerce growth, sustainability regulations, and supply chain maturity across countries
Identification of high-growth markets and emerging reverse logistics demand hubsSupported regional expansion and market entry planning
Enabled geographic opportunity assessment
Assisted in identifying emerging growth regionsE-commerce Trends Analysis
Delivered analysis of e-commerce growth trends and their impact on reverse logistics demand across retail, apparel, electronics, and consumer goods sectors
Assessment of online return rates, omnichannel retail strategies, same-day returns, and customer return behavior influencing reverse logistics operations
Evaluation of trends such as free returns, flexible return policies, cross-border e-commerce, recommerce, and sustainability-driven returns managementEnabled understanding of e-commerce-driven reverse logistics demand patterns
Supported strategic planning for returns management and fulfillment optimization
Assisted in identifying high-growth online retail opportunities and emerging operational requirementsCompetitive Benchmarking & Strategic Landscape Analysis
Delivered benchmarking of major reverse logistics providers based on service portfolio, technology capabilities, geographic presence, partnerships, pricing, and sustainability initiatives
Analysis of mergers & acquisitions, strategic collaborations, and innovation trendsSupported competitive intelligence and market positioning strategies
Enabled identification of market gaps and expansion opportunities
Assisted in strengthening strategic decision-makingFrequently Asked Questions About This Report
Some key players operating in the reverse logistics market include DB SCHENKER (Deutsche Bahn AG); Deutsche Post AG; FedEx Corporation; Kintetsu World Express, Inc.; United Parcel Service, Inc.; Yusen Logistics Co., Ltd.; RLG Systems AG; Core Logistic Private Limited; Safexpress Pvt. Ltd.; C.H. Robinson Worldwide, Inc.
Key factors that are driving the reverse logistics market growth include the increasing adoption of reverse logistics by numerous companies, rising awareness of the benefits of reverse logistics, and growing awareness towards the environment.
The global reverse logistics market size was estimated at USD 882.9 billion in 2025 and is expected to reach USD 954.9 billion in 2026.
The global reverse logistics market is expected to grow at a compound annual growth rate of 18.8% from 2026 to 2033 to reach USD 3,183.9 billion by 2033.
The Asia Pacific dominated the reverse logistics market with a share of 54.3% in 2025 and is the fastest-growing region. This is attributable to the growing use of e-commerce and the rising demand for reverse logistics for electric vehicles.
Based on return type, the B2B returns and commercial returns segment led the market with the largest revenue share of 35.4% in 2025 and is the fastest-growing return type.
Based on service, the transportation segment led the market with the largest revenue share of 46.2% in 2025 and is the fastest-growing service.
Based on end user, the retail & e-commerce segment led the market with the largest revenue share of 51.0% in 2025 and is the fastest-growing region.
The North America reverse logistics market is expected to grow at a CAGR of 17.2% over the forecast period.
About the Author(s)
Automotive & Transportation Research Team
Technology · Automotive & TransportationThis report was authored by the automotive & transportation research team at Grand View Research - comprising two research analysts, one senior research analyst, and one industry expert - with specialized expertise in the automotive & transportation segment of the technology industry. All findings are based on proprietary technology databases, executive interviews, and regulatory analysis, subject to internal peer review prior to publication.
Last Updated:
Speak to Analyst


Need a Tailored Report?
Customize this report to your needs — add regions, segments, or data points, with 20% free customization.
Or view our licence options:

ISO 9001:2015 & 27001:2022 Certified
We are GDPR and CCPA compliant! Your transaction & personal information is safe and secure. For more details, please read our privacy policy.


