- Home
- »
- Next Generation Technologies
- »
-
Semantic Knowledge Graphing Market Report, 2023-2030GVR Report cover
![Semantic Knowledge Graphing Market (2023 - 2030)Report]()
Semantic Knowledge Graphing Market (2023 - 2030)
Size, Share & Trends Analysis Report By Data Source, By Knowledge Graph Type, By Task Type, By Application, By Organization Size, By Industry Vertical, By Region, And Segment Forecasts
Market Size, 2022
$1.3BMarket Estimate, 2026
$2.1BMarket Forecast, 2030
$3.7BCAGR, 2023–2030
14.2%Market Size & Trends
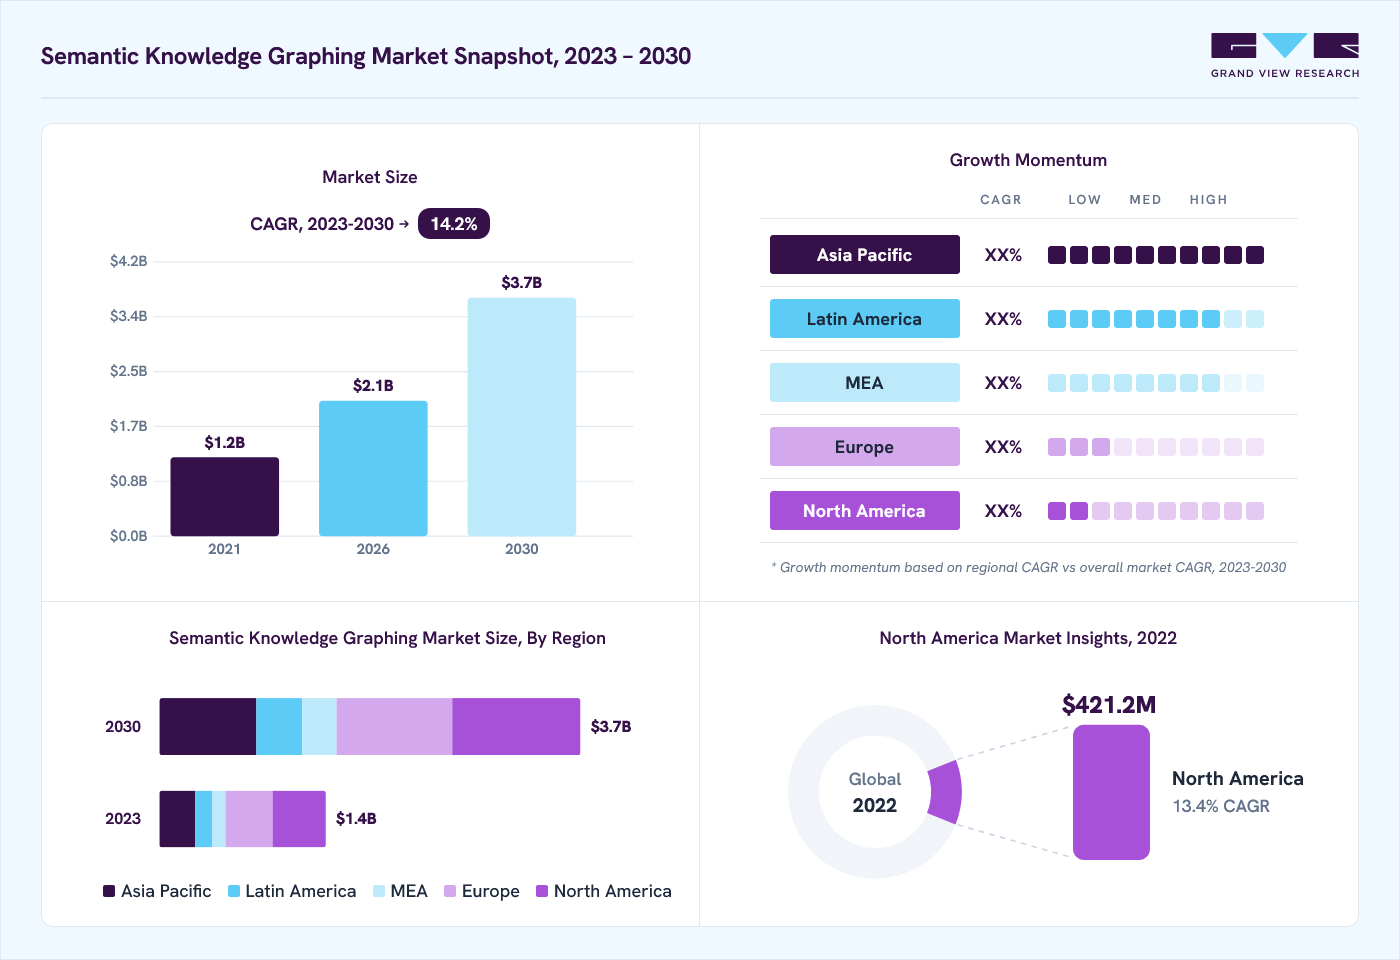
The global semantic knowledge graphing market size was valued at USD 1.3 billion in 2022 and is projected to grow from USD 2.1 billion in 2026 to USD 3.7 billion by 2030, at a CAGR of 14.2% from 2023 to 2030. North America dominated the market, accounting for a revenue share of 32.2% in 2022. The growth of the market is driven by the need for organizations to effectively manage and extract insights from large and complex datasets, as well as the increasing demand for personalized experiences and the need for interoperability and data sharing across different systems. Moreover, the market has applications across various verticals, including healthcare, media and entertainment, financial services, e-commerce, and manufacturing, where semantic knowledge graphing technologies are being used to improve efficiency, reduce costs, and deliver personalized experiences to users.
With the proliferation of data from various sources such as social media, IoT devices, and other digital sources, organizations need help managing, analyzing, and making sense of the huge amounts of data they have. Semantic knowledge graphs help organize and structure this data, making searching, discovering, and extracting insights easier. Moreover, as AI and machine learning technologies continue to advance, there is a growing need for structured data that can be easily integrated into these systems. Semantic knowledge graphs provide a structured and organized representation of data, which can be used to train machine learning models and improve AI capabilities.

The growing traffic on the internet is expected to boost the semantic knowledge graphing market. As more and more people and devices are connected to the internet, the amount of data generated is increasing exponentially. This data is often unstructured and difficult to manage, making it challenging for organizations to extract insights and make informed decisions. Semantic knowledge graphs can help address this challenge by providing a structured and organized representation of data. Using semantic technologies, data can be transformed into a graph-like structure showing relationships and connections between different data points. This makes discovering insights, analyzing data, and making decisions easier.
Furthermore, as the amount of data on the internet grows, there is an increasing need for personalized experiences and tailored recommendations. Semantic knowledge graphs help create a unified view of the user by combining data from different sources, such as browsing history, social media activity, and purchase history. This can deliver personalized recommendations, targeted marketing messages, and other customized experiences. In addition, the rise of the Internet of Things (IoT) is expected to drive the adoption of semantic knowledge graphs. As more and more devices become connected to the internet, there is a growing need for technologies that can help manage and analyze the data generated by these devices. Semantic knowledge graphs can provide a way to integrate and analyze data from different IoT devices, making it possible to extract insights and make informed decisions.
Data Source Insights
The unstructured segment dominates the market with a revenue share of 48.1% in 2022. The key trend in the unstructured segment of the market is the use of natural language processing (NLP) to extract meaning and context from unstructured data sources. The segment growth factor is the growing need to integrate unstructured data sources such as text, images, and video with big data platforms to gain deeper insights into customer behavior, market trends, and other critical business metrics. Moreover, machine learning algorithms are being used to improve the accuracy of knowledge graphs by identifying patterns and relationships within unstructured data sources.
The structured segment of the market is experiencing strong growth, driven by the adoption of open standards, integration with machine learning and AI, and the growth of graph databases. The focus on data governance and security is also becoming increasingly important as structured knowledge graphs expand to store sensitive data. The structured segment of the market is focused on developing and deploying structured data models that capture and organize data in a way that enables more efficient processing and analysis. The use of open standards such as RDF (Resource Description Framework) and OWL (Web Ontology Language) enables the interoperability and integration of structured data across different applications and platforms.
Knowledge Graph Type Insights
The Context-rich knowledge graphs segment dominates the market with a revenue share of 40.6% in 2022. Context-rich knowledge graphs are used to integrate and analyze data from IoT devices and sensors, enabling more sophisticated insights into complex systems and environments. The segment is experiencing strong growth, driven by integrating IoT and sensor data, focusing on industry-specific use cases, and using natural language processing and machine learning. The emphasis on explainability is also becoming increasingly important as context-rich knowledge graphs expand to more complex and sensitive domains.
The NLP (natural language processing) knowledge graphs segment is experiencing strong growth during the forecasted period, driven by the integration with conversational AI, the emphasis on multilingual support, and deep learning techniques. The segment focuses on developing knowledge graphs that use NLP techniques to extract and represent knowledge from natural language text. NLP knowledge graphs are used to power conversational AI interfaces such as chatbots and virtual assistants, enabling more natural and intuitive user interactions. NLP knowledge graphs are being developed for specific domains, such as healthcare, finance, and legal, to enable more accurate and efficient processing of domain-specific text.
Task Type Insights
The Link prediction segment leads the market with a revenue share of 41.7% in 2022. The semantic knowledge graphing market's link prediction segment focuses on developing algorithms and models that can predict missing or potential relationships between entities in a knowledge graph. As link prediction models become more sophisticated, there is a growing emphasis on ensuring that they are transparent and explainable so that users can understand how predictions are made. These models are being developed to take into account contextual information, such as time, location, and user behavior, to enable more accurate predictions of future relationships.
Link-based clustering refers to grouping nodes in a semantic knowledge graph based on the links between them. This type of clustering is useful for identifying groups of related concepts and can help uncover new data insights and patterns. Link-based clustering can be combined with other technologies, such as natural language processing and image recognition, to create more sophisticated knowledge graphs. For example, a knowledge graph incorporating text and image data could be used to identify visual patterns and relationships. The segment has the potential to be applied across a wide range of industries, including finance, healthcare, and retail.
Application Insights
The semantic search segment dominates the market, with a revenue share of 28.6% in 2022. As more businesses adopt conversational interfaces such as chatbots and voice assistants, there will be a growing need for semantic search technology to power these interactions. This will drive demand for semantic search solutions that accurately interpret natural language queries and return relevant results. Semantic search is not limited to web search engines. It can also be used in enterprise search, e-commerce search, and other applications where users need to find relevant information quickly. As more businesses adopt semantic search technology, we can expect to see it being applied in new and innovative ways.
The information retrieval segment of the market focuses on the ability to retrieve relevant information from a large corpus of data. As more businesses adopt semantic knowledge graphs to organize and represent their data, there will be an increased need for information retrieval solutions to query and retrieve information from these graphs effectively. Moreover, Context-aware retrieval involves understanding the context in which a user is searching and tailoring the results accordingly. This requires a deep understanding of the relationships between entities in a knowledge graph and is projected to see more information retrieval solutions that leverage this type of context awareness.
Organization Size Insights
The Large Organizations segment dominates the market with a revenue share of 73.4% in 2022. Large organizations are increasingly adopting knowledge graphs to manage their data across the entire enterprise. This allows for a more holistic view of the organization's data and enables more powerful analytics and decision-making. Vendors are developing solutions that integrate with existing data systems. This includes connectors for popular databases, data warehouses, and other data storage systems to make it easier for large organizations to adopt knowledge graphs. Moreover, by adopting a semantic knowledge graph, a large organization can increase its focus on data governance and security; this factor is attributed to the increase in the market size.
The small and medium-sized enterprises (SMEs) segment is expected to grow with the fastest CAGR of 15.7%. SMEs increasingly adopt semantic knowledge graphs to manage their data and gain insights from it. This is partly due to the availability of cloud-based solutions that are more affordable and easier to use than on-premise solutions. Moreover, SMEs typically have fewer resources than large organizations; vendors are developing solutions that are more user-friendly and accessible for non-technical users. This includes features like drag-and-drop interfaces, pre-built templates, and integrations with popular data visualization tools.
Industry Verticals Insights
The BFSI segment dominates the market, with a revenue share of 23.6% in 2022. The BFSI sector uses semantic knowledge graphs to personalize the customer experience by analyzing customer data and creating targeted marketing campaigns. Knowledge graphs can also be used to analyze customer behavior and preferences, helping financial institutions to tailor their services to the needs of individual customers. Moreover, knowledge graphs can help banks and financial institutions detect and prevent fraud more effectively by analyzing vast amounts of data from multiple sources and identifying patterns and relationships that may indicate fraudulent activity.

The IT and telecom segment is expected to grow with the fastest CAGR of 14.7% from 2023 to 2030, owing to the increasing use of Semantic knowledge graphs to improve cybersecurity by analyzing vast amounts of data and identifying potential threats. Knowledge graphs can help detect anomalies in network traffic and identify patterns that may indicate a cybersecurity threat. The industry uses semantic knowledge graphs to perform predictive maintenance on IT and telecom infrastructure. By analyzing data from sensors and other sources, knowledge graphs can predict when equipment is likely to fail, allowing companies to perform maintenance before a failure occurs.
Regional Insights
North America dominated the market with a revenue share of 32.2% in 2022. North America is the largest market for semantic knowledge graphs, driven by the high level of investment in semantic knowledge graphs, particularly in the healthcare and life sciences industries. The United States was the region's largest market for semantic knowledge graphs, and many companies were investing in developing solutions to improve data interoperability and analytics. There was also significant investment in semantic knowledge graphs, particularly in the areas of smart cities and the Internet of Things (IoT). The European Union was funding several initiatives related to semantic technologies, including the Big Data Value Association and the European Data Science Academy.

The Asia Pacific region is expected to grow with the fastest CAGR of 16.4% from 2023 to 2030. The regional market is likely to witness a significant gain in revenue share over the forecast period due to growing interest in semantic knowledge graphs, particularly in countries like China and India. These countries were investing in developing their semantic technologies and increasingly using open-source solutions. The semantic knowledge graphs market was expected to grow significantly in the coming years, driven by factors such as the increasing need for data integration and analytics, the rise of big data, and the growing adoption of artificial intelligence and machine learning technologies.
Key Companies & Market Share Insights
The market is characterized by strong competition, with a few major worldwide competitors owning a significant market share. The major focus is developing new products and collaborating among the key players. For instance, in October 2022, Amazon Web Services launched Amazon Neptune, a graph database service specifically designed to store and process large-scale connected datasets. It uses semantic technologies to build knowledge graphs and enables users to query and analyze the data easily. Some of the prominent players in the global semantic knowledge graphing market include:
-
Amazon.com Inc.
-
Baidu, Inc.
-
Facebook Inc
-
Google LLC
-
Microsoft Corporation
-
Mitsubishi Electric Corporation
-
NELL
-
Semantic Web Company
-
YAGO
-
Yandex
Semantics Knowledge Graphing Market Report Scope
Report Attribute
Details
Market size in 2022
USD 1.3 billion
Estimated market size in 2026
USD 2.1 billion
Projected market size by 2030
USD 3.7 billion
Growth rate
CAGR of 14.2% from 2023 to 2030
Base year for estimation
2022
Historical data
2017 - 2021
Forecast period
2023 - 2030
Quantitative units
Revenue in USD million and CAGR from 2023 to 2030
Report coverage
Revenue forecast, company ranking, competitive landscape, growth factors, and trends
Segments covered
Data Source, knowledge graph type, task type, application, organization size, industry vertical, regional
Regional scope
North America; Europe; Asia Pacific; South America; MEA
Country scope
U.S.; Canada; UK; Germany; France; China; India; Japan; South Korea; Australia; Brazil; Mexico; KSA; UAE; South Africa
Key companies profiled
Amazon.com Inc.; Baidu, Inc.; Facebook Inc; Google LLC; Microsoft Corporation; Mitsubishi Electric Corporation; NELL; Semantic Web Company; YAGO; Yandex.
Customization scope
Free report customization (equivalent up to 8 analysts working days) with purchase. Addition or alteration to country, regional, and segment scope.
Pricing and purchase options
Avail customized purchase options to meet your exact research needs. Explore purchase options
Global Semantic Knowledge Graphing Market Report Segmentation
This report forecasts revenue growth on global, regional, and country levels and provides an analysis of the industry trends in each of the sub-segments from 2017 to 2030. For this study, Grand View Research has segmented the global semantic knowledge graphing market report based on data source, knowledge graph type, task type, application, organization size, industry vertical, and region:
-
Data Source Outlook (Revenue, USD Million; 2017 - 2030)
-
Structured
-
Unstructured
-
Semi-structured
-
-
Knowledge Graph Type Outlook (Revenue, USD Million; 2017 - 2030)
-
Context-rich Knowledge Graphs
-
External-sensing Knowledge Graphs
-
NLP Knowledge Graphs
-
-
Task Type Outlook (Revenue, USD Million; 2017 - 2030)
-
Link Prediction
-
Entity Resolution
-
Link-based Clustering
-
-
Application Outlook (Revenue, USD Million; 2017 - 2030)
-
Semantic Search
-
QnA Machines
-
Information Retrieval
-
Electronic Reading
-
Others
-
-
Organization Size Outlook (Revenue, USD Million; 2017 - 2030)
-
SMEs
-
Large Organizations
-
-
Industry Vertical Outlook (Revenue, USD Million; 2017 - 2030)
-
BFSI
-
Healthcare
-
IT & Telecom
-
Retail & E-commerce
-
Government
-
Others
-
-
Regional Outlook (Revenue, USD Million; 2017 - 2030)
-
North America
-
U.S.
-
Canada
-
-
Europe
-
U.K.
-
Germany
-
France
-
-
Asia Pacific
-
China
-
India
-
Japan
-
South Korea
-
Australia
-
-
South America
-
Brazil
-
Mexico
-
-
Middle East and Africa
-
KSA
-
UAE
-
South Africa
-
-
Frequently Asked Questions About This Report
The global semantic knowledge graphing market size was valued at USD 1.3 billion in 2022 and is estimated at USD 2.1 billion for 2026.
The global semantic knowledge graphing market is expected to grow at a CAGR of 14.2% from 2023 to 2030, reaching USD 3.7 billion by 2030.
North America dominated with a revenue share of 32.2% in 2022.
Some key players operating in the Semantic Knowledge Graphing market include Amazon.com Inc., Baidu, Inc., Facebook Inc. Google LLC, Microsoft Corporation, Mitsubishi Electric Corporation, NELL, Semantic Web Company, YAGO, Yandex
Key factors driving the Semantic Knowledge Graphing market growth is driven by the need for organizations to effectively manage and extract insights from large and complex datasets, as well as the increasing demand for personalized experiences and the need for interoperability and data sharing across different systems.
About the Author(s)
Next Generation Technologies Research Team
Technology · Next Generation TechnologiesThis report was authored by the next generation technologies research team at Grand View Research - comprising two research analysts, one senior research analyst, and one industry expert - with specialized expertise in the next generation technologies segment of the technology industry. All findings are based on proprietary technology databases, executive interviews, and regulatory analysis, subject to internal peer review prior to publication.
Last Updated:
Speak to Analyst -


Need a Tailored Report?
Customize this report to your needs — add regions, segments, or data points, with 20% free customization.
Or view our licence options:

ISO 9001:2015 & 27001:2022 Certified
We are GDPR and CCPA compliant! Your transaction & personal information is safe and secure. For more details, please read our privacy policy.


