- Home
- »
- Reports
- »
-
Fleet Management Cost and Supplier Intelligence Report, 2030
![Fleet Management Cost and Supplier Intelligence Report, 2030]()
Fleet Management Procurement Intelligence Report, 2023 - 2030 (Revenue Forecast, Supplier Ranking & Matrix, Emerging Technologies, Pricing Models, Cost Structure, Engagement & Operating Model, Competitive Landscape)
- Published Date: Oct, 2023
- Base Year for Estimate: 2022
- Report ID: GVR-P-10551
- Format: Electronic (PDF)
- Historical Data: 2020 - 2021
- Number of Pages: 60
Category Overview
“Rising emphasis on the operational efficiency of the fleets is fueling the growth of the category.”
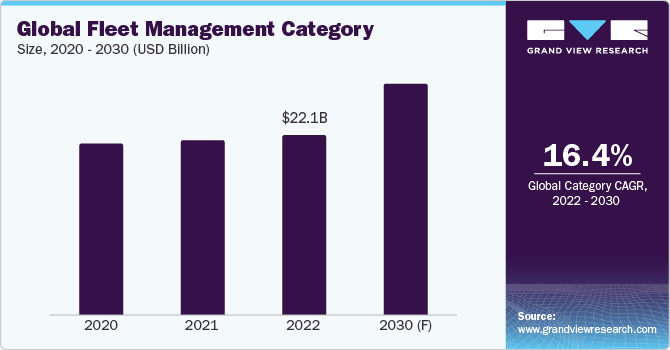
The global fleet management category is anticipated to witness growth at a CAGR of 16.4% from 2023 to 2030. The growth is supplemented by factors such as increased requirements for efficient fleet operations to ensure reduced operating costs, continuous development of fleet management technologies, rising concern for driver safety, and challenges met by business enterprises to comply with the regulations laid out by the governments.
Fleet management finds applications in the government sector, public transport, utilities, retail, logistics, construction, mining, chemicals, oil & gas chemicals, academia, waste management, and service sector. It covers the management of all types of vehicles such as trams & buses, commercial & freighter aircraft, light goods vehicles, rail & cruise ships, corporate fleets, container ships, and trailers & trucks.
Services offered by the industry players comprise new vehicle selection, leasing/financing, registration & delivery, repair, maintenance & tires, insurance, fuel management, driver support, vehicle tracking and communications, contract management, vehicle remarketing, and telematics. In addition, since the market players carry the experience of managing a large number of vehicles, they can support the businesses with lowered prices due to economies of scale and better negotiability with the OEMs and other service providers.
The global fleet management category size was estimated at USD 22.1 billion in 2022. This category has been witnessing a rise in the number of opportunities due to increased demand from the transportation and logistics sector and the benefits offered in terms of fleet planning, scheduling, routing, etc. It not only streamlines the entire fleet operations but also leads to the satisfaction of the customers. Also, growth opportunities for the market players include urging businesses to outsource their non-core activities like fleet management and growing their market penetration by taking over significant clients held by rivals and gaining new clientele, including government fleets.
However, rising compliance standards, lowered data integrity, reduced flexibility, transparency, follow-ups, and rising efficiency might act as hindrances in the growth of the category if not addressed at the appropriate moment. These challenges can be resolved through managerial involvement, effective coaching, employee engagement, and risk awareness. In addition, it can be handled in a better way by involving management, providing appropriate coaching, motivating employees, and being aware of risk.
Key players in the market have begun to benefit from digitization by providing improved driver-vehicle communications and vehicle-to-infrastructure connectivity solutions. In addition to the services, the players offer technological solutions such as telematics which are integrated with machine learning (to avoid potential collisions and warn drivers who may be at risk, using predictive analytics), artificial intelligence (for gathering and studying current information about the whereabouts, status, and motion of vehicles), cloud computing (to store enormous amount of fleet data), big data analytics (to support fleet operators in mining operational insights), and GPS.
Supplier Intelligence
“What best describes the nature of the fleet management category? Who are some of the main participants?”
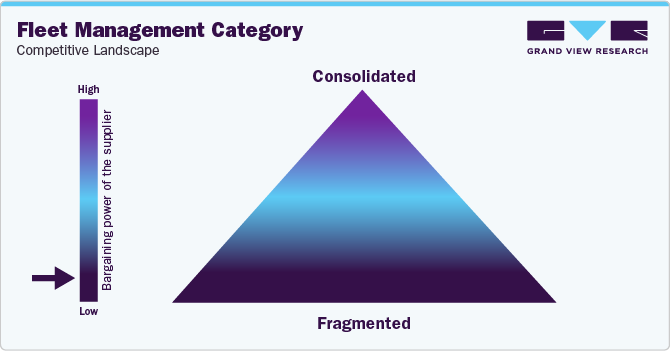
The global fleet management category features a highly fragmented competitive landscape, with the presence of several regional and global market players. In addition, these players are working continuously to expand their service portfolio and scale to stay competitive by getting an edge over the others. Furthermore, players in the market are forming strategic alliances, mergers, and acquisitions with other automakers to offer competitive fleet management services and solutions.
Market players possess low negotiation capability as there is high competition and the businesses who are planning to outsource their fleet management process may easily switch to a different supplier based on the price and the service offerings. In addition, the competitive rivalry is high in the industry in terms of both services and products which forces the players to keep the prices low.
Fleet management companies (FMCs) also play a vital role in promoting higher adoption of electric vehicles for commercial or passenger fleets to reduce and control harmful emissions that take place from internal combustion engine (ICE) vehicles. For instance, ALD Automotive is helping its clients to improve their fleet's emissions profile for both air quality and climate change purposes by offering assistance on the selection of the right powertrain technology and supporting them in their electrification journey.
Key suppliers covered in the category
-
ALD SA (ALD International)
-
Arval Service Lease
-
Donlen LLC
-
Element Fleet Management Corp.
-
Ewald Fleet Solutions
-
Executive Trust Limited (Europcar Ireland)
-
Holman, Inc.
-
Mike Albert Leasing, Inc.
-
Mobilease, LLC
-
ORIX Corporation
-
The Hertz Corporation
-
Wheels, LLC
Pricing and Cost Intelligence
“What is the total cost of ownership for fleet management? What variables affect service prices?”
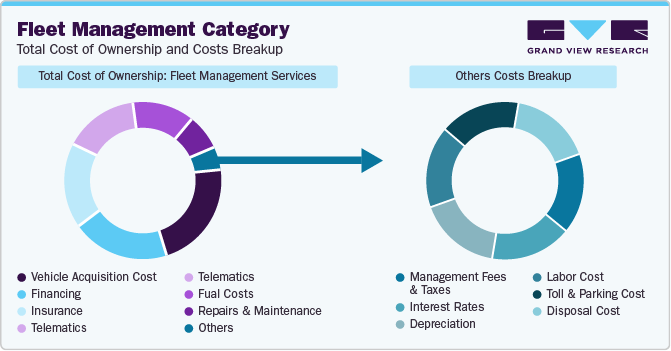
Vehicle acquisition cost, financing, insurance, telematics, fuel costs, and repair & maintenance are the key cost components in the fleet management category. Other costs can be further bifurcated into management fees & taxes, interest rates, depreciation, labor costs, toll & parking costs, and disposal costs.
The cost of buying/acquiring a vehicle, also known as the acquisition cost, is the largest cost for any fleet operator. This includes not just the cost of purchasing or leasing the car, but also the expense of obtaining the funds to do so. If an operator makes an outright purchase, it must understand how much the capital outlay will cost the company if the funds are obtained from a lender. If the vehicle is leased, the operator must comprehend the tax benefits–or drawbacks–of that strategy over the life of the fleet.
Expenses in the fleet are classified as either fixed or variable. Expenses that are fixed, such as depreciation, licenses, tax, and insurance are the ones that are unaffected by use and remain consistent. Whereas variable expenses typically cover operating expenses such as tolls, parking, maintenance, etc., can change depending on a number of factors. It's essential to keep variable costs under control to raise profitability.
As per a recent survey conducted on over 1,750 global fleet operators, even though the continuous rise in the prices of fuel across the globe is a major concern for the operators in the fleet management sector, converting the fuel and transitioning to electric vehicles is a challenging task. The key challenges faced by the operators include supply chain pressure (about the availability of vehicles and fleet management equipment) due to the disruption caused by the COVID-19 pandemic and increasing fuel expenses.
In addition, fleet operators are adopting driver performance metrics to reward and retain their top drivers, citing enhanced safety and decreased operational costs as important benefits of driver performance monitoring. The players in the category follow cost-plus pricing and fixed pricing models wherein the prices can be set for the number of services that are being utilized every month.
The cost structure is broken down in the accompanying chart. Other costs can depend on multiple cost components, which have been illustrated below:
Sourcing Intelligence
“How do fleet management companies engage with their suppliers? What is the type of engagement model?”
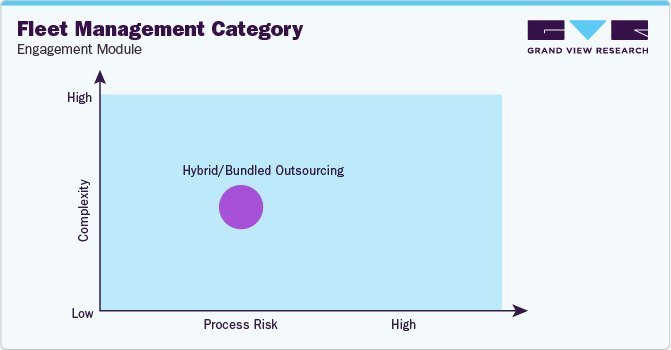
Fleet management companies typically follow a hybrid outsourcing model to engage with their suppliers. Market players need to depend on outsourcing for numerous activities such as maintenance, vehicle funding, driver support & training, vehicle sourcing, vehicle tracking & communications, driver requirements such as license checking, breakdown & recovery of vehicles, parking & fines administration, FMS, and fleet administration.
Key players in the industry depend on outsourced maintenance automation in FMS. It assists enterprise fleets in reducing shop delays and driver wait times, and managers may set automatic cost and/or service item approval thresholds to speed up the process even further. In addition, outsourcing of fleet vehicle maintenance is also preferred to ensure uptime. Out-of-route miles and downtimes are costly and time-consuming, and they can be avoided by hiring outsourced repair providers.
Companies choose approved provider operating models to generate more cost savings, lower security-related risks, and ensure better delivery flexibility. With regards to fleet management software solutions, the fleet operators stick to preferred suppliers since they require continuous technical support to ensure they are timely trained on the latest advancements in the technology. Therefore, the operators prefer to continue business with them to ensure quality and efficiency in fleet operations.
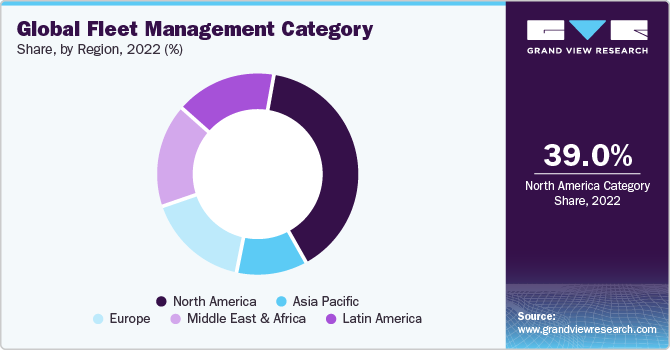
North America dominates the global market, largely attributed to the stringent measures taken by the regional governments by framing regulations that have compelled the industry to adhere to the policies, consequently leading to a significant decrease in the emissions caused by vehicles. The region is dominated by the U.S. as the primary market. Besides, looking over other parts of the world, Europe is dominated by Germany due to a rise in research & development activities whereas Asia Pacific is dominated by China due to increased adoption of robotics and automation solutions in manufacturing.
The Fleet Management category procurement intelligence report also provides details regarding day one, quick wins, portfolio analysis, key negotiation strategies of key suppliers, and low-cost/best-cost sourcing analysis.
Fleet Management Category Procurement Intelligence Report Scope
Report Attribute
Details
Fleet Management Category Growth Rate
CAGR of 16.4% from 2023 to 2030
Base Year for Estimation
2022
Pricing Growth Outlook
5% - 10% (Annually)
Pricing Models
Cost plus pricing model, fixed price pricing model
Supplier Selection Scope
Cost and pricing, past engagements, productivity, geographical presence
Supplier Selection Criteria
Years of experience, geographical service provision, industries served, fleet acquisition/leasing, outsourced driver management, fleet management, sale & leaseback, technology, consulting, and other factors
Report Coverage
Revenue forecast, supplier ranking, supplier matrix, emerging technology, pricing models, cost structure, competitive landscape, growth factors, trends, engagement, and operating model
Key Companies Profiled
ALD SA (ALD International), Arval Service Lease, Donlen LLC, Element Fleet Management Corp., Ewald Fleet Solutions, Executive Trust Limited (Europcar Ireland), Holman, Inc., Mike Albert Leasing, Inc., Mobilease, LLC, ORIX Corporation, The Hertz Corporation and Wheels, LLC
Regional Scope
Global
Historical Data
2020 - 2021
Revenue Forecast in 2030
USD 74.5 billion
Quantitative Units
Revenue in USD billion and CAGR from 2023 to 2030
Customization Scope
Up to 48 hours of customization free with every report.
Pricing and Purchase Options
Avail customized purchase options to meet your exact research needs. Explore purchase options
Frequently Asked Questions About This Report
b. The global fleet management category size was valued at USD 22.1 billion in 2022 and is estimated to witness a CAGR of 16.4% from 2023 to 2030.
b. Increased requirements for efficient fleet operations to ensure reduced operating costs, continuous development of fleet management technologies, rising concern for driver safety, and challenges met by business enterprises to comply with the regulations laid by the governments are driving the growth of the fleet management category.
b. According to the LCC/BCC sourcing analysis, U.S. and China are the ideal destinations for sourcing fleet management services.
b. The global fleet management category features a highly fragmented competitive landscape among key players. Some of the key fleet management solution providers are ALD SA (ALD International), Arval Service Lease, Donlen LLC, Element Fleet Management Corp., Ewald Fleet Solutions, Executive Trust Limited (Europcar Ireland), Holman, Inc., Mike Albert Leasing, Inc., Mobilease, LLC, ORIX Corporation, The Hertz Corporation and Wheels, LLC
b. Vehicle cost, financing, insurance, telematics, fuel costs, and repair & maintenance and Other costs (fees & taxes, downtime costs, depreciation, labor costs, toll & parking costs, and disposal costs) are key cost components associated with this category.
b. Right partner selection, understanding the total cost of ownership for the fleet management services, type of fleet management software required, cost of maintenance and how often it is required, regulatory compliance, etc. are some of the best practices while sourcing this category.
Share this report with your colleague or friend.
GET A FREE SAMPLE
This FREE sample includes market data points, ranging from trend analyses to market estimates & forecasts. See for yourself...
Add-on Services
Should Cost Analysis
Component wise cost break down for better negotiation for the client, highlights the key cost drivers in the market with future price fluctuation for different materials (e.g.: steel, aluminum, etc.) used in the production process
Rate Benchmarking
Offering cost transparency for different products / services procured by the client. A typical report involves 2-3 case scenarios helping clients to select the best suited engagement with the supplier
Salary Benchmarking
Determining and forecasting salaries for specific skill set labor to make decision on outsourcing vs in-house.
Supplier Newsletter
A typical newsletter study by capturing latest information for specific suppliers related to: M&As, technological innovations, expansion, litigations, bankruptcy etc.
![gvr icn]()
NEED A CUSTOM REPORT?
We can customize every report - free of charge - including purchasing stand-alone sections or country-level reports, as well as offer affordable discounts for start-ups & universities.
Contact us now to get our best pricing.
![esomar icon]()
ESOMAR certified & member
![ISO]()
ISO Certified
We are GDPR and CCPA compliant! Your transaction & personal information is safe and secure. For more details, please read our privacy policy.
We are committed towards customer satisfaction, and quality service.
Client Testimonials

"The quality of research they have done for us has been excellent..."
ISO Certified


