GVR Report cover Ammonium Sulfate Market Size, Share & Trends Report

Ammonium Sulfate Market Size, Share & Trends Analysis Report By Product (Solid, Liquid), By Application (Fertilizer, Pharmaceutical, Food & Feed Additive), By Region, And Segment Forecasts, 2024 - 2030

  • Report ID: 978-1-68038-702-5
  • Number of Report Pages: 109
  • Format: PDF, Horizon Databook
  • Historical Range: 2018 - 2020
  • Forecast Period: 2022 - 2030 
  • Industry: Bulk Chemicals

Ammonium Sulfate Market Size & Trends

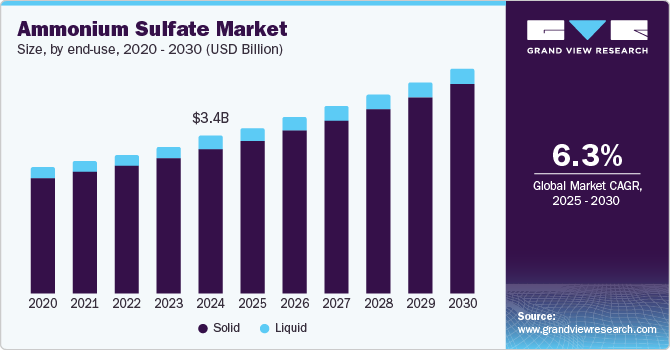
The global ammonium sulfate market size was estimated at USD 3.14 billion in 2023 and is expected to grow at a compound annual growth rate (CAGR) of 7.0% from 2024 to 2030.The market growth can be attributed to the increased demand for ammonium sulfate in formulating nitrogenous fertilizers, which are extensively used in the agricultural sector. The market is highly driven by the consumption of solid ammonium sulfate. However, demand for water treatment is anticipated to drive the demand for its liquid counterpart.

U.S. Ammonium Sulfate market size and growth rate, 2024 - 2030

The ammonium sulfate market growth is driven by its consumption in fertilizers as the chemical contains nitrogen and sulfur. It is mainly used for reducing the acidity of alkaline soils as they have a high pH level. The product contains nitrogenous elements, along with sulfur, which is used for protein synthesis in plants. The product is also largely preferred for flooded soils used in rice cultivation as nitrate-based fertilizers are a poor choice as they could lead to denitrification and leaching.

Ammonium sulfate is typically an inorganic water-soluble salt, which comprises sulfur and nitrogen. The composition is formulated for extensive use in the agricultural sector as a fertilizer. The substance has a high nitrogen content and is, therefore, the most commonly utilized supplement for nitrogen-deficit lawns and soil. Furthermore, the product has the ability to be easily mixed with nitrogen fertilizers and thereby providing enhanced stability and functionality to the fertilizer.

Ammonium sulfate is produced as a byproduct of coke oven processes and caprolactam, which is majorly used for the production of nylon fibers. The growing demand for nylon fibers for production of textiles, industrial yarn, carpets, and fishing nets has resulted in the growth in caprolactam manufacturing, subsequently leading to an increase in the supply of the product globally. However, the consumption of the product is estimated to register a slow growth rate over the forecast period, causing an oversupply in the marketplace. This factor has reduced the price of the product.

The ammonium sulfate market price fell considerably during the first half of 2023, due to low feedstock prices, surplus availability, and low procurement orders from China and global markets. In the U.S., the demand from agriculture sector was met through local availability leading to decline in imports from China and low prices of the product.

The key benefits offered by these fertilizers include waster solubility, easy blending abilities with nitrogenous fertilizers, the elevation of soil acidity, optimized sulfur and nitrogen content in the applied soil, and the nourishment of alkaline soils. These properties ensure high plant growth, and the product is, therefore, widely accepted by the global farming communities. With the rising competition globally, in terms of product development by key multinationals, the market is projected to witness steady growth over the coming years.

Ammonium sulfate is considered to be toxic to human health. Exposure to the product at the production site, processing, and transportation could cause severe respiratory route infection due to the inhalation of aqueous aerosols and dust. Prolonged skin contact might cause dermatitis, permanent eye damage, and lung damage. Such factors are anticipated to hinder market growth.

Market Concentration & Characteristics

The global ammonium sulfate market is highly concentrated with the presence of multiple international chemical manufacturers as well as fertilizer producers that have a high market presence across all major regions. Companies such as BASF SE, Evonik Industries, Sumitomo Chemicals, and Honeywell International are among the top producers of various grades of ammonium sulfate and cater to the growing demand from an array of end-use markets.

Ammonium Sulfate Market Concentration & Characteristics

However, the global market space also reflects intervention of regional level small & medium scale enterprises across various markets of North America and Asia Pacific. For instance, companies such as Phillips Petroleum Company, Hindustan Dorr-Oliver Limited, Airborne Industrial Minerals Inc., Republic Steel Corp., and Ansor Corp. have launched multiple patented technologies for the production method of ammonium sulfate. These innovations are anticipated to fuel market competition globally over the coming years.

Product Insights

The solid segment dominated the market with a revenue share of over 90.0% in 2023. This is attributed to an increase in demand for the solid segment. Ammonium sulfate is commonly identified as an organic sulfate salt, which is a white odorless solid. It easily dissolves in water but is observed to be non-dissolving in acetone or alcohol. Solid ammonium sulfate crystals are broadly used in alkaline soils as fertilizers globally owing to their ability to improvise the soil nutrient content and sulfur deficiency. The solid or crystalline grade is higher in purity and is hence anticipated to gain preference in the pharmaceutical industry.

The liquid form of the product is commercially available as a pale yellowish solution and is recognized to be a non-toxic, stable, and non-hazardous substance. Liquid ammonium sulfate solution is widely used in water treatment. The market for liquid ammonium sulfate (LAS) is projected to witness significant growth due to the hazardous nature of its substitutes, namely, aqueous or anhydrous ammonia and stringent handling protocols. This type of sulfate is widely accepted and used as an effective and stable source of ammonia for chloramination.

Application Insights

The fertilizers segment accounted for the largest revenue share of over 70.0% in 2023. The demand is attributed to the use of ammonium sulfate as a fertilizer for alkaline soils as it contains both nitrogen and sulfur. Growing fertilizer consumption across agriculture-based economies is expected to drive the demand for the product over the forecast period. In soil, the product breaks down into sulfur dioxide, which enhances metabolism, and ammonia & nitrogen, which further produces amino acids.

Global Ammonium Sulfate market share and size, 2023

Major applications of ammonium sulfate include fertilizers, food and feed additives, pharmaceuticals, and water treatment. The market is mainly driven by fertilizers as ammonium sulfate is widely used as a substance in fertilizer production and is essentially used by all major nitrogenous fertilizer producers worldwide. Increasing demand for food products has pushed the agricultural industry to use ammonium sulfate products in fertilizer formulations globally. The pharmaceuticals segment is anticipated to register a lucrative CAGR over the forecast period. Ammonium sulfate is a key component in the pharmaceutical industry, wherein it is widely used as an intermediate to fractionate and precipitate protein.

Regional Insights

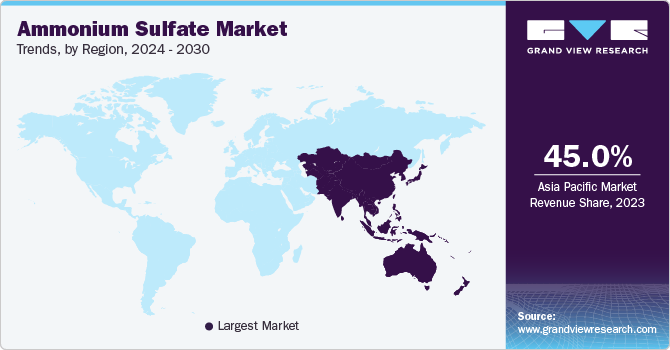
Asia Pacific held the largest volume share of over 45.0% in 2023. The growth is attributed to the increase in demand for fertilizers used in the agriculture sector in the region, which in turn, will boost the demand for ammonium sulfate. Agriculture is a primary sector in numerous economies such as India, Bangladesh, and Sri Lanka. Although the growth of the agriculture sector is comparatively slow, advancements in this field is likely to create growth opportunities for utilization of fertilizers.

Ammonium Sulfate Market Trends, by Region, 2024 - 2030

India Ammonium Sulfate Market: India is the largest consumer of pulses in the world. It consumes 27% of its total production and the country’s production accounts for 25% of the global production. The growing population has decreased the available land for agriculture, thereby increasing the pressure on farmers. These factors have increased the demand for fertilizers, thus boosting the demand for ammonium sulfate in the country.

Europe accounted for the second-largest share in terms of volume in 2023. The growth is credited to the increase in demand for fertilizers used in crop production. Various regulations regarding the utilization of synthetic fertilizers are being established in the region. Central and South America are anticipated to register a revenue-based CAGR of over 6.9% over the forecast period due to an increase in the demand for high-quality ammonium sulfate-based fertilizers used in the healthy growth of the major crops, which include grapes, soybeans, sunflower seeds, and wheat. The agriculture sector accounts for half of the share of the country’s GDP in Central and South America, including Argentina, Bolivia, Dominica, Paraguay, and Belize.

U.S. Ammonium Sulfate Market: The U.S. dominates the North American fertilizer market and is the largest producer and exporter of phosphorus and ammonia in the world. The country has witnessed a revival in the agricultural sector which has led to the increasing demand for fertilizers, and in turn, ammonium sulfate-based fertilizers.

Key Companies & Market Share Insights

The market for ammonium sulfate is highly competitive with the big international brands focusing on the development of long-term relationships with the end users. With the further increase in the water treatment operations and the growth of the pharmaceutical sector, the competition is anticipated to increase in the coming years. Companies such as Domo Chemicals, BASF, SABIC, and Honeywell International have a high degree of integration across the value chain as they are also engaged in the production of caprolactam. These companies have established themselves as key manufacturers and they focus on research and development for novel uses of the product.

Key Ammonium Sulfate Companies:

  • BASF SE
  • Evonik Industries
  • Lanxess Corporation
  • Novus International
  • Sumitomo Chemical
  • Honeywell International
  • Royal DSM

Recent Development

  • In March 2023, Enva initiated construction of a new fertilizer pellet plant. The fertilizers will be based on ammonium sulfate recovered from industrial liquid waste. The facility shall produce 4500 tons of pellets annually for agriculture, horticulture, and greenkeeping applications.

  • In July 2022, Evonik successfully finalized a strategic agreement to provide blueSulfate®, a premium nitrogen fertilizer, catering specifically to the demands of US farmers. This collaborative effort enables Evonik to efficiently meet the market's requirements and enhance agricultural productivity in the United States

Ammonium Sulfate Market Report Scope

Report Attribute

Details

Market size value in 2024

USD 3.36 billion

Revenue forecast in 2030

USD 5.04 billion

Growth rate

CAGR of 7.0% from 2024 to 2030

Historical data

2018 - 2023

Forecast period

2024 - 2030

Quantitative Units

Volume in kilotons, revenue in USD million, and CAGR from 2024 to 2030

Report coverage

Volume forecast, revenue forecast, competitive landscape, growth factors, and trends

Segments covered

Product, application, and region

Regional scope

North America, Europe, Asia Pacific, Central & South America, Middle East & Africa

Country scope

U.S., Canada, Mexico, Germany, U.K, France, Italy, Netherlands, China, India, Japan, Indonesia, Vietnam, Brazil, Argentina, Iran, Egypt

Key companies profiled

BASF SE, Evonik Industries, Lanxess Corporation, Novux International, Sumitomo Chemical, Honeywell International

Customization scope

Free report customization (equivalent up to 8 analysts working days) with purchase. Addition or alteration to country, regional & segment scope.

Pricing and purchase options

Avail customized purchase options to meet your exact research needs. Explore purchase options

Global Ammonium Sulfate Market Report Segmentation

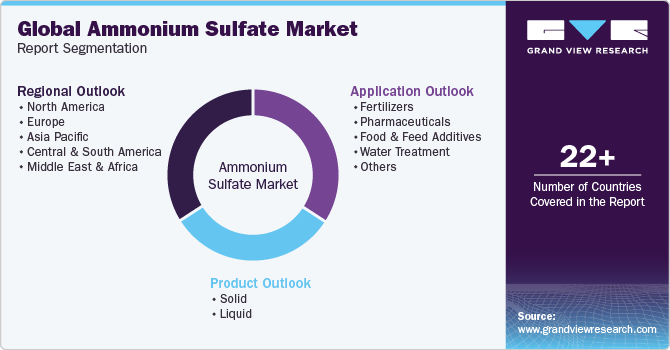
This report forecasts revenue growth at global, regional, and country levels and provides an analysis on the latest industry trends in each of the sub-segments from 2017 to 2028. For the purpose of this study, Grand View Research has segmented the global ammonium sulfate market report on the basis of product, application, and region:

Global Ammonium Sulfate Market Report Segmentation

  • Product Outlook (Volume, Kilotons; Revenue, USD Million, 2018 - 2030)

    • Solid

    • Liquid

  • Application Outlook (Volume, Kilotons; Revenue, USD Million, 2018 - 2030)

    • Fertilizers

    • Pharmaceuticals

    • Food & Feed Additives

    • Water Treatment

    • Others

  • Regional Outlook (Volume, Kilotons; Revenue, USD Million, 2018 - 2030)

    • North America

      • U.S.

      • Canada

      • Mexico

    • Europe

      • Germany

      • U.K

      • France

      • Italy

      • Netherlands

    • Asia Pacific

      • China

      • India

      • Japan

      • Indonesia

      • Vietnam

    • Central & South America

      • Brazil

      • Argentina

    • Middle East & Africa

      • Iran

      • Egypt

Frequently Asked Questions About This Report

Table of Contents

Chapter 1 Ammonium Sulfate Market: Methodology & Scope
                   1.1 Market Segmentation & Scope
                   1.2 Market Definitions
                   1.3 Information Procurement
                       1.3.1 Information Analysis
                       1.3.2 Market Formulation & Data Visualization
                       1.3.3 Data Validation & Publishing
                   1.4 Research Scope And Assumptions
                       1.4.1 List To Data Sources
Chapter 2 Ammonium Sulfate Market: Executive Summary
                   2.1 Market Summary
Chapter 3 Ammonium Sulfate Market: Market Variables & Trends Analysis
                   3.1 Market Lineage Outlook
                       3.1.1 Global Nitrogenous Fertilizer Market Outlook
                       3.1.2 Global Ammonium Sulfate Market Outlook
                   3.2 Penetration & Growth Prospect Mapping
                   3.3 Industry Value Chain Analysis
                       3.3.1 Raw Material Analysis
                       3.3.2 Price Trend Analysis
                   3.4 Technology Overview
                   3.5 Trade Analysis, 2018 - 2021
                       3.5.1 Key Importer, By Volume
                       3.5.2 Key Importer, By Value
                       3.5.3 Key Exporter, By Volume
                       3.5.4 Key Exporter, By Value
                   3.6 Regulatory Framework
                   3.7 Market Dynamics
                       3.7.1 Market Driver Analysis
                           3.7.1.1 Growing Population And Shrinking Arable Land
                           3.7.1.2 Robust Growth Of The Overall Fertilizer Industry
                       3.7.2 Market Restraint Analysis
                           3.7.2.1 High Environmental Impact
                   3.8 Key Opportunities Prioritized
                   3.9 Impact Of Covid-19
                   3.10 Business Environment Analysis
                       3.10.1 Porter’s Analysis
                           3.10.1.1 Threat Of New Entrants
                           3.10.1.2 Bargaining Power Of Buyers
                           3.10.1.3 Threat Of Substitutes
                           3.10.1.4 Bargaining Power Of Suppliers
                           3.10.1.5 Industry Rivalry
                       3.10.2 Pestel Analysis
                           3.10.2.1 Political
                           3.10.2.2 Economic
                           3.10.2.3 Social
                           3.10.2.4 Technological
                           3.10.2.5 Environmental
                           3.10.2.6 Legal
Chapter 4 Ammonium Sulfate Market: Product Estimates & Trend Analysis
                   4.1 Product Movement Analysis & Market Share, 2021 & 2030
                   4.2 Ammonium Sulfate Market Estimates & Forecasts, By Product
                       4.2.1 Solid
                           4.2.1.1 Solid Market Estimates & Forecasts, 2021 - 2030 (Kilotons) (USD Million)
                       4.2.2 Liquid
                           4.2.2.1 Liquid Market Estimates & Forecasts, 2021 - 2030 (Kilotons) (USD Million)
Chapter 5 Ammonium Sulfate Market: Application Estimates & Trend Analysis
                   5.1 Application Movement Analysis & Market Share, 2021 & 2030
                   5.2 Ammonium Sulfate Market Estimates & Forecasts, By Application
                       5.2.1 Fertilizers
                           5.2.1.1 Ammonium Sulfate Market Estimates & Forecasts In Fertilizers, 2018 - 2030 (Kilotons) (USD Million)
                       5.2.2 Pharmaceuticals
                           5.2.2.1 Ammonium Sulfate Market Estimates & Forecasts In Pharmaceuticals, 2018 - 2030 (Kilotons) (USD Million)
                       5.2.3 Food & Feed Additive
                           5.2.3.1 Ammonium Sulfate Market Estimates & Forecasts In Food & Feed Additive, 2018 - 2030 (Kilotons) (USD Million)
                       5.2.4 Water Treatment
                           5.2.4.1Ammonium Sulfate Market Estimates & Forecasts In Water Treatment, 2018 - 2030 (Kilotons) (USD Million)
                       5.2.5 Others Applications
                           5.2.5.1 Ammonium Sulfate Market Estimates & Forecasts In Others Applications, 2018 - 2030 (Kilotons) (USD Million)
Chapter 6 Ammonium Sulfate Market: Regional Estimates & Trend Analysis
                   6.1 Regional Movement Analysis & Market Share, 2021 & 2030
                   6.2 Market Size, Forecasts, And Trend Analysis, 2018 - 2030
                       6.2.1 North America
                           6.2.1.1 Market Volume & Revenue, By Product, 2018 - 2030
                           6.2.1.2 Market Volume & Revenue, By Application, 2018 - 2030
                           6.2.1.3 U.S.
                               6.2.1.3.1 Market Volume & Revenue, By Product, 2018 - 2030
                               6.2.1.3.2 Market Volume & Revenue, By Application, 2018 - 2030
                           6.2.1.4 Canada
                               6.2.1.4.1 Market Volume & Revenue, By Product, 2018 - 2030
                               6.2.1.4.2 Market Volume & Revenue, By Application, 2018 - 2030
                           6.2.1.5 Mexico
                               6.2.1.5.1 Market Volume & Revenue, By Product, 2018 - 2030
                               6.2.1.5.2 Market Volume & Revenue, By Application, 2018 - 2030
                       6.2.2 Europe
                           6.2.2.1 Market Volume & Revenue, By Product, 2018 - 2030
                           6.2.2.2 Market Volume & Revenue, By Application, 2018 - 2030
                           6.2.2.3 Germany
                               6.2.2.3.1 Market Volume & Revenue, By Product, 2018 - 2030
                               6.2.2.3.2 Market Volume & Revenue, By Application, 2018 - 2030
                           6.2.2.4 France
                               6.2.2.4.1 Market Volume & Revenue, By Product, 2018 - 2030
                               6.2.2.4.2 Market Volume & Revenue, By Application, 2018 - 2030
                           6.2.2.5 Netherlands
                               6.2.2.5.1 Market Volume & Revenue, By Product, 2018 - 2030
                               6.2.2.5.2 Market Volume & Revenue, By Application, 2018 - 2030
                           6.2.2.6 U.K.
                               6.2.2.6.1 Market Volume & Revenue, By Product, 2018 - 2030
                               6.2.2.6.2 Market Volume & Revenue, By Application, 2018 - 2030
                           6.2.2.7 Italy
                               6.2.2.7.1 Market Volume & Revenue, By Product, 2018 - 2030
                               6.2.2.7.2 Market Volume & Revenue, By Application, 2018 - 2030
                       6.2.3 Asia Pacific
                           6.2.3.1 Market Volume & Revenue, By Product, 2018 - 2030
                           6.2.3.2 Market Volume & Revenue, By Application, 2018 - 2030
                           6.2.3.3 China
                               6.2.3.3.1 Market Volume & Revenue, By Product, 2018 - 2030
                               6.2.3.3.2 Market Volume & Revenue, By Application, 2018 - 2030
                           6.2.3.4 India
                               6.2.3.4.1 Market Volume & Revenue, By Product, 2018 - 2030
                               6.2.3.4.2 Market Volume & Revenue, By Application, 2018 - 2030
                           6.2.3.5 Japan
                               6.2.3.5.1 Market Volume & Revenue, By Product, 2018 - 2030
                               6.2.3.5.2 Market Volume & Revenue, By Application, 2018 - 2030
                           6.2.3.6 Indonesia
                               6.2.3.6.1 Market Volume & Revenue, By Product, 2018 - 2030
                               6.2.3.6.2 Market Volume & Revenue, By Application, 2018 - 2030
                           6.2.3.7 Vietnam
                               6.2.3.7.1 Market Volume & Revenue, By Product, 2018 - 2030
                               6.2.3.7.2 Market Volume & Revenue, By Application, 2018 - 2030
                       6.2.4 Central & South America
                           6.2.4.1 Market Volume & Revenue, By Product, 2018 - 2030
                           6.2.4.2 Market Volume & Revenue, By Application, 2018 - 2030
                           6.2.4.3 Brazil
                               6.2.4.3.1 Market Volume & Revenue, By Product, 2018 - 2030
                               6.2.4.3.2 Market Volume & Revenue, By Application, 2018 - 2030
                           6.2.4.4 Argentina
                               6.2.4.4.1 Market Volume & Revenue, By Product, 2018 - 2030
                               6.2.4.4.2 Market Volume & Revenue, By Application, 2018 - 2030
                       6.2.5 Middle East & Africa
                           6.2.5.1 Market Volume & Revenue, By Product, 2018 - 2030
                           6.2.5.2 Market Volume & Revenue, By Application, 2018 - 2030
                           6.2.5.3 Iran
                               6.2.5.3.1 Market Volume & Revenue, By Product, 2018 - 2030
                               6.2.5.3.2 Market Volume & Revenue, By Application, 2018 - 2030
                           6.2.5.4 Egypt
                               6.2.5.4.1 Market Volume & Revenue, By Product, 2018 - 2030
                               6.2.5.4.2 Market Volume & Revenue, By Application, 2018 - 2030
Chapter 7 Competitive Analysis
                   7.1 Company Heat Map Analysis
                   7.2 Vendor Landscape
                   7.3 Competitive Environment
                   7.4 Ammonium Sulfate Market Share Analysis, 2021
                   7.5 Strategic Alliances
                       7.5.1 Production Capacities, By Key Companies
Chapter 8 Company Profiles
                   8.1 BASF SE
                       8.1.1 Company Introduction
                       8.1.2 General Information
                       8.1.3 Financial Performance
                       8.1.4 Product Portfolio
                       8.1.5 Key Developments
                   8.2 Evonik Industries AG
                       8.2.1 Company Introduction
                       8.2.2 General Information
                       8.2.3 Key Financial Data
                       8.2.4 Product Portfolio
                       8.2.5 Strategic Initiatives
                   8.3 Lanxess Corporation
                       8.3.1 Company Introduction
                       8.3.2 General Information
                       8.3.3 Financial Performance
                       8.3.4 Product Portfolio
                       8.3.5 Key Developments
                   8.4 Novus International
                       8.4.1 Company Introduction
                       8.4.2 General Information
                       8.4.3 Product Portfolio
                   8.5 Sumitomo Chemical Co. Ltd.
                       8.5.1 Company Introduction
                       8.5.2 General Information
                       8.5.3 Financial Performance
                       8.5.4 Product Portfolio
                       8.5.5 Key Developments
                   8.6 Honeywell International Inc.
                       8.6.1 Company Introduction
                       8.6.2 General Information
                       8.6.3 Financial Performance
                       8.6.4 Product Portfolio
                   8.7 Royal Dsm
                       8.7.1 Company Introduction
                       8.7.2 General Information
                       8.7.3 Financial Performance
                       8.7.4 Product Portfolio
                       8.7.5 Key Developments
                   8.8 Helm AG
                       8.8.1 Company Introduction
                       8.8.2 General Information
                       8.8.3 Financial Performance
                       8.8.4 Product Portfolio
                   8.9 Arcelormittal S.A.
                       8.9.1 Company Introduction
                       8.9.2 General Information
                       8.9.3 Financial Performance
                       8.9.4 Product Portfolio
                   8.10 Tereos S.A.
                       8.10.1 Company Introduction
                       8.10.2 General Information
                       8.10.3 Financial Performance
                       8.10.4 Product Portfolio
                   8.11 Domo Chemicals Gmbh
                       8.11.1 Company Introduction
                       8.11.2 General Information
                       8.11.3 Product Portfolio
                       8.11.4 Key Developments
                   8.12 Akzo Nobel N.V.
                       8.12.1 Company Introduction
                       8.12.2 General Information
                       8.12.3 Financial Performance
                       8.12.4 Product Portfolio
                   8.13 Sabic
                       8.13.1 Company Introduction
                       8.13.2 General Information
                       8.13.3 Financial Performance
                       8.13.4 Product Portfolio
                   8.14 Arkema S.A.
                       8.14.1 Company Introduction
                       8.14.2 General Information
                       8.14.3 Financial Performance
                       8.14.4 Product Portfolio
                       8.14.5 Key Developments
                   8.15 OCI Nitrogen
                       8.15.1 Company Introduction
                       8.15.2 General Information
                       8.15.3 Financial Performance
                       8.15.4 Product Portfolio


List Of Tables

Table 1 Top 10 Importer, By Volume (KiloTons)
Table 2 Top 10 Importer, By Value (USD Thousand)
Table 3 Top 10 Exporter, By Volume (KiloTons)
Table 4 Top 10 Exporter, By Value (USD Thousand)
Table 5 Solid Ammonium Sulfate Market Volume & Revenue, 2018 - 2030 (Kilotons) (USD Million)
Table 6 Liquid Ammonium Sulfate Market Volume & Revenue, 2018 - 2030 (Kilotons) (USD Million)
Table 7 Ammonium Sulfate Market Volume & Revenue, In Fertilizers, 2018 - 2030 (Kilotons) (USD Million)
Table 8 Ammonium Sulfate Market Volume & Revenue, In Pharmaceuticals, 2018 - 2030 (Kilotons) (USD Million)
Table 9 Ammonium Sulfate Market Volume & Revenue, In Food & Feed Additive, 2018 - 2030 (Kilotons) (USD Million)
Table 10 Ammonium Sulfate Market Volume & Revenue, In Water Treatment, 2018 - 2030 (Kilotons) (USD Million)
Table 11 Ammonium Sulfate Market Volume & Revenue, In Other Applications, 2018 - 2030 (Kilotons) (USD Million)
Table 12 North America Ammonium Sulfate Market Volume & Revenue, 2018 - 2030 (Kilotons) (USD Million)
Table 13 North America Ammonium Sulfate Market Volume, By Product, 2018 - 2030 (Kilotons)
Table 14 North America Ammonium Sulfate Market Revenue, By Product, 2018 - 2030 (USD Million)
Table 15 North America Ammonium Sulfate Market Volume, By Application, 2018 - 2030 (Kilotons)
Table 16 North America Ammonium Sulfate Market Revenue, By Application, 2018 - 2030 (USD Million)
Table 17 U.S. Ammonium Sulfate Market Volume & Revenue, 2018 - 2030 (Kilotons) (USD Million)
Table 18 U.S. Ammonium Sulfate Market Volume, By Product, 2018 - 2030 (Kilotons)
Table 19 U.S. Ammonium Sulfate Market Revenue, By Product, 2018 - 2030 (USD Million)
Table 20 U.S. Ammonium Sulfate Market Volume, By Application, 2018 - 2030 (Kilotons)
Table 21 U.S. Ammonium Sulfate Market Revenue, By Application, 2018 - 2030 (USD Million)
Table 22 Canada Ammonium Sulfate Market Volume & Revenue, 2018 - 2030 (Kilotons) (USD Million)
Table 23 Canada Ammonium Sulfate Market Volume, By Product, 2018 - 2030 (Kilotons)
Table 24 Canada Ammonium Sulfate Market Revenue, By Product, 2018 - 2030 (USD Million)
Table 25 Canada Ammonium Sulfate Market Volume, By Application, 2018 - 2030 (Kilotons)
Table 26 Canada Ammonium Sulfate Market Revenue, By Application, 2018 - 2030 (USD Million)
Table 27 Mexico Ammonium Sulfate Market Volume & Revenue, 2018 - 2030 (Kilotons) (USD Million)
Table 28 Mexico Ammonium Sulfate Market Volume, By Product, 2018 - 2030 (Kilotons)
Table 29 Mexico Ammonium Sulfate Market Revenue, By Product, 2018 - 2030 (USD Million)
Table 30 Mexico Ammonium Sulfate Market Volume, By Application, 2018 - 2030 (Kilotons)
Table 31 Mexico Ammonium Sulfate Market Revenue, By Application, 2018 - 2030 (USD Million)
Table 32 Europe Ammonium Sulfate Market Volume & Revenue, 2018 - 2030 (Kilotons) (USD Million)
Table 33 Europe Ammonium Sulfate Market Volume, By Product, 2018 - 2030 (Kilotons)
Table 34 Europe Ammonium Sulfate Market Revenue, By Product, 2018 - 2030 (USD Million)
Table 35 Europe Ammonium Sulfate Market Volume, By Application, 2018 - 2030 (Kilotons)
Table 36 Europe Ammonium Sulfate Market Revenue, By Application, 2018 - 2030 (USD Million)
Table 37 Germany Ammonium Sulfate Market Volume & Revenue, 2018 - 2030 (Kilotons) (USD Million)
Table 38 Germany Ammonium Sulfate Market Volume, By Product, 2018 - 2030 (Kilotons)
Table 39 Germany Ammonium Sulfate Market Revenue, By Product, 2018 - 2030 (USD Million)
Table 40 Germany Ammonium Sulfate Market Volume, By Application, 2018 - 2030 (Kilotons)
Table 41 Germany Ammonium Sulfate Market Revenue, By Application, 2018 - 2030 (USD Million)
Table 42 France Ammonium Sulfate Market Volume & Revenue, 2018 - 2030 (Kilotons) (USD Million)
Table 43 France Ammonium Sulfate Market Volume, By Product, 2018 - 2030 (Kilotons)
Table 44 France Ammonium Sulfate Market Revenue, By Product, 2018 - 2030 (USD Million)
Table 45 France Ammonium Sulfate Market Volume, By Application, 2018 - 2030 (Kilotons)
Table 46 France Ammonium Sulfate Market Revenue, By Application, 2018 - 2030 (USD Million)
Table 47 Netherlands Ammonium Sulfate Market Volume & Revenue, 2018 - 2030 (Kilotons) (USD Million)
Table 48 Netherlands Ammonium Sulfate Market Volume, By Product, 2018 - 2030 (Kilotons)
Table 49 Netherlands Ammonium Sulfate Market Revenue, By Product, 2018 - 2030 (USD Million)
Table 50 Netherlands Ammonium Sulfate Market Volume, By Application, 2018 - 2030 (Kilotons)
Table 51 Netherlands Ammonium Sulfate Market Revenue, By Application, 2018 - 2030 (USD Million)
Table 52 U.K. Ammonium Sulfate Market Volume & Revenue, 2018 - 2030 (Kilotons) (USD Million)
Table 53 U.K. Ammonium Sulfate Market Volume, By Product, 2018 - 2030 (Kilotons)
Table 54 U.K. Ammonium Sulfate Market Revenue, By Product, 2018 - 2030 (USD Million)
Table 55 U.K. Ammonium Sulfate Market Volume, By Application, 2018 - 2030 (Kilotons)
Table 56 U.K. Ammonium Sulfate Market Revenue, By Application, 2018 - 2030 (USD Million)
Table 57 Italy Ammonium Sulfate Market Volume & Revenue, 2018 - 2030 (Kilotons) (USD Million)
Table 58 Italy Ammonium Sulfate Market Volume, By Product, 2018 - 2030 (Kilotons)
Table 59 Italy Ammonium Sulfate Market Revenue, By Product, 2018 - 2030 (USD Million)
Table 60 Italy Ammonium Sulfate Market Volume, By Application, 2018 - 2030 (Kilotons)
Table 61 Italy Ammonium Sulfate Market Revenue, By Application, 2018 - 2030 (USD Million)
Table 62 Asia Pacific Ammonium Sulfate Market Volume & Revenue, 2018 - 2030 (Kilotons) (USD Million)
Table 63 Asia Pacific Ammonium Sulfate Market Volume, By Product, 2018 - 2030 (Kilotons)
Table 64 Asia Pacific Ammonium Sulfate Market Revenue, By Product, 2018 - 2030 (USD Million)
Table 65 Asia Pacific Ammonium Sulfate Market Volume, By Application, 2018 - 2030 (Kilotons)
Table 66 Asia Pacific Ammonium Sulfate Market Revenue, By Application, 2018 - 2030 (USD Million)
Table 67 China Ammonium Sulfate Market Volume & Revenue, 2018 - 2030 (Kilotons) (USD Million)
Table 68 China Ammonium Sulfate Market Volume, By Product, 2018 - 2030 (Kilotons)
Table 69 China Ammonium Sulfate Market Revenue, By Product, 2018 - 2030 (USD Million)
Table 70 China Ammonium Sulfate Market Volume, By Application, 2018 - 2030 (Kilotons)
Table 71 China Ammonium Sulfate Market Revenue, By Application, 2018 - 2030 (USD Million)
Table 72 India Ammonium Sulfate Market Volume & Revenue, 2018 - 2030 (Kilotons) (USD Million)
Table 73 India Ammonium Sulfate Market Volume, By Product, 2018 - 2030 (Kilotons)
Table 74 India Ammonium Sulfate Market Revenue, By Product, 2018 - 2030 (USD Million)
Table 75 India Ammonium Sulfate Market Volume, By Application, 2018 - 2030 (Kilotons)
Table 76 India Ammonium Sulfate Market Revenue, By Application, 2018 - 2030 (USD Million)
Table 77 Japan Ammonium Sulfate Market Volume & Revenue, 2018 - 2030 (Kilotons) (USD Million)
Table 78 Japan Ammonium Sulfate Market Volume, By Product, 2018 - 2030 (Kilotons)
Table 79 Japan Ammonium Sulfate Market Revenue, By Product, 2018 - 2030 (USD Million)
Table 80 Japan Ammonium Sulfate Market Volume, By Application, 2018 - 2030 (Kilotons)
Table 81 Japan Ammonium Sulfate Market Revenue, By Application, 2018 - 2030 (USD Million)
Table 82 Indonesia Ammonium Sulfate Market Volume & Revenue, 2018 - 2030 (Kilotons) (USD Million)
Table 83 Indonesia Ammonium Sulfate Market Volume, By Product, 2018 - 2030 (Kilotons)
Table 84 Indonesia Ammonium Sulfate Market Revenue, By Product, 2018 - 2030 (USD Million)
Table 85 Indonesia Ammonium Sulfate Market Volume, By Application, 2018 - 2030 (Kilotons)
Table 86 Indonesia Ammonium Sulfate Market Revenue, By Application, 2018 - 2030 (USD Million)
Table 87 Vietnam Ammonium Sulfate Market Volume & Revenue, 2018 - 2030 (Kilotons) (USD Million)
Table 88 Vietnam Ammonium Sulfate Market Volume, By Product, 2018 - 2030 (Kilotons)
Table 89 Vietnam Ammonium Sulfate Market Revenue, By Product, 2018 - 2030 (USD Million)
Table 90 Vietnam Ammonium Sulfate Market Volume, By Application, 2018 - 2030 (Kilotons)
Table 91 Vietnam Ammonium Sulfate Market Revenue, By Application, 2018 - 2030 (USD Million)
Table 92 Central & South America Ammonium Sulfate Market Volume & Revenue, 2018 - 2030 (Kilotons) (USD Million)
Table 93 Central & South America Ammonium Sulfate Market Volume, By Product, 2018 - 2030 (Kilotons)
Table 94 Central & South America Ammonium Sulfate Market Revenue, By Product, 2018 - 2030 (USD Million)
Table 95 Central & South America Ammonium Sulfate Market Volume, By Application, 2018 - 2030 (Kilotons)
Table 96 Central & South America Ammonium Sulfate Market Revenue, By Application, 2018 - 2030 (USD Million)
Table 97 Brazil Ammonium Sulfate Market Volume & Revenue, 2018 - 2030 (Kilotons) (USD Million)
Table 98 Brazil Ammonium Sulfate Market Volume, By Product, 2018 - 2030 (Kilotons)
Table 99 Brazil Ammonium Sulfate Market Revenue, By Product, 2018 - 2030 (USD Million)
Table 100 Brazil Ammonium Sulfate Market Volume, By Application, 2018 - 2030 (Kilotons)
Table 101 Brazil Ammonium Sulfate Market Revenue, By Application, 2018 - 2030 (USD Million)
Table 102 Argentina Ammonium Sulfate Market Volume & Revenue, 2018 - 2030 (Kilotons) (USD Million)
Table 103 Argentina Ammonium Sulfate Market Volume, By Product, 2018 - 2030 (Kilotons)
Table 104 Argentina Ammonium Sulfate Market Revenue, By Product, 2018 - 2030 (USD Million)
Table 105 Argentina Ammonium Sulfate Market Volume, By Application, 2018 - 2030 (Kilotons)
Table 106 Argentina Ammonium Sulfate Market Revenue, By Application, 2018 - 2030 (USD Million)
Table 107 Middle East & Africa Ammonium Sulfate Market Volume & Revenue, 2018 - 2030 (Kilotons) (USD Million)
Table 108 Middle East & Africa Ammonium Sulfate Market Volume, By Product, 2018 - 2030 (Kilotons)
Table 109 Middle East & Africa Ammonium Sulfate Market Revenue, By Product, 2018 - 2030 (USD Million)
Table 110 Middle East & Africa Ammonium Sulfate Market Volume, By Application, 2018 - 2030 (Kilotons)
Table 111 Middle East & Africa Ammonium Sulfate Market Revenue, By Application, 2018 - 2030 (USD Million)
Table 112 Iran Ammonium Sulfate Market Volume & Revenue, 2018 - 2030 (Kilotons) (USD Million)
Table 113 Iran Ammonium Sulfate Market Volume, By Product, 2018 - 2030 (Kilotons)
Table 114 Iran Ammonium Sulfate Market Revenue, By Product, 2018 - 2030 (USD Million)
Table 115 Iran Ammonium Sulfate Market Volume, By Application, 2018 - 2030 (Kilotons)
Table 116 Iran Ammonium Sulfate Market Revenue, By Application, 2018 - 2030 (USD Million)
Table 117 Egypt Ammonium Sulfate Market Volume & Revenue, 2018 - 2030 (Kilotons) (USD Million)
Table 118 Egypt Ammonium Sulfate Market Volume, By Product, 2018 - 2030 (Kilotons)
Table 119 Egypt Ammonium Sulfate Market Revenue, By Product, 2018 - 2030 (USD Million)
Table 120 Egypt Ammonium Sulfate Market Volume, By Application, 2018 - 2030 (Kilotons)
Table 121 Egypt Ammonium Sulfate Market Revenue, By Application, 2018 - 2030 (USD Million)
Table 122 Ammonium Sulfate Company Heat Map Analysis, 2023
Table 123 Ammonium Sulfate Vendor Landscape


List of Figures

Fig. 1 Information Procurement
Fig. 2 Data Analysis Models
Fig. 3 Market Formulation And Validation
Fig. 4 Data Validating & Publishing
Fig. 5 Ammonium Sulfate Market Snapshot
Fig. 6 Ammonium Sulfate Market Volume & Revenue, 2018 - 2030
Fig. 7 Ammonium Sulfate Market Value Chain Analysis
Fig. 8 Ammonium Sulphate Price Trend Analysis, 2018 - 2030 (USD/Kg)
Fig. 9 Ammonium Sulfate Production Process
Fig. 10 Ammonium Sulfate Market Dynamics
Fig. 11 Market Driver Impact Analysis, 2018 - 2030
Fig. 12 Shrinking Arable Land, 2010 - 2023
Fig. 13 World Agricultural Land (% Of Land Area)
Fig. 14 Fertilizer Consumption (Kg. Per Hectare Of Arable Land), 2010 To 2023
Fig. 15 World Supply Of Nutrients, 2018 - 2023 (Million Tons)
Fig. 16 Market Restraint Impact Analysis, 2018 - 2030
Fig. 17 Ammonium Sulfate Key Opportunities Prioritized
Fig. 18 Ammonium Sulfate - Porter’s Analysis
Fig. 19 Ammonium Sulfate - PESTLE Analysis
Fig. 20 Ammonium Sulfate Market Revenue, By Product, 2023 & 2030 (USD Million)
Fig. 21 Ammonium Sulfate Market Revenue, By Application, 2023 & 2030 (USD Million)
Fig. 22 Ammonium Sulfate Market Revenue, By Region, 2023 & 2030 (USD Million)
Fig. 23 Company Market Share, 2023

What questions do you have? Get quick response from our industry experts. Request a Free Consultation

Market Segmentation

  • Ammonium Sulfate Product Outlook (Volume, Kilotons; Revenue, USD Million, 2018 - 2030)
    • Solid
    • Liquid
  • Ammonium Sulfate Application Outlook (Volume, Kilotons; Revenue, USD Million, 2018 - 2030)
    • Fertilizers
    • Pharmaceuticals
    • Food & Feed Additives
    • Water Treatment
    • Others
  • Ammonium Sulfate Regional Outlook (Volume, Kilotons; Revenue, USD Million, 2018 - 2030)
    • North America
      • North America Ammonium Sulfate Market, By Product
        • Solid
        • Liquid
      • North America Ammonium Sulfate Market, By Application
        • Fertilizers
        • Pharmaceuticals
        • Food & Feed Additive
        • Water Treatment
        • Others
      • U.S Ammonium Sulfate Market, By Product
        • Solid
        • Liquid
      • U.S. Ammonium Sulfate Market, By Application
        • Fertilizers
        • Pharmaceuticals
        • Food & Feed Additive
        • Water Treatment
        • Others
      • Canada Ammonium Sulfate Market, By Product
        • Solid
        • Liquid
      • Canada Ammonium Sulfate Market, By Application
        • Fertilizers
        • Pharmaceuticals
        • Food & Feed Additive
        • Water Treatment
        • Others
      • Mexico Ammonium Sulfate Market, By Product
        • Solid
        • Liquid
      • Mexico Ammonium Sulfate Market, By Application
        • Fertilizers
        • Pharmaceuticals
        • Food & Feed Additive
        • Water Treatment
        • Others
    • Europe
      • Europe Ammonium Sulfate Market, By Product
        • Solid
        • Liquid
      • Europe Ammonium Sulfate Market, By Application
        • Fertilizers
        • Pharmaceuticals
        • Food & Feed Additive
        • Water Treatment
        • Others
      • Germany Ammonium Sulfate Market, By Product
        • Solid
        • Liquid
      • Germany Ammonium Sulfate Market, By Application
        • Fertilizers
        • Pharmaceuticals
        • Food & Feed Additive
        • Water Treatment
        • Others
      • France Ammonium Sulfate Market, By Product
        • Solid
        • Liquid
      • France Ammonium Sulfate Market, By Application
        • Fertilizers
        • Pharmaceuticals
        • Food & Feed Additive
        • Water Treatment
        • Others
      • U.K. Ammonium Sulfate Market, By Product
        • Solid
        • Liquid
      • U.K. Ammonium Sulfate Market, By Application
        • Fertilizers
        • Pharmaceuticals
        • Food & Feed Additive
        • Water Treatment
        • Others
      • Netherlands Ammonium Sulfate Market, By Product
        • Solid
        • Liquid
      • Netherlands Ammonium Sulfate Market, By Application
        • Fertilizers
        • Pharmaceuticals
        • Food & Feed Additive
        • Water Treatment
        • Others
      • Italy Ammonium Sulfate Market, By Product
        • Solid
        • Liquid
      • Italy Ammonium Sulfate Market, By Application
        • Fertilizers
        • Pharmaceuticals
        • Food & Feed Additive
        • Water Treatment
        • Others
    • Asia Pacific
      • Asia Pacific Ammonium Sulfate Market, By Product
        • Solid
        • Liquid
      • Asia Pacific Ammonium Sulfate Market, By Application
        • Fertilizers
        • Pharmaceuticals
        • Food & Feed Additive
        • Water Treatment
        • Others
      • China Ammonium Sulfate Market, By Product
        • Solid
        • Liquid
      • China Ammonium Sulfate Market, By Application
        • Fertilizers
        • Pharmaceuticals
        • Food & Feed Additive
        • Water Treatment
        • Others
      • India Ammonium Sulfate Market, By Product
        • Solid
        • Liquid
      • India Ammonium Sulfate Market, By Application
        • Fertilizers
        • Pharmaceuticals
        • Food & Feed Additive
        • Water Treatment
        • Others
      • Japan Ammonium Sulfate Market, By Product
        • Solid
        • Liquid
      • Japan Ammonium Sulfate Market, By Application
        • Fertilizers
        • Pharmaceuticals
        • Food & Feed Additive
        • Water Treatment
        • Others
      • Indonesia Ammonium Sulfate Market, By Product
        • Solid
        • Liquid
      • Indonesia Ammonium Sulfate Market, By Application
        • Fertilizers
        • Pharmaceuticals
        • Food & Feed Additive
        • Water Treatment
        • Others
      • Vietnam Ammonium Sulfate Market, By Product
        • Solid
        • Liquid
      • Vietnam Ammonium Sulfate Market, By Application
        • Fertilizers
        • Pharmaceuticals
        • Food & Feed Additive
        • Water Treatment
        • Others
    • Central and South America
      • Central and South America Ammonium Sulfate Market, By Product
        • Solid
        • Liquid
      • Central and South America Ammonium Sulfate Market, By Application
        • Fertilizers
        • Pharmaceuticals
        • Food & Feed Additive
        • Water Treatment
        • Others
      • Brazil Ammonium Sulfate Market, By Product
        • Solid
        • Liquid
      • Brazil Ammonium Sulfate Market, By Application
        • Fertilizers
        • Pharmaceuticals
        • Food & Feed Additive
        • Water Treatment
        • Others
      • Argentina Ammonium Sulfate Market, By Product
        • Solid
        • Liquid
      • Argentina Ammonium Sulfate Market, By Application
        • Fertilizers
        • Pharmaceuticals
        • Food & Feed Additive
        • Water Treatment
        • Others
    • Middle East & Africa
      • Middle East & Africa Ammonium Sulfate Market, By Product
        • Solid
        • Liquid
      • Middle East & Africa Ammonium Sulfate Market, By Application
        • Fertilizers
        • Pharmaceuticals
        • Food & Feed Additive
        • Water Treatment
        • Others
      • Iran Ammonium Sulfate Market, By Product
        • Solid
        • Liquid
      • Iran Ammonium Sulfate Market, By Application
        • Fertilizers
        • Pharmaceuticals
        • Food & Feed Additive
        • Water Treatment
        • Others
      • Egypt Ammonium Sulfate Market, By Product
        • Solid
        • Liquid
      • Egypt Ammonium Sulfate Market, By Application
        • Fertilizers
        • Pharmaceuticals
        • Food & Feed Additive
        • Water Treatment
        • Others

Ammonium Sulfate Market Dynamics

Driver: Growing population and shrinking arable land

In 2020, farmers face an unprecedented challenge of producing large quantities of food grains within a limited timeframe due to the global population explosion. This is compounded by the fact that the amount of arable land per person has decreased as the population grows. The increasing demand for housing and commercial infrastructure development further increases farmers' pressure to maximize crop production on limited available lands. The scarcity of agricultural land is a significant obstacle to crop production. In 2006, the global population was 6.60 billion, with per capita arable land at 0.20 hectares. By 2016, the global population had risen to 7.4 billion, and per capita available land had decreased to just 0.19 hectares, a trend that persists in 2020. Out of the total land area of 12 billion hectares, only 1.6 billion hectares are used for agricultural purposes. Asia Pacific accounts for 39% of this land, while Europe, Africa, and the Middle East collectively have 36%. North America covers 15%, and the remaining 10% is in Latin America. The availability of arable land per person is decreasing worldwide and is expected to continue declining, leading to an increased reliance on fertilizers to enhance crop yields. The growing number of construction projects and rapid industrialization in developing economies, particularly in Asia Pacific, Western Europe, and Central America, pose a further threat of land loss for infrastructure development. These factors are projected to drive the demand for ammonium sulfate in nitrogenous fertilizer production in the coming years.

Driver: Robust growth of the overall fertilizer industry

Fertilizers are utilized to enhance soil productivity. They can be categorized into two types: organic and inorganic. Organic fertilizers consist of manure, fish meal, granite meal, and seaweed. On the other hand, inorganic fertilizers include nitrogen, potassium, and phosphorus fertilizers. In comparison to organic fertilizers, inorganic fertilizers are more commonly used as they provide quicker results. Inorganic fertilizers can be divided into two main sub-categories: macronutrients and micronutrients. Over the years, the consumption of fertilizers has steadily increased. Between 2005 and 2016, fertilizer consumption per hectare of arable land rose from 115.84 kg to 140.55 kg. However, there was a slowdown in consumption between 2007 and 2009 due to the global financial crisis. Since 2010, many countries have recovered economically, leading to a resurgence in agricultural activities and an increased demand for chemical fertilizers. Consequently, the market for ammonium sulfate-based fertilizers has experienced significant growth.

Restraint: High environmental impact

Fertilizers and other agricultural inputs contain chemicals and synthetic components that enhance plant growth. However, they also have detrimental effects on the environment in the long term. When used in large quantities, fertilizers can decrease soil fertility by increasing acidity levels and depleting its quality for future use. Eutrophication is another negative consequence of fertilizers on the environment. Fertilizers containing phosphates and nitrates, when carried through sewage and rain into oceans and lakes, contribute to excessive algae growth, reducing oxygen levels in water reserves. This decrease in oxygen ultimately results in the death of aquatic fauna and flora, including fish. Moreover, the synthetic chemicals in fertilizers can negatively impact groundwater reserves used for drinking water and can cause various diseases. One such disease is blue baby syndrome, which affects infants and is caused by water contaminated with nitrates. The continued use of synthetic fertilizers increases the risk of soil contamination and depletes underground water quality for future use. Depending on their composition, fossil fuels contain several chemicals, such as carbon dioxide, nitrogen, methane, and ammonia. The release of these compounds can contribute to an increase in greenhouse gases in the atmosphere, leading to global warming and climate change. Nitrogen, found abundantly in fertilizers, produces nitrous oxide as a byproduct, the third most significant greenhouse gas after methane and carbon dioxide. These factors are expected to limit the use of chemical-based fertilizers, including ammonium sulfate, in the future.

What Does This Report Include?

This section will provide insights into the contents included in this ammonium sulfate market report and help gain clarity on the structure of the report to assist readers in navigating smoothly.

Ammonium sulfate market qualitative analysis

  • Industry overview

  • Industry trends

  • Market drivers and restraints

  • Market size

  • Growth prospects

  • Porter’s analysis

  • PESTEL analysis

  • Key market opportunities prioritized

  • Competitive landscape

    • Company overview

    • Financial performance

    • Product benchmarking

    • Latest strategic developments

Ammonium sulfate market quantitative analysis

  • Market size, estimates, and forecast from 2018 to 2030

  • Market estimates and forecast for product segments up to 2030

  • Regional market size and forecast for product segments up to 2030

  • Market estimates and forecast for application segments up to 2030

  • Regional market size and forecast for application segments up to 2030

  • Company financial performance

What questions do you have? Get quick response from our industry experts. Request a Free Consultation

Research Methodology

A three-pronged approach was followed for deducing the ammonium sulfate market estimates and forecasts. The process has three steps: information procurement, analysis, and validation. The whole process is cyclical, and steps repeat until the estimates are validated. The three steps are explained in detail below:

Information procurement: Information procurement is one of the most extensive and important stages in our research process, and quality data is critical for accurate analysis. We followed a multi-channel data collection process for ammonium sulfate market to gather the most reliable and current information possible.

  • We buy access to paid databases such as Hoover’s and Factiva for company financials, industry information, white papers, industry journals, SME journals, and more.
  • We tap into Grand View’s proprietary database of data points and insights from active and archived monitoring and reporting.
  • We conduct primary research with industry experts through questionnaires and one-on-one phone interviews.
  • We pull from reliable secondary sources such as white papers and government statistics, published by organizations like WHO, NGOs, World Bank, etc., Key Opinion Leaders (KoL) publications, company filings, investor documents, and more.
  • We purchase and review investor analyst reports, broker reports, academic commentary, government quotes, and wealth management publications for insightful third-party perspectives.

Analysis: We mine the data collected to establish baselines for forecasting, identify trends and opportunities, gain insight into consumer demographics and drivers, and so much more. We utilized different methods of ammonium sulfate market data depending on the type of information we’re trying to uncover in our research.

  • Market Research Efforts: Bottom-up Approach for estimating and forecasting demand size and opportunity, top-down Approach for new product forecasting and penetration, and combined approach of both Bottom-up and Top-down for full coverage analysis.

  • Value-Chain-Based Sizing & Forecasting: Supply-side estimates for understanding potential revenue through competitive benchmarking, forecasting, and penetration modeling.

  • Demand-side estimates for identifying parent and ancillary markets, segment modeling, and heuristic forecasting.

  • Qualitative Functional Deployment (QFD) Modelling for market share assessment.

Market formulation and validation: We mine the data collected to establish baselines for forecasting, identify trends and opportunities, gain insight into consumer demographics and drivers, and so much more. We utilize different methods of data analysis depending on the type of information we’re trying to uncover in our research.

  • Market Formulation: This step involves the finalization of market numbers. This step on an internal level is designed to manage outputs from the Data Analysis step.

  • Data Normalization: The final market estimates and forecasts are then aligned and sent to industry experts, in-panel quality control managers for validation.

  • This step also entails the finalization of the report scope and data representation pattern.

  • Validation: The process entails multiple levels of validation. All these steps run in parallel, and the study is forwarded for publishing only if all three levels render validated results.

Ammonium Sulfate Market Categorization:

The ammonium sulfate market was categorized into three segments, namely product (Solid, Liquid), application (Fertilizers, Pharmaceuticals, Food & Feed Additives, Water Treatment), and regions (North America, Europe, Asia Pacific, Central & South America, Middle East & Africa).

Segment Market Methodology:

The ammonium sulfate market was segmented into product, application, and regions. The demand at a segment level was deduced using a funnel method. Concepts like the TAM, SAM, SOM, etc., were put into practice to understand the demand. We at GVR deploy three methods to deduce market estimates and determine forecasts. These methods are explained below:

Market research approaches: Bottom-up

  • Demand estimation of each product across countries/regions summed up to from the total market.

  • Variable analysis for demand forecast.

  • Demand estimation via analyzing paid database, and company financials either via annual reports or paid database.

  • Primary interviews for data revalidation and insight collection.

Market research approaches: Top-down

  • Used extensively for new product forecasting or analyzing penetration levels.

  • Tool used invoice product flow and penetration models Use of regression multi-variant analysis for forecasting Involves extensive use of paid and public databases.

  • Primary interviews and vendor-based primary research for variable impact analysis.

Market research approaches: Combined

  • This is the most common method. We apply concepts from both the top-down and bottom-up approaches to arrive at a viable conclusion.

Regional Market Methodology:

The ammonium sulfate market was analyzed at a regional level. The globe was divided into North America, Europe, Asia Pacific, Central & South America, and Middle East & Africa, keeping in focus variables like consumption patterns, export-import regulations, consumer expectations, etc. These regions were further divided into seventeen countries, namely, the U.S.; Canada; Mexico; Germany; the UK.; Italy; France; Netherlands; China; India; Japan; Indonesia; Vietnam; Brazil; Argentina; Iran; and Egypt.

All three above-mentioned market research methodologies were applied to arrive at regional-level conclusions. The regions were then summed up to form the global market.

Ammonium sulfate market companies & financials:

The ammonium sulfate market was analyzed via companies operating in the sector. Analyzing these companies and cross-referencing them to the demand equation helped us validate our assumptions and conclusions. Key market players analyzed include:

  • BASF SE - BASF SE, a German-based industrial chemical manufacturing company, caters to a vast customer base of over 300,000 globally. With a strong global presence, the company operates through six major segments: industrial solutions, chemicals, agricultural solutions, materials, nutrition & care, and surface technology. BASF SE is committed to achieving both economic success and environmental protection. It offers customized solutions for heavy-duty vehicles and drives innovation in chemistry for future mobility. Recently, the company has expanded its expertise into predicting automotive color trends to meet the diverse needs of future automotive color coatings. BASF SE's Ludwigshafen facility in Germany currently has a production capacity of 875,000 tons per annum of ammonia.

  • Evonik Industries AG - Evonik Industries AG stands as a prominent manufacturer in the realm of specialty chemicals. The company boasts a diverse range of products, including adhesive and sealing compounds, animal nutrition products, automotive applications, cleaning products, coatings, catalysis, colorants, construction materials, crop protection agents, plastics, plasticizers, personal care products, displays for TVs and computers, water treatment solutions, semiconductors, polyurethane additives, road markings, and processing aids for monomer processes. These products cater to various industries, such as adhesive and sealants, food and beverage, feed, electronics and utilities, interior design, construction, coatings, composites, and agriculture. Additionally, Evonik Industries AG extends its reach to other sectors, including household care, lifestyle, transportation, mechanical engineering, pulp, paper and packaging, printing, professional skin care, plastics and general industry, healthcare and pharmaceutical, petrochemical, personal care, metal, oil and gas, optics, and mining.

  • LANXESS Corporation - LANXESS Corporation is a renowned company specializing in the production and promotion of specialty chemicals, additives, and plastics. With a strong focus on four key sectors, namely specialty additives, advanced intermediates, engineering materials, and consumer protection, LANXESS excels in product development and marketing. One of its notable offerings is ammonium sulfate, derived as a byproduct of caprolactam production. This high-quality product is supplied to global markets in solid and solution forms, utilizing vessels and containers for transportation. With a worldwide presence spanning 33 countries, LANXESS achieved impressive annual sales of USD 7.21 billion in 2020.

  • Novus International - In 1991, Novus International, a chemical company headquartered in the United States, came into existence through the sale of Monsanto's feed ingredients business division to Nippon Soda Co. Ltd. and Mitsui & Co. Ltd. This transaction was a part of Monsanto's nutrition division. With a wide range of over 100 products, Novus International caters to various industries worldwide, including mineral solutions, enzyme solutions, feed, methionine solutions, eubiotics, and carotenoid solutions. The company focuses on key species such as aqua, poultry, swine, dairy, and beef.

  • Sumitomo Chemical Co. Ltd. - Sumitomo Chemical Co. Ltd. is a chemical corporation primarily providing solutions to various industries, including petrochemicals & plastics, pharmaceuticals, crop science, IT chemicals, environment, daily household, automotive, building & construction, and energy & functional materials. It offers a diverse portfolio of products tailored to meet the specific needs of each business segment. The company operates research departments dedicated to each business segment worldwide and actively collaborates with educational institutions and research organizations to foster innovation and advancement.

  • Honeywell International Inc. - Honeywell International Inc. is a manufacturer of commercial and consumer goods. The company operates through four business segments: aerospace, safety & productivity solutions, home & building technologies, and performance materials & technologies. Within these segments, Honeywell offers a diverse range of products and solutions. In the aerospace segment, they provide auxiliary power units, engine control systems, surveillance & radar systems, flight safety equipment, electric power systems, thermal systems, aircraft brakes & wheels, overhaul & repair services, aircraft lighting, and navigation software & hardware. Under the home & building technologies segment, Honeywell offers displays and controls for heating, indoor air quality, cooling, humidification, lighting, home automation, and combustion. They also provide sensors, switches, remote patient monitoring systems, services & solutions for measurement, metering, and control of electricity & gases, as well as communications & metering systems for industries and water utilities. Additionally, Honeywell offers performance materials and technologies such as fluorocarbons, specialty films, hydrofluoro-olefins, waxes, advanced fibers, additives, customized intermediates & research chemicals, chemicals, and electronic materials.

  • Royal DSM - Royal DSM is a multinational corporation based in the Netherlands specializing in life and materials sciences. The company offers practical solutions in the areas of health, nutrition, and sustainable living. It focuses on three key areas: resource and circularity, nutrition and health, and climate and energy. Over the past five years, 21% of its sales have come from newly launched products. Additionally, the company actively partners with the United Nations' Sustainable Development Goals to align its strategic plans with a purpose-driven approach.

  • Helm AG - Helm AG, originally established as a family-owned enterprise, operates as a versatile distribution company catering to various industries, including fertilizers, crop protection, chemicals, and pharmaceuticals. Presently, the company maintains a global presence across 30 countries, encompassing more than 100 subsidiaries. It boasts an integrated approach throughout the value chain, encompassing logistics, marketing solutions, product manufacturing, and project development, among other facets. The company's primary market focus lies within Europe, which accounted for a significant 52.9% share in 2020, followed by the Americas and Asia Pacific regions with shares of 29.6% and 16.8% respectively.

  • ArcelorMittal S.A. - ArcelorMittal S.A. is an international steel manufacturing corporation that operates production facilities in 18 nations and serves customers in 160 countries worldwide. The company's primary focus lies in various sectors, such as construction, mining, and steel manufacturing. It caters to multiple industries, including energy, packaging, automotive, construction, mining, agriculture, transportation, and appliances. During the Latin America awards ceremony, ArcelorMittal was honored with the prestigious title of the top raw material supplier by Fiat Chrysler Automobiles.

  • Tereos S.A. - Tereos S.A. is a conglomerate of agricultural cooperatives that aims to develop alternative energy solutions by utilizing agricultural and industrial waste. The company is dedicated to providing environmentally friendly energy solutions instead of depending on fossil fuels to thrive in the ever-changing ecosystem, thus significantly decreasing the global carbon footprint. Tereos S.A. primarily focuses on energy generation through the use of digesters to produce biogas, the reclamation of cellulose waste, and the recycling of household waste.

Value chain-based sizing & forecasting

Supply Side Estimates

  • Company revenue estimation via referring to annual reports, investor presentations, and Hoover’s.

  • Segment revenue determination via variable analysis and penetration modeling.

  • Competitive benchmarking to identify market leaders and their collective revenue shares.

  • Forecasting via analyzing commercialization rates, pipelines, market initiatives, distribution networks, etc.

Demand side estimates

  • Identifying parent markets and ancillary markets

  • Segment penetration analysis to obtain pertinent

  • revenue/volume

  • Heuristic forecasting with the help of subject matter experts

  • Forecasting via variable analysis

Ammonium Sulfate Market Report Objectives:

  • Understanding market dynamics (in terms of drivers, restraints, & opportunities) in the countries.

  • Understanding trends & variables in the individual countries & their impact on growth and using analytical tools to provide high-level insights into the market dynamics and the associated growth pattern.

  • Understanding market estimates and forecasts (with the base year as 2021, historic information from 2018 to 2020, and forecast from 2022 to 2030). Regional estimates & forecasts for each category are available and are summed up to form the global market estimates.

Ammonium Sulfate Market Report Assumptions:

  • The report provides market value for the base year 2021 and a yearly forecast till 2030 in terms of revenue/volume or both. The market for each of the segment outlooks has been provided on region & country basis for the above-mentioned forecast period.

  • The key industry dynamics, major technological trends, and application markets are evaluated to understand their impact on the demand for the forecast period. The growth rates were estimated using correlation, regression, and time-series analysis.

  • We have used the bottom-up approach for market sizing, analyzing key regional markets, dynamics, & trends for various products and end-users. The total market has been estimated by integrating the country markets.

  • All market estimates and forecasts have been validated through primary interviews with the key industry participants.

  • Inflation has not been accounted for to estimate and forecast the market.

  • Numbers may not add up due to rounding off.

  • Europe consists of EU-8, Central & Eastern Europe, along with the Commonwealth of Independent States (CIS).

  • Asia Pacific includes South Asia, East Asia, Southeast Asia, and Oceania (Australia & New Zealand).

  • Latin America includes Central American countries and the South American continent

  • Middle East includes Western Asia (as assigned by the UN Statistics Division) and the African continent.

Primary Research

GVR strives to procure the latest and unique information for reports directly from industry experts, which gives it a competitive edge. Quality is of utmost importance to us, therefore every year we focus on increasing our experts’ panel. Primary interviews are one of the critical steps in identifying recent market trends and scenarios. This process enables us to justify and validate our market estimates and forecasts to our clients. With more than 8,000 reports in our database, we have connected with some key opinion leaders across various domains, including healthcare, technology, consumer goods, and the chemical sector. Our process starts with identifying the right platform for a particular type of report, i.e., emails, LinkedIn, seminars, or telephonic conversation, as every report is unique and requires a differentiated approach.

We send out questionnaires to different experts from various regions/ countries, which is dependent on the following factors:

  • Report/Market scope: If the market study is global, we send questionnaires to industry experts across various regions, including North America, Europe, Asia Pacific, Latin America, and MEA.

  • Market Penetration: If the market is driven by technological advancements, population density, disease prevalence, or other factors, we identify experts and send out questionnaires based on region or country dominance.

The time to start receiving responses from industry experts varies based on how niche or well-penetrated the market is. Our reports include a detailed chapter on the KoL opinion section, which helps our clients understand the perspective of experts already in the market space.

What questions do you have? Get quick response from our industry experts. Request a Free Consultation
gvr icn

GET A FREE SAMPLE

gvr icn

This FREE sample includes data points, ranging from trend analyses to estimates and forecasts. See for yourself.

gvr icn

NEED A CUSTOM REPORT?

We can customize every report - free of charge - including purchasing stand-alone sections or country-level reports, as well as offer affordable discounts for start-ups & universities. Contact us now

Certified Icon

We are GDPR and CCPA compliant! Your transaction & personal information is safe and secure. For more details, please read our privacy policy.