GVR Report cover Antimicrobial Additives Market Size, Share & Trends Report

Antimicrobial Additives Market Size, Share & Trends Analysis Report By Type (Organic, Inorganic), By Application (Plastics, Paints & Coatings, Pulp & Paper), By End-use, By Region, And Segment Forecasts, 2024 - 2030

  • Report ID: GVR-1-68038-227-3
  • Number of Report Pages: 219
  • Format: PDF, Horizon Databook
  • Historical Range: 2018 - 2021
  • Forecast Period: 2023 - 2030 
  • Industry: Bulk Chemicals

Antimicrobial Additives Market Size & Trends

The global antimicrobial additives market size was valued at USD 3.11 billion in 2023 and is expected to grow at a compound annual growth rate (CAGR) of 9.0% from 2024 to 2030. Swiftly growing population and urbanization coupled with the increasing awareness regarding health-issues in emerging economies of Asia-Pacific are likely to assist end-use industries, which in turn is expected to escalate the demand for antimicrobial additives over the forecast period. The demand for antimicrobial additives is expected to increase majorly in the healthcare and packaging application industry owing to the increase in demand to tackle the COVID-19 pandemic situation around the world. The continuously rising demand of healthcare and packaging products for COVID-19 will positively impact the antimicrobial additives for plastics market. Asia Pacific is expected to dominate the rinsing demand of antimicrobial additives as the region has major healthcare products manufacturer.
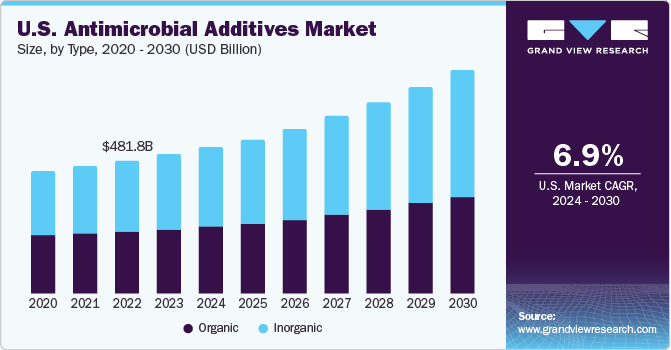
U.S. Antimicrobial Additives Market Size, By Type, 2020 - 2030 (USD Billion)

Japan, India and Indonesia are expected to contribute towards the growth of construction sector in the Asia-Pacific owing to increasing consumer disposable income and rising government spending on large infrastructural projects. Ascending demand for commercial, residential and institutional buildings in China, on account of growing population, is in turn, contributing to the growth of market.

U.S. antimicrobial additives industry is expected to witness moderate growth over the coming years. High demand for advanced healthcare services owing to the availability of well-developed healthcare infrastructure and reimbursement coverage is anticipated to drive the growth of medical devices industry in U.S. Constantly rising patient population on account of aging and an increase in the number of car accidents is projected to propel the need for surgeries. Thus, the country is anticipated to maintain its demand for healthcare antimicrobial additives throughout the forecast period.

However, stringent regulations have made antimicrobial additives suppliers introduce and set up new compositions in order to meet the safe administration and anti-bacterial properties standards such as Biocidal Products Regulation (BPR) EU 528/2012 and Federal Insecticide, Fungicide, and Rodenticide Act (FIFRA). Thus, the presence of stringent regulation is expected to hamper the growth of antimicrobial additive in food science market over the forecast period.

Healthcare segment witnessed high penetration and accounts for a majority of the revenue share in the antimicrobial additives market. This can be attributed to extensive demand for antimicrobial additives for developing infection preventing & sterilized products like surgical tubing, cables, and orthopedic sutures. In addition, growing health awareness among consumers, increasing old age population in countries such as Japan, China, & the U.S., and rising demand for high quality medical equipment is expected to drive the market of antimicrobials additives market.

Market Concentration & Characteristics

The global antimicrobial additives market is highly consolidated in nature with the presence of key players such as NanoBioMatters Industries S.L.; BASF SE; RTP Company; Milliken Chemical; BioCote Limited; as well as a few medium and small regional players operating in different parts of the world.

The companies in the market compete on the basis of product quality offered and the technology used for the production of plastics. Major players, in particular, compete on the basis of application development capability and new technologies used in product formulation. Established players such as BASF SE are investing in research & development activities to formulate new and advanced plastics compounds, which gives them a competitive edge over the other players.
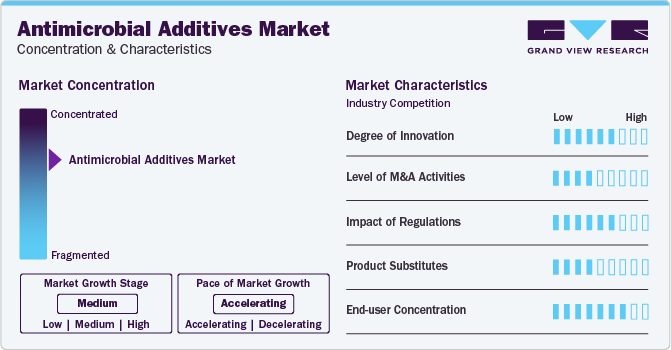
Antimicrobial Additives Industry Dynamics

To maintain strong and healthy competitive environment across the marketspace, the global antimicrobial additives companies manufacturing compounded plastics have implemented various strategic initiatives such as acquisition & merger, new product launch, production expansion, and various others. For instance, in December 2023, Avient Corporation launched their new product line for antimicrobial additives for thermoplastic polyurethane (TPU) films in medical and outdoor applications.

Type Insights

Inorganic type segment led the market and accounted for more than 53.0% share of the global revenue in 2023. High demand silver-based, copper-based, and zinc-based additives is projected to fuel the growth of inorganic segment demand over the forecast period. Silver-based are used as antimicrobial agents owing to their properties such as non-toxicity, continual performance for a long duration, environment-friendly nature, high thermal stability, and protection against microbial growth. Zinc pyrithione is added to the materials that are prone to exposure to mold spore and fungi as the additive offers excellent antibacterial protection. Copper salts provide antimicrobial protection in preservative and sterilized applications with underlying substrates or layers being paints, coatings, and polymers.

Organic antimicrobial additives, when used with products and materials such as paints and coatings, provide long-lasting protection against stain and odor-causing microbes as well as biodegradation. For example, triclosan inhibits the growth of microbes with the help of a chemical reaction, which results in penetrating and damaging their cell walls. As the cell wall perforates and excludes the metabolites, other cell functions are damaged, which prevents microbes such as algae and bacteria from duplicating. The growth of organic antimicrobial additives market is expected to be sluggish over the forecast period due to the ban on the sales and use of OBPA and triclosan, which can be attributed to their high levels of toxicity.

Application Insights

Plastic application segment led the market and accounted for more than 34.0% share of the global revenue in 2023. This high share is attributable to extensive utilization in the production of soap dispensers, food containers, surgical products, and breathing devices owing to the adaptable nature of plastics. Plastic is susceptible to microbial growth including bacteria and mold, which is expected to negatively impact the functional lifetime of a product. Antimicrobial additives are incorporated during the production process of plastics and offer resistance against various microbes, thus, resulting in long-term durability of plastic products.

Antimicrobial additives find their application in all the types of paints and coatings including solvent, water, and oil as well as powder-based coatings. Specialty, industrial, and decorative coatings are considerably benefitted from antimicrobial additives. For instance, silver-based additives give cost-effective protection solutions when used with paints. The additives added in inks and lacquers impart durable top-coat protection when applied on paper, metal and plastic.

Pulp & paper is a highly diverse industry as it comprises specialized papers (intended for currency printing, tissue production and newsprint) and paperboards intended for packaging applications. Paper is prone to the fast accumulation of dirt, which provides an opportunity for microbes to colonize on the paper. Thus, it is crucial that the paper products have microbe-resistant properties before being handled in various end-use applications.

End-use Insights

Healthcare end-use segment led the market and accounted for more than 26.0% share of the global revenue in 2023. This high share is attributable to rising demand of healthcare products due to rising old age population and growing healthcare awareness among the consumers. Healthcare environment plays a key role, especially in Healthcare-Associated Infections (HAIs). HAIs which are additional infections that occur in patients during their stay in hospitals, and fatal and generally caused by antibiotic resistant bacteria.
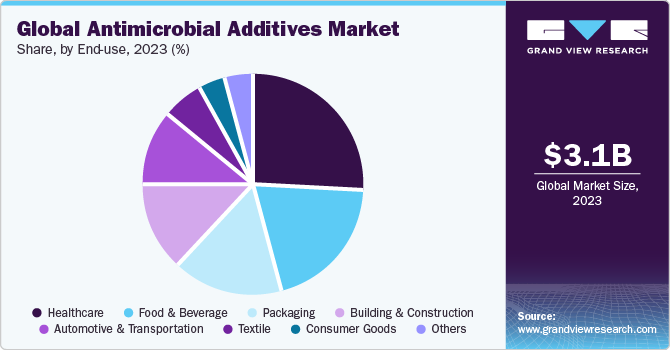
Global Antimicrobial Additives Market Share, By End-Use, 2023 (%)

According to U.S. Department of Health and Human Services, 1 in 25 patients is diagnosed with HAI in the U.S. each year. HAIs can lead to prolonged stay in hospital, readmission after discharge, and increase in expenses of patients. Thus, these challenges have led to increased interest in developing strategies and products to reduce the risk of HAIs. Incorporation of antimicrobial additives in healthcare furnishings and medical equipment is a step toward minimizing the risk of bacteria attack in healthcare environment.

Food & beverage end-use segment is expected to witness above average growth rate over the forecast period supported by continuous utilization of additives in shelving, flooring, food processing equipment, ice making machines, storage containers, water coolers, and water hydration systems in the food & beverage industry. Increasing population and changing lifestyle of consumers is anticipated to drive the demand for antimicrobial additives in the food & beverage sector over the forecast period.

Regional Insights

Asia Pacific dominated the antimicrobial additives market and accounted for over 38.0% share of the global revenue in 2023. The market is driven by the growth of the major end-use industries such as automotive, healthcare, construction, food and beverage, and packaging. Robust manufacturing base of automotive industry in China, Japan, and India coupled with increased sales of passenger vehicles is anticipated to augment antimicrobial additives market growth in the near future. In addition, favorable policies such as foreign direct investments (FDI) and Make in India implemented by the government of India are expected to create ample growth opportunities for automobile industry, which, in turn, is expected to increase the consumption of antimicrobial additives in automobile applications.
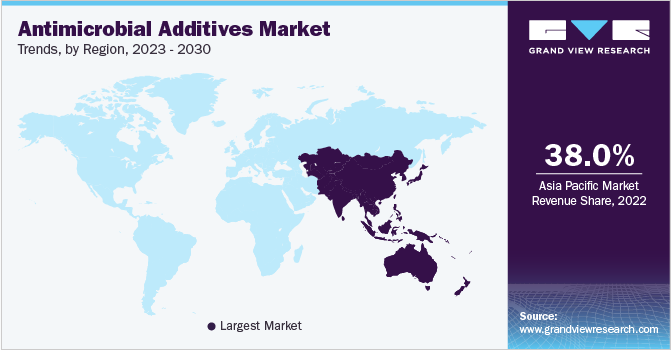
Antimicrobial Additives Market Trends By Region, 2024 - 2030

Industrial expansion in the region is anticipated to augment the demand for antimicrobial additives in industrial machinery, equipment, and containers. Growing construction industry in the emerging economies of Asia Pacific and increased infrastructure spending by the governments of India and China are the key factors responsible for driving the product demand over the forecast period.

The growth of antimicrobial additives market in Asia Pacific is projected to be negatively impacted by COVID-19 as there is limited cross-border trade among the economies. Healthcare end-use segment is driving the demand for antimicrobial additives in the region owing to the rising demand for syringes, surgical drapes, and personal protective clothing. The demand for antimicrobial additives in various end-use segments such as automotive, building & construction, textiles, and consumer goods is expected to grow in the near future, after the current lockdown situation in several country is revoked.

Key Companies & Market Share Insights

Key companies are adopting several organic and inorganic growth strategies, such as capacity expansion, mergers & acquisitions, and joint ventures, to maintain and expand their market share.

  • In March 2023, IFF, a food & beverage product manufacturer announced its strategic partnership with Grupo Drul for the distribution of FermaSure XL across the Brazilian market.

Key Antimicrobial additives Companies:

The following are the leading companies in the antimicrobial additives market. These companies collectively hold the largest market share and dictate industry trends. Financials, strategy maps & products of these antimicrobial additives companies are analyzed to map the supply network.

  • NanoBioMatters Industries S.L
  • BASF SE
  • RTP Company
  • Milliken Chemical
  • BioCote Limited
  • Microban International
  • Clariant AG
  • PolyOne Corporation
  • Momentive Performance Materials Inc.
  • Life Materials Technologies Limited
  • SteriTouch Limited
  • Sanitized AG
  • Dow Inc.
  • LyondellBasell Industries Holdings B.V.
  • Plastics Color Corporation
  • Lonza

Recent Developments

  • In July 2023, BioCote Limited entered into a strategic partnership with Eco Finish to leverage BioCote technology for antimicrobial surfaces in residential & commercial pools. Antimicrobial additives in the solution are purposed to inhibit the growth of bacteria, algae, viruses, and other microbes, delivering additional safety and protection for swimmers.

  • In April 2023, Microban International announced its partnership with Berry Global for introducing Color Scents scented trash bags featuring antimicrobial technology. The partnership was aimed at combining Berry Global’s manufacturing capabilities with Microban’s robust market leadership in antimicrobial technology solutions.

  • In April 2022, Momentive Performance Materials Inc. announced plans to relocate its Tarrytown, New York location and commence a Global Innovation Center (GIC). This new center was planned to feature an advanced R&D lab and office space for fostering better exchange & collaboration of ideas and a development facility for innovative, trend-centric solutions to support the proliferating Performance Additives business.

  • In January 2022, Polygiene AB announced an agreement to acquire SteriTouch. This transaction was aimed at aligning with Polygiene’s new strategy of growth and to leverage Biomaster’s antimicrobial business. 

  • In May 2021, Avient announced the launch of GLS thermoplastic elastomer formulations featuring antimicrobial technology to deliver protection against microbial growth. The antimicrobial additives aid in safeguarding molded plastic components by restricting the growth of bacteria by 99.9% and resisting mold and fungal growth.

  • In May 2021, SteriTouch in collaboration with Enso Rings, launched antimicrobial silicone wedding rings. These rings are available in two style variations, Thin and Standard, and come in an array of sizes and colors. The rings help prevent ring avulsion which is an injury caused by forceful removal of metal rings

  • In March 2021, Lonza Specialty signed a distribution agreement with LifeClean International for the commercialization of healthcare disinfectant solutions in Europe. These solutions deliver short contact time and high antimicrobial capabilities.

Antimicrobial additives Market Report Scope

Report Attribute

Details

Market size value in 2024

USD 3.37 billion

Revenue forecast in 2030

USD 5.63 billion

Growth rate

CAGR of 9.0% from 2024 to 2030

Historical data

2018 - 2022

Forecast period

2024-2030

Quantitative Units

Volume in kilotons, revenue in USD million, and CAGR from 2024 to 2030

Report coverage

Volume forecast, revenue forecast, competitive landscape, growth factors, and trends

Segments covered

Type, application, end-use, region

Regional scope

North America; Europe; Asia Pacific; Central & South America; Middle East & Africa

Country scope

U.S., Canada, Mexico, Germany, UK, France, Italy, Spain, Netherlands, China, India, Japan, South Korea, Malaysia, Singapore, Thailand, Vietnam,Australia, Brazil, Argentina, Saudi Arabia, United Arab Emirates (UAE), South Africa

Key companies profiled

NanoBioMatters Industries S.L, BASF SE, RTP Company, Milliken Chemical, BioCote Limited, Microban International, Clariant AG, PolyOne Corporation, Momentive Performance Materials Inc., Life Materials Technologies Limited, SteriTouch Limited, Sanitized AG, Dow Inc., LyondellBasell Industries Holdings B.V., Plastics Color Corporation, and Lonza

Customization scope

Free report customization (equivalent up to 8 analysts working days) with purchase. Addition or alteration to country, regional & segment scope.

Pricing and purchase options

Avail customized purchase options to meet your exact research needs. Explore purchase options


Global Antimicrobial Additives Market Report Segmentation

This report forecasts revenue and volume growth at the global, regional, and country levels and provides an analysis of the latest industry trends and opportunities in each of the sub-segments from 2018 to 2030. For this study, Grand View Research has segmented the global antimicrobial additives market report based on type, application, end-use, and region:
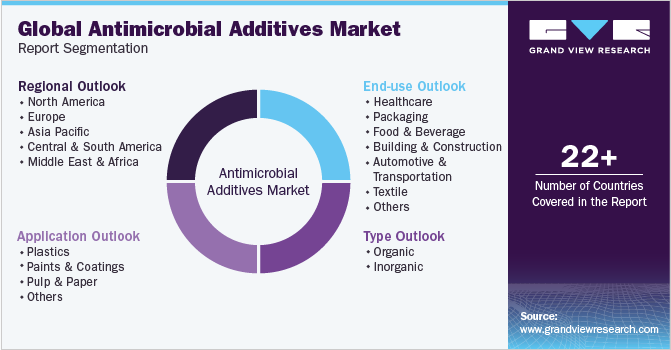
Global Antimicrobial Additives Market Report Segmentation

  • Type Outlook (Volume, Kilotons; Revenue, USD Million, 2018 - 2030)

    • Organic

      • Silver

      • Copper

      • Zinc

    • Inorganic

      • OBPA

      • DCOIT

      • Triclosan

  • Application Outlook (Volume, Kilotons; Revenue, USD Million, 2018 - 2030)

    • Plastics

    • Paints & coatings

    • Pulp & paper

    • Others

  • End-use Outlook (Volume, Kilotons; Revenue, USD Million, 2018 - 2030)

    • Healthcare

    • Food & beverage

    • Packaging

    • Building & construction

    • Automotive & transportation

    • Textile

    • Consumer goods

    • Others

  • Regional Outlook (Volume, Kilotons; Revenue, USD Billion, 2018 - 2030)

    • North America

      • U.S.

      • Canada

      • Mexico

    • Europe

      • Germany

      • UK

      • France

      • Italy

      • Spain

      • Netherlands

    • Asia Pacific

      • China

      • India

      • Japan

      • South Korea

      • Singapore

      • Malaysia

      • Indonesia

      • Thailand

      • Vietnam

      • Australia

    • Central & South America

      • Brazil

      • Argentina

    • Middle East & Africa

      • Saudi Arabia

      • United Arab Emirates (UAE)

      • South Africa

Frequently Asked Questions About This Report

Table of Contents

Chapter 1. Methodology and Scope
                    1.1. Market Segmentation & Scope
                    1.2. Market Definition
                    1.3. Information Procurement
                        1.3.1. Purchased Database
                        1.3.2. GVR’s Internal Database
                        1.3.3. Secondary Sources & Third-Party Perspectives
                        1.3.4. Primary Research
                    1.4. Information Analysis
                        1.4.1. Data Analysis Models
                    1.5. Market Formulation & Data Visualization
                    1.6. Data Validation & Publishing
Chapter 2. Executive Summary
                    2.1. Market Snapshot, 2023
                    2.2. Segment Snapshot, 2023
                    2.3. Competitive Landscape Snapshot
Chapter 3. Antimicrobial additives Market Variables, Trends & Scope
                    3.1. Global Plastics Market Outlook
                    3.2. Industry Value Chain Analysis
                        3.2.1. Raw Material Trends
                    3.3. Regulatory Framework
                    3.4. Market Dynamics
                        3.4.1. Market Driver Analysis
                        3.4.2. Market Restraint Analysis
                        3.4.3. Industry Opportunity Analysis
                        3.4.4. Industry Challenges Analysis
                    3.5. Porter’s Five Forces Analysis
                        3.5.1. Supplier Power
                        3.5.2. Buyer Power
                        3.5.3. Substitution Threat
                        3.5.4. Threat from New Entrant
                        3.5.5. Competitive Rivalry
                    3.6. PESTEL Analysis
                        3.6.1. Political Landscape
                        3.6.2. Economic Landscape
                        3.6.3. Social Landscape
                        3.6.4. Technological Landscape
                        3.6.5. Environmental Landscape
                        3.6.6. Legal Landscape
                    3.7. East European Geopolitical Implication of the Industry Overview
                    3.8. Impact of COVID-19 on antimicrobial additives market
Chapter 4. Antimicrobial additives Market: Type Outlook Estimates & Forecasts
                    4.1. Antimicrobial additives Market: Type Movement Analysis, 2023 & 2030
                    4.2. Organic
                        4.2.1. Antimicrobial additives market estimates and forecast, by organic, 2018 - 2030 (Kilotons) (USD Million)
                    4.3. Inorganic
                        4.3.1. Antimicrobial additives market estimates and forecast, by inorganic, 2018 - 2030 (Kilotons) (USD Million)
Chapter 5. Antimicrobial additives Market: Application Outlook Estimates & Forecasts
                    5.1. Antimicrobial additives Market: Application Movement Analysis, 2023 & 2030
                    5.2. Plastic
                        5.2.1. Antimicrobial additives market estimates and forecast, by plastic, 2018 - 2030 (Kilotons) (USD Million)
                    5.3. Paints & coatings
                        5.3.1. Antimicrobial additives market estimates and forecast, by paints & coatings, 2018 - 2030 (Kilotons) (USD Million)
                    5.4. Pulp & paper
                        5.4.1. Antimicrobial additives market estimates and forecast, by pulp & paper, 2018 - 2030 (Kilotons) (USD Million)
                    5.5. Others
                        5.5.1. Antimicrobial additives market estimates and forecast, by others, 2018 - 2030 (Kilotons) (USD Million)
Chapter 6. Antimicrobial additives Market: End-use Outlook Estimates & Forecasts
                    6.1. Antimicrobial additives Market: End-use Movement Analysis, 2023 & 2030
                    6.2. Healthcare
                        6.2.1. Antimicrobial additives market estimates and forecast, by healthcare, 2018 - 2030 (Kilotons) (USD Million)
                    6.3. Food & beverage
                        6.3.1. Antimicrobial additives market estimates and forecast, by food & beverage, 2018 - 2030 (Kilotons) (USD Million)
                    6.4. Packaging
                        6.4.1. Antimicrobial additives market estimates and forecast, by packaging, 2018 - 2030 (Kilotons) (USD Million)
                    6.5. Building & construction
                        6.5.1. Antimicrobial additives market estimates and forecast, by building & construction, 2018 - 2030 (Kilotons) (USD Million)
                    6.6. Automotive & transportation
                        6.6.1. Antimicrobial additives market estimates and forecast, by automotive & transportation, 2018 - 2030 (Kilotons) (USD Million)
                    6.7. Textile
                        6.7.1. Antimicrobial additives market estimates and forecast, by textile, 2018 - 2030 (Kilotons) (USD Million)
                    6.8. Consumer goods
                        6.8.1. Antimicrobial additives market estimates and forecast, by consumer goods, 2018 - 2030 (Kilotons) (USD Million)
                    6.9. Others
                        6.9.1. Antimicrobial additives market estimates and forecast, by others, 2018 - 2030 (Kilotons) (USD Million)
Chapter 7. Antimicrobial additives Market Regional Outlook Estimates & Forecasts
                    7.1. Regional Movement Analysis & Market Share, 2023 & 2030
                    7.2. Antimicrobial additives Market: Regional Movement Analysis, 2023 & 2030
                    7.3. North America
                        7.3.1. North America Market estimates and forecast, 2018 - 2030 (Kilotons) (USD Million)
                        7.3.2. North America Market estimates and forecast, by type, 2018 - 2030 (Kilotons) (USD Million)
                        7.3.3. North America Market estimates and forecast, by application, 2018 - 2030 (Kilotons) (USD Million)
                        7.3.4. North America Market estimates and forecast, by end-use, 2018 - 2030 (Kilotons) (USD Million)
                        7.3.5. U.S.
                            7.3.5.1. U.S. Market estimates and forecast, 2018 - 2030 (Kilotons) (USD Million)
                            7.3.5.2. U.S. Market estimates and forecast, by type, 2018 - 2030 (Kilotons) (USD Million)
                            7.3.5.3. U.S. Market estimates and forecast, by application, 2018 - 2030 (Kilotons) (USD Million)
                            7.3.5.4. U.S. Market estimates and forecast, by end-use, 2018 - 2030 (Kilotons) (USD Million)
                        7.3.6. Canada
                            7.3.6.1. Canada Market estimates and forecast, 2018 - 2030 (Kilotons) (USD Million)
                            7.3.6.2. Canada Market estimates and forecast, by type, 2018 - 2030 (Kilotons) (USD Million)
                            7.3.6.3. Canada Market estimates and forecast, by application, 2018 - 2030 (Kilotons) (USD Million)
                            7.3.6.4. Canada Market estimates and forecast, by end-use, 2018 - 2030 (Kilotons) (USD Million)
                        7.3.7. Mexico
                            7.3.7.1. Mexico Market estimates and forecast, 2018 - 2030 (Kilotons) (USD Million)
                            7.3.7.2. Mexico Market estimates and forecast, by type, 2018 - 2030 (Kilotons) (USD Million)
                            7.3.7.3. Mexico Market estimates and forecast, by application, 2018 - 2030 (Kilotons) (USD Million)
                            7.3.7.4. Mexico Market estimates and forecast, by end-use, 2018 - 2030 (Kilotons) (USD Million)
                    7.4. Europe
                        7.4.1. Europe Market estimates and forecast, 2018 - 2030 (Kilotons) (USD Million)
                        7.4.2. Europe Market estimates and forecast, by type, 2018 - 2030 (Kilotons) (USD Million)
                        7.4.3. Europe Market estimates and forecast, by application, 2018 - 2030 (Kilotons) (USD Million)
                        7.4.4. Europe Market estimates and forecast, by end-use, 2018 - 2030 (Kilotons) (USD Million)
                        7.4.5. Germany
                            7.4.5.1. Germany Market estimates and forecast, 2018 - 2030 (Kilotons) (USD Million)
                            7.4.5.2. Germany Market estimates and forecast, by type, 2018 - 2030 (Kilotons) (USD Million)
                            7.4.5.3. Germany Market estimates and forecast, by application, 2018 - 2030 (Kilotons) (USD Million)
                            7.4.5.4. Germany Market estimates and forecast, by end-use, 2018 - 2030 (Kilotons) (USD Million)
                        7.4.6. France
                            7.4.6.1. France Market estimates and forecast, 2018 - 2030 (Kilotons) (USD Million)
                            7.4.6.2. France Market estimates and forecast, by type, 2018 - 2030 (Kilotons) (USD Million)
                            7.4.6.3. France Market estimates and forecast, by application, 2018 - 2030 (Kilotons) (USD Million)
                            7.4.6.4. France Market estimates and forecast, by end-use, 2018 - 2030 (Kilotons) (USD Million)
                        7.4.7. UK
                            7.4.7.1. UK Market estimates and forecast, 2018 - 2030 (Kilotons) (USD Million)
                            7.4.7.2. UK Market estimates and forecast, by type, 2018 - 2030 (Kilotons) (USD Million)
                            7.4.7.3. UK Market estimates and forecast, by application, 2018 - 2030 (Kilotons) (USD Million)
                            7.4.7.4. UK Market estimates and forecast, by end-use, 2018 - 2030 (Kilotons) (USD Million)
                        7.4.8. Italy
                            7.4.8.1. Italy Market estimates and forecast, 2018 - 2030 (Kilotons) (USD Million)
                            7.4.8.2. Italy Market estimates and forecast, by type, 2018 - 2030 (Kilotons) (USD Million)
                            7.4.8.3. Italy Market estimates and forecast, by application, 2018 - 2030 (Kilotons) (USD Million)
                            7.4.8.4. Italy Market estimates and forecast, by end-use, 2018 - 2030 (Kilotons) (USD Million)
                        7.4.9. Spain
                            7.4.9.1. Spain Market estimates and forecast, 2018 - 2030 (Kilotons) (USD Million)
                            7.4.9.2. Spain Market estimates and forecast, by type, 2018 - 2030 (Kilotons) (USD Million)
                            7.4.9.3. Spain Market estimates and forecast, by application, 2018 - 2030 (Kilotons) (USD Million)
                            7.4.9.4. Spain Market estimates and forecast, by end-use, 2018 - 2030 (Kilotons) (USD Million)
                        7.4.10. Netherlands
                            7.4.10.1. Netherlands Market estimates and forecast, 2018 - 2030 (Kilotons) (USD Million)
                            7.4.10.2. Netherlands Market estimates and forecast, by type, 2018 - 2030 (Kilotons) (USD Million)
                            7.4.10.3. Netherlands Market estimates and forecast, by application, 2018 - 2030 (Kilotons) (USD Million)
                            7.4.10.4. Netherlands Market estimates and forecast, by end-use, 2018 - 2030 (Kilotons) (USD Million)
                    7.5. Asia Pacific
                        7.5.1. Asia Pacific Market estimates and forecast, 2018 - 2030 (Kilotons) (USD Million)
                        7.5.2. Asia Pacific Market estimates and forecast, by type, 2018 - 2030 (Kilotons) (USD Million)
                        7.5.3. Asia Pacific Market estimates and forecast, by application, 2018 - 2030 (Kilotons) (USD Million)
                        7.5.4. Asia Pacific Market estimates and forecast, by end-use, 2018 - 2030 (Kilotons) (USD Million)
                        7.5.5. China
                            7.5.5.1. China Market estimates and forecast, 2018 - 2030 (Kilotons) (USD Million)
                            7.5.5.2. China Market estimates and forecast, by type, 2018 - 2030 (Kilotons) (USD Million)
                            7.5.5.3. China Market estimates and forecast, by application, 2018 - 2030 (Kilotons) (USD Million)
                            7.5.5.4. China Market estimates and forecast, by end-use, 2018 - 2030 (Kilotons) (USD Million)
                        7.5.6. India
                            7.5.6.1. India Market estimates and forecast, 2018 - 2030 (Kilotons) (USD Million)
                            7.5.6.2. India Market estimates and forecast, by type, 2018 - 2030 (Kilotons) (USD Million)
                            7.5.6.3. India Market estimates and forecast, by application, 2018 - 2030 (Kilotons) (USD Million)
                            7.5.6.4. India Market estimates and forecast, by end-use, 2018 - 2030 (Kilotons) (USD Million)
                        7.5.7. Japan
                            7.5.7.1. Japan Market estimates and forecast, 2018 - 2030 (Kilotons) (USD Million)
                            7.5.7.2. Japan Market estimates and forecast, by type, 2018 - 2030 (Kilotons) (USD Million)
                            7.5.7.3. Japan Market estimates and forecast, by application, 2018 - 2030 (Kilotons) (USD Million)
                            7.5.7.4. Japan Market estimates and forecast, by end-use, 2018 - 2030 (Kilotons) (USD Million)
                        7.5.8. South Korea
                            7.5.8.1. South Korea Market estimates and forecast, 2018 - 2030 (Kilotons) (USD Million)
                            7.5.8.2. South Korea Market estimates and forecast, by type, 2018 - 2030 (Kilotons) (USD Million)
                            7.5.8.3. South Korea Market estimates and forecast, by application, 2018 - 2030 (Kilotons) (USD Million)
                            7.5.8.4. South Korea Market estimates and forecast, by end-use, 2018 - 2030 (Kilotons) (USD Million)
                        7.5.9. Malaysia
                            7.5.9.1. Malaysia Market estimates and forecast, 2018 - 2030 (Kilotons) (USD Million)
                            7.5.9.2. Malaysia Market estimates and forecast, by type, 2018 - 2030 (Kilotons) (USD Million)
                            7.5.9.3. Malaysia Market estimates and forecast, by application, 2018 - 2030 (Kilotons) (USD Million)
                            7.5.9.4. Malaysia Market estimates and forecast, by end-use, 2018 - 2030 (Kilotons) (USD Million)
                        7.5.10. Thailand
                            7.5.10.1. Thailand Market estimates and forecast, 2018 - 2030 (Kilotons) (USD Million)
                            7.5.10.2. Thailand Market estimates and forecast, by type, 2018 - 2030 (Kilotons) (USD Million)
                            7.5.10.3. Thailand Market estimates and forecast, by application, 2018 - 2030 (Kilotons) (USD Million)
                            7.5.10.4. Thailand Market estimates and forecast, by end-use, 2018 - 2030 (Kilotons) (USD Million)
                        7.5.11. Indonesia
                            7.5.11.1. Indonesia Market estimates and forecast, 2018 - 2030 (Kilotons) (USD Million)
                            7.5.11.2. Indonesia Market estimates and forecast, by type, 2018 - 2030 (Kilotons) (USD Million)
                            7.5.11.3. Indonesia Market estimates and forecast, by application, 2018 - 2030 (Kilotons) (USD Million)
                            7.5.11.4. Indonesia Market estimates and forecast, by end-use, 2018 - 2030 (Kilotons) (USD Million)
                        7.5.12. Vietnam
                            7.5.12.1. Vietnam Market estimates and forecast, 2018 - 2030 (Kilotons) (USD Million)
                            7.5.12.2. Vietnam Market estimates and forecast, by type, 2018 - 2030 (Kilotons) (USD Million)
                            7.5.12.3. Vietnam Market estimates and forecast, by application, 2018 - 2030 (Kilotons) (USD Million)
                            7.5.12.4. Vietnam Market estimates and forecast, by end-use, 2018 - 2030 (Kilotons) (USD Million)
                        7.5.13. Australia
                            7.5.13.1. Australia Market estimates and forecast, 2018 - 2030 (Kilotons) (USD Million)
                            7.5.13.2. Australia Market estimates and forecast, by type, 2018 - 2030 (Kilotons) (USD Million)
                            7.5.13.3. Australia Market estimates and forecast, by application, 2018 - 2030 (Kilotons) (USD Million)
                            7.5.13.4. Australia Market estimates and forecast, by end-use, 2018 - 2030 (Kilotons) (USD Million)
                    7.6. Central & South America
                        7.6.1. Central & South America Market estimates and forecast, 2018 - 2030 (Kilotons) (USD Million)
                        7.6.2. Central & South America Market estimates and forecast, by type, 2018 - 2030 (Kilotons) (USD Million)
                        7.6.3. Central & South America Market estimates and forecast, by application, 2018 - 2030 (Kilotons) (USD Million)
                        7.6.4. Central & South America Market estimates and forecast, by end-use, 2018 - 2030 (Kilotons) (USD Million)
                        7.6.5. Brazil
                            7.6.5.1. Brazil Market estimates and forecast, 2018 - 2030 (Kilotons) (USD Million)
                            7.6.5.2. Brazil Market estimates and forecast, by type, 2018 - 2030 (Kilotons) (USD Million)
                            7.6.5.3. Brazil Market estimates and forecast, by application, 2018 - 2030 (Kilotons) (USD Million)
                            7.6.5.4. Brazil Market estimates and forecast, by end-use, 2018 - 2030 (Kilotons) (USD Million)
                        7.6.6. Argentina
                            7.6.6.1. Argentina Market estimates and forecast, 2018 - 2030 (Kilotons) (USD Million)
                            7.6.6.2. Argentina Market estimates and forecast, by type, 2018 - 2030 (Kilotons) (USD Million)
                            7.6.6.3. Argentina Market estimates and forecast, by application, 2018 - 2030 (Kilotons) (USD Million)
                            7.6.6.4. Argentina Market estimates and forecast, by end-use, 2018 - 2030 (Kilotons) (USD Million)
                    7.7. Middle East & Africa
                        7.7.1. Middle East & Africa Market estimates and forecast, 2018 - 2030 (Kilotons) (USD Million)
                        7.7.2. Middle East & Africa Market estimates and forecast, by type, 2018 - 2030 (Kilotons) (USD Million)
                        7.7.3. Middle East & Africa Market estimates and forecast, by application, 2018 - 2030 (Kilotons) (USD Million)
                        7.7.4. Middle East & Africa Market estimates and forecast, by end-use, 2018 - 2030 (Kilotons) (USD Million)
                        7.7.5. Saudi Arabia
                            7.7.5.1. Saudi Arabia Market estimates and forecast, 2018 - 2030 (Kilotons) (USD Million)
                            7.7.5.2. Saudi Arabia Market estimates and forecast, by type, 2018 - 2030 (Kilotons) (USD Million)
                            7.7.5.3. Saudi Arabia Market estimates and forecast, by application, 2018 - 2030 (Kilotons) (USD Million)
                            7.7.5.4. Saudi Arabia Market estimates and forecast, by end-use, 2018 - 2030 (Kilotons) (USD Million)
                        7.7.6. United Arab Emirates (UAE)
                            7.7.6.1. United Arab Emirates (UAE) Market estimates and forecast, 2018 - 2030 (Kilotons) (USD Million)
                            7.7.6.2. United Arab Emirates (UAE) Market estimates and forecast, by type, 2018 - 2030 (Kilotons) (USD Million)
                            7.7.6.3. United Arab Emirates (UAE) Market estimates and forecast, by application, 2018 - 2030 (Kilotons) (USD Million)
                            7.7.6.4. United Arab Emirates (UAE) Market estimates and forecast, by end-use, 2018 - 2030 (Kilotons) (USD Million)
                        7.7.7. South Africa
                            7.7.7.1. South Africa Market estimates and forecast, 2018 - 2030 (Kilotons) (USD Million)
                            7.7.7.2. South Africa Market estimates and forecast, by source, 2018 - 2030 (Kilotons) (USD Million)
                            7.7.7.3. South Africa Market estimates and forecast, 2018 - 2030 (Kilotons) (USD Million)
                            7.7.7.4. South Africa Market estimates and forecast, by type, 2018 - 2030 (Kilotons) (USD Million)
                            7.7.7.5. South Africa Market estimates and forecast, by application, 2018 - 2030 (Kilotons) (USD Million)
                            7.7.7.6. South Africa Market estimates and forecast, by end-use, 2018 - 2030 (Kilotons) (USD Million)
Chapter 8. Competitive Landscape
                    8.1. Recent Developments & Impact Analysis, By Key Market Participants
                    8.2. Company Categorization
                    8.3. Company Market Share/Position Analysis, 2023
                    8.4. Company Heat Map Analysis
                    8.5. Strategy Mapping
                        8.5.1. Expansion
                        8.5.2. Mergers & Acquisition
                        8.5.3. Partnerships & Collaborations
                        8.5.4. New Product Launches
                        8.5.5. Research And Development
                    8.6. Company Profiles
                        8.6.1. NanoBioMatters Industries S.L.
                            8.6.1.1. Participant’s overview
                            8.6.1.2. Financial performance
                            8.6.1.3. Product benchmarking
                            8.6.1.4. Recent developments
                        8.6.2. BASF SE
                            8.6.2.1. Participant’s overview
                            8.6.2.2. Financial performance
                            8.6.2.3. Product benchmarking
                            8.6.2.4. Recent developments
                        8.6.3. RTP Company
                            8.6.3.1. Participant’s overview
                            8.6.3.2. Financial performance
                            8.6.3.3. Product benchmarking
                            8.6.3.4. Recent developments
                        8.6.4. Milliken Chemical
                            8.6.4.1. Participant’s overview
                            8.6.4.2. Financial performance
                            8.6.4.3. Product benchmarking
                            8.6.4.4. Recent developments
                        8.6.5. Clariant AG
                            8.6.5.1. Participant’s overview
                            8.6.5.2. Financial performance
                            8.6.5.3. Product benchmarking
                            8.6.5.4. Recent developments
                        8.6.6. PolyOne Corporation
                            8.6.6.1. Participant’s overview
                            8.6.6.2. Financial performance
                            8.6.6.3. Product benchmarking
                            8.6.6.4. Recent developments
                        8.6.7. Momentive Performance Materials, Inc.
                            8.6.7.1. Participant’s overview
                            8.6.7.2. Financial performance
                            8.6.7.3. Product benchmarking
                            8.6.7.4. Recent developments
                        8.6.8. Life Materials Technologies Limited
                            8.6.8.1. Participant’s overview
                            8.6.8.2. Financial performance
                            8.6.8.3. Product benchmarking
                            8.6.8.4. Recent developments
                        8.6.9. SteriTouch Limited
                            8.6.9.1. Participant’s overview
                            8.6.9.2. Financial performance
                            8.6.9.3. Product benchmarking
                            8.6.9.4. Recent developments
                        8.6.10. Sanitized AG
                            8.6.10.1. Participant’s overview
                            8.6.10.2. Financial performance
                            8.6.10.3. Product benchmarking
                            8.6.10.4. Recent developments
                        8.6.11. Dow, Inc.
                            8.6.11.1. Participant’s overview
                            8.6.11.2. Financial performance
                            8.6.11.3. Product benchmarking
                            8.6.11.4. Recent developments
                        8.6.12. LyondellBasell Industries Holdings B.V.
                            8.6.12.1. Participant’s overview
                            8.6.12.2. Financial performance
                            8.6.12.3. Product benchmarking
                            8.6.12.4. Recent developments
                        8.6.13. Plastics Color Corporation
                            8.6.13.1. Participant’s overview
                            8.6.13.2. Financial performance
                            8.6.13.3. Product benchmarking
                            8.6.13.4. Recent developments
                        8.6.14. Lonza
                            8.6.14.1. Participant’s overview
                            8.6.14.2. Financial performance
                            8.6.14.3. Product benchmarking
                            8.6.14.4. Recent developments


List of Tables

Table 1 Antimicrobial additives Market estimates and forecasts, 2018 - 2030 (Kilotons) (USD Million)
Table 2 Antimicrobial additives Market estimates and forecasts, by organic, 2018 - 2030 (Kilotons) (USD Million)
Table 3 Antimicrobial additives Market estimates and forecasts, by inorganic, 2018 - 2030 (Kilotons) (USD Million)
Table 4 Antimicrobial additives Market estimates and forecasts, by plastics, 2018 - 2030 (Kilotons) (USD Million)
Table 5 Antimicrobial additives Market estimates and forecasts, by paints & coatings, 2018 - 2030 (Kilotons) (USD Million)
Table 6 Antimicrobial additives Market estimates and forecasts, by pulp & paper, 2018 - 2030 (Kilotons) (USD Million)
Table 7 Antimicrobial additives Market estimates and forecasts, by others, 2018 - 2030 (Kilotons) (USD Million)
Table 8 Antimicrobial additives Market estimates and forecasts, by healthcare, 2018 - 2030 (Kilotons) (USD Million)
Table 9 Antimicrobial additives Market estimates and forecasts, by food & beverage, 2018 - 2030 (Kilotons) (USD Million)
Table 10 Antimicrobial additives Market estimates and forecasts, by packaging, 2018 - 2030 (Kilotons) (USD Million)
Table 11 Antimicrobial additives Market estimates and forecasts, by building & construction, 2018 - 2030 (Kilotons) (USD Million)
Table 12 Antimicrobial additives Market estimates and forecasts, by automotive & transportation, 2018 - 2030 (Kilotons) (USD Million)
Table 13 Antimicrobial additives Market estimates and forecasts, by textile, 2018 - 2030 (Kilotons) (USD Million)
Table 14 Antimicrobial additives Market estimates and forecasts, by consumer goods, 2018 - 2030 (Kilotons) (USD Million)
Table 15 Antimicrobial additives Market estimates and forecasts, by others, 2018 - 2030 (Kilotons) (USD Million)
Table 16 North America Antimicrobial additives Market estimates and forecasts, 2018 - 2030 (Kilotons) (USD Million)
Table 17 North America Antimicrobial additives Market estimates and forecasts, by type, 2018 - 2030 (Kilotons) (USD Million)
Table 18 North America Antimicrobial additives Market estimates and forecasts, by application, 2018 - 2030 (Kilotons) (USD Million)
Table 19 North America Antimicrobial additives Market estimates and forecasts, by end-uses, 2018 - 2030 (Kilotons) (USD Million)
Table 20 U.S. Antimicrobial additives Market estimates and forecasts, 2018 - 2030 (Kilotons) (USD Million)
Table 21 U.S. Antimicrobial additives Market estimates and forecasts, by type, 2018 - 2030 (Kilotons) (USD Million)
Table 22 U.S. Antimicrobial additives Market estimates and forecasts, by application, 2018 - 2030 (Kilotons) (USD Million)
Table 23 U.S. Antimicrobial additives Market estimates and forecasts, by end-use, 2018 - 2030 (Kilotons) (USD Million)
Table 24 Canada Antimicrobial additives Market estimates and forecasts, 2018 - 2030 (Kilotons) (USD Million)
Table 25 Canada Antimicrobial additives Market estimates and forecasts, by type, 2018 - 2030 (Kilotons) (USD Million)
Table 26 Canada Antimicrobial additives Market estimates and forecasts, by application, 2018 - 2030 (Kilotons) (USD Million)
Table 27 Canada Antimicrobial additives Market estimates and forecasts, by end-use, 2018 - 2030 (Kilotons) (USD Million)
Table 28 Mexico Antimicrobial additives Market estimates and forecasts, 2018 - 2030 (Kilotons) (USD Million)
Table 29 Mexico Antimicrobial additives Market estimates and forecasts, by type, 2018 - 2030 (Kilotons) (USD Million)
Table 30 Mexico Antimicrobial additives Market estimates and forecasts, by application, 2018 - 2030 (Kilotons) (USD Million)
Table 31 Mexico Antimicrobial additives Market estimates and forecasts, by end-use, 2018 - 2030 (Kilotons) (USD Million)
Table 32 Europe Antimicrobial additives Market estimates and forecasts, 2018 - 2030 (Kilotons) (USD Million)
Table 33 Europe Antimicrobial additives Market estimates and forecasts, by type, 2018 - 2030 (Kilotons) (USD Million)
Table 34 Europe Antimicrobial additives Market estimates and forecasts, by application, 2018 - 2030 (Kilotons) (USD Million)
Table 35 Europe Antimicrobial additives Market estimates and forecasts, by end-uses, 2018 - 2030 (Kilotons) (USD Million)
Table 36 Germany Antimicrobial additives Market estimates and forecasts, 2018 - 2030 (Kilotons) (USD Million)
Table 37 Germany Antimicrobial additives Market estimates and forecasts, by type, 2018 - 2030 (Kilotons) (USD Million)
Table 38 Germany Antimicrobial additives Market estimates and forecasts, by application, 2018 - 2030 (Kilotons) (USD Million)
Table 39 Germany Antimicrobial additives Market estimates and forecasts, by end-use, 2018 - 2030 (Kilotons) (USD Million)
Table 40 UK Antimicrobial additives Market estimates and forecasts, 2018 - 2030 (Kilotons) (USD Million)
Table 41 UK Antimicrobial additives Market estimates and forecasts, by type, 2018 - 2030 (Kilotons) (USD Million)
Table 42 UK Antimicrobial additives Market estimates and forecasts, by application, 2018 - 2030 (Kilotons) (USD Million)
Table 43 UK Antimicrobial additives Market estimates and forecasts, by end-use, 2018 - 2030 (Kilotons) (USD Million)
Table 44 France Antimicrobial additives Market estimates and forecasts, 2018 - 2030 (Kilotons) (USD Million)
Table 45 France Antimicrobial additives Market estimates and forecasts, by type, 2018 - 2030 (Kilotons) (USD Million)
Table 46 France Antimicrobial additives Market estimates and forecasts, by application, 2018 - 2030 (Kilotons) (USD Million)
Table 47 France Antimicrobial additives Market estimates and forecasts, by end-use, 2018 - 2030 (Kilotons) (USD Million)
Table 48 Italy Antimicrobial additives Market estimates and forecasts, 2018 - 2030 (Kilotons) (USD Million)
Table 49 Italy Antimicrobial additives Market estimates and forecasts, by type, 2018 - 2030 (Kilotons) (USD Million)
Table 50 Italy Antimicrobial additives Market estimates and forecasts, by application, 2018 - 2030 (Kilotons) (USD Million)
Table 51 Italy Antimicrobial additives Market estimates and forecasts, by end-use, 2018 - 2030 (Kilotons) (USD Million)
Table 52 Spain Antimicrobial additives Market estimates and forecasts, 2018 - 2030 (Kilotons) (USD Million)
Table 53 Spain Antimicrobial additives Market estimates and forecasts, by type, 2018 - 2030 (Kilotons) (USD Million)
Table 54 Spain Antimicrobial additives Market estimates and forecasts, by application, 2018 - 2030 (Kilotons) (USD Million)
Table 55 Spain Antimicrobial additives Market estimates and forecasts, by end-use, 2018 - 2030 (Kilotons) (USD Million)
Table 56 Netherlands Antimicrobial additives Market estimates and forecasts, 2018 - 2030 (Kilotons) (USD Million)
Table 57 Netherlands Antimicrobial additives Market estimates and forecasts, by type, 2018 - 2030 (Kilotons) (USD Million)
Table 58 Netherlands Antimicrobial additives Market estimates and forecasts, by application, 2018 - 2030 (Kilotons) (USD Million)
Table 59 Netherlands Antimicrobial additives Market estimates and forecasts, by end-use, 2018 - 2030 (Kilotons) (USD Million)
Table 60 Asia Pacific Antimicrobial additives Market estimates and forecasts, 2018 - 2030 (Kilotons) (USD Million)
Table 61 Asia Pacific Antimicrobial additives Market estimates and forecasts, by type, 2018 - 2030 (Kilotons) (USD Million)
Table 62 Asia Pacific Antimicrobial additives Market estimates and forecasts, by application, 2018 - 2030 (Kilotons) (USD Million)
Table 63 Asia Pacific Antimicrobial additives Market estimates and forecasts, by end-uses, 2018 - 2030 (Kilotons) (USD Million)
Table 64 China Antimicrobial additives Market estimates and forecasts, 2018 - 2030 (Kilotons) (USD Million)
Table 65 China Antimicrobial additives Market estimates and forecasts, by type, 2018 - 2030 (Kilotons) (USD Million)
Table 66 China Antimicrobial additives Market estimates and forecasts, by application, 2018 - 2030 (Kilotons) (USD Million)
Table 67 China Antimicrobial additives Market estimates and forecasts, by end-use, 2018 - 2030 (Kilotons) (USD Million)
Table 68 India Antimicrobial additives Market estimates and forecasts, 2018 - 2030 (Kilotons) (USD Million)
Table 69 India Antimicrobial additives Market estimates and forecasts, by type, 2018 - 2030 (Kilotons) (USD Million)
Table 70 India Antimicrobial additives Market estimates and forecasts, by application, 2018 - 2030 (Kilotons) (USD Million)
Table 71 India Antimicrobial additives Market estimates and forecasts, by end-use, 2018 - 2030 (Kilotons) (USD Million)
Table 72 India Antimicrobial additives Market estimates and forecasts, 2018 - 2030 (Kilotons) (USD Million)
Table 73 India Antimicrobial additives Market estimates and forecasts, by type, 2018 - 2030 (Kilotons) (USD Million)
Table 74 India Antimicrobial additives Market estimates and forecasts, by application, 2018 - 2030 (Kilotons) (USD Million)
Table 75 India Antimicrobial additives Market estimates and forecasts, by end-use, 2018 - 2030 (Kilotons) (USD Million)
Table 76 South Korea Antimicrobial additives Market estimates and forecasts, 2018 - 2030 (Kilotons) (USD Million)
Table 77 South Korea Antimicrobial additives Market estimates and forecasts, by type, 2018 - 2030 (Kilotons) (USD Million)
Table 78 South Korea Antimicrobial additives Market estimates and forecasts, by application, 2018 - 2030 (Kilotons) (USD Million)
Table 79 South Korea Antimicrobial additives Market estimates and forecasts, by end-use, 2018 - 2030 (Kilotons) (USD Million)
Table 80 Singapore Antimicrobial additives Market estimates and forecasts, 2018 - 2030 (Kilotons) (USD Million)
Table 81 Singapore Antimicrobial additives Market estimates and forecasts, by source, 2018 - 2030 (Kilotons) (USD Million)
Table 82 Singapore Antimicrobial additives Market estimates and forecasts, by product, 2018 - 2030 (Kilotons) (USD Million)
Table 83 Singapore Antimicrobial additives Market estimates and forecasts, by application, 2018 - 2030 (Kilotons) (USD Million)
Table 84 Malaysia Antimicrobial additives Market estimates and forecasts, 2018 - 2030 (Kilotons) (USD Million)
Table 85 Malaysia Antimicrobial additives Market estimates and forecasts, by source, 2018 - 2030 (Kilotons) (USD Million)
Table 86 Malaysia Antimicrobial additives Market estimates and forecasts, by product, 2018 - 2030 (Kilotons) (USD Million)
Table 87 Malaysia Antimicrobial additives Market estimates and forecasts, by application, 2018 - 2030 (Kilotons) (USD Million)
Table 88 Thailand Antimicrobial additives Market estimates and forecasts, 2018 - 2030 (Kilotons) (USD Million)
Table 89 Thailand Antimicrobial additives Market estimates and forecasts, by source, 2018 - 2030 (Kilotons) (USD Million)
Table 90 Thailand Antimicrobial additives Market estimates and forecasts, by product, 2018 - 2030 (Kilotons) (USD Million)
Table 91 Thailand Antimicrobial additives Market estimates and forecasts, by application, 2018 - 2030 (Kilotons) (USD Million)
Table 92 Vietnam Antimicrobial additives Market estimates and forecasts, 2018 - 2030 (Kilotons) (USD Million)
Table 93 Vietnam Antimicrobial additives Market estimates and forecasts, by source, 2018 - 2030 (Kilotons) (USD Million)
Table 94 Vietnam Antimicrobial additives Market estimates and forecasts, by product, 2018 - 2030 (Kilotons) (USD Million)
Table 95 Vietnam Antimicrobial additives Market estimates and forecasts, by application, 2018 - 2030 (Kilotons) (USD Million)
Table 96 Australia Antimicrobial additives Market estimates and forecasts, 2018 - 2030 (Kilotons) (USD Million)
Table 97 Australia Antimicrobial additives Market estimates and forecasts, by source, 2018 - 2030 (Kilotons) (USD Million)
Table 98 Australia Antimicrobial additives Market estimates and forecasts, by product, 2018 - 2030 (Kilotons) (USD Million)
Table 99 Australia Antimicrobial additives Market estimates and forecasts, by application, 2018 - 2030 (Kilotons) (USD Million)
Table 100 Central & South America Antimicrobial additives Market estimates and forecasts, 2018 - 2030 (Kilotons) (USD Million)
Table 101 Central & South America Antimicrobial additives Market estimates and forecasts, by type, 2018 - 2030 (Kilotons) (USD Million)
Table 102 Central & South America Antimicrobial additives Market estimates and forecasts, by application, 2018 - 2030 (Kilotons) (USD Million)
Table 103 Central & South America Antimicrobial additives Market estimates and forecasts, by end-uses, 2018 - 2030 (Kilotons) (USD Million)
Table 104 Brazil Antimicrobial additives Market estimates and forecasts, 2018 - 2030 (Kilotons) (USD Million)
Table 105 Brazil Antimicrobial additives Market estimates and forecasts, by source, 2018 - 2030 (Kilotons) (USD Million)
Table 106 Brazil Antimicrobial additives Market estimates and forecasts, by product, 2018 - 2030 (Kilotons) (USD Million)
Table 107 Brazil Antimicrobial additives Market estimates and forecasts, by application, 2018 - 2030 (Kilotons) (USD Million)
Table 108 Argentina Antimicrobial additives Market estimates and forecasts, 2018 - 2030 (Kilotons) (USD Million)
Table 109 Argentina Antimicrobial additives Market estimates and forecasts, by source, 2018 - 2030 (Kilotons) (USD Million)
Table 110 Argentina Antimicrobial additives Market estimates and forecasts, by product, 2018 - 2030 (Kilotons) (USD Million)
Table 111 Argentina Antimicrobial additives Market estimates and forecasts, by application, 2018 - 2030 (Kilotons) (USD Million)
Table 112 Middle East & Africa Antimicrobial additives Market estimates and forecasts, 2018 - 2030 (Kilotons) (USD Million)
Table 113 Middle East & Africa Antimicrobial additives Market estimates and forecasts, 2018 - 2030 (Kilotons) (USD Million)
Table 114 Middle East & Africa Antimicrobial additives Market estimates and forecasts, by type, 2018 - 2030 (Kilotons) (USD Million)
Table 115 Middle East & Africa Antimicrobial additives Market estimates and forecasts, by application, 2018 - 2030 (Kilotons) (USD Million)
Table 116 Middle East & Africa Antimicrobial additives Market estimates and forecasts, by end-uses, 2018 - 2030 (Kilotons) (USD Million)
Table 117 Saudi Arabia Antimicrobial additives Market estimates and forecasts, 2018 - 2030 (Kilotons) (USD Million)
Table 118 Saudi Arabia Antimicrobial additives Market estimates and forecasts, by source, 2018 - 2030 (Kilotons) (USD Million)
Table 119 Saudi Arabia Antimicrobial additives Market estimates and forecasts, by product, 2018 - 2030 (Kilotons) (USD Million)
Table 120 Saudi Arabia Antimicrobial additives Market estimates and forecasts, by application, 2018 - 2030 (Kilotons) (USD Million)
Table 121 United Arab Emirates (UAE) Antimicrobial additives Market estimates and forecasts, 2018 - 2030 (Kilotons) (USD Million)
Table 122 United Arab Emirates (UAE) Antimicrobial additives Market estimates and forecasts, by source, 2018 - 2030 (Kilotons) (USD Million)
Table 123 United Arab Emirates (UAE) Antimicrobial additives Market estimates and forecasts, by product, 2018 - 2030 (Kilotons) (USD Million)
Table 124 United Arab Emirates (UAE) Antimicrobial additives Market estimates and forecasts, by application, 2018 - 2030 (Kilotons) (USD Million)
Table 125 South Africa Antimicrobial additives Market estimates and forecasts, 2018 - 2030 (Kilotons) (USD Million)
Table 126 South Africa Antimicrobial additives Market estimates and forecasts, by source, 2018 - 2030 (Kilotons) (USD Million)
Table 127 South Africa Antimicrobial additives Market estimates and forecasts, by product, 2018 - 2030 (Kilotons) (USD Million)
Table 128 South Africa Antimicrobial additives Market estimates and forecasts, by application, 2018 - 2030 (Kilotons) (USD Million)


List of Figures

Fig. 1 Market segmentation
Fig. 2 Information procurement
Fig. 3 Data Analysis Models
Fig. 4 Market Formulation and Validation
Fig. 5 Market snapshot, 2023 (USD Million)
Fig. 6 Segmental outlook- Source, product, and application (2023, USD Million)
Fig. 7 Competitive outlook
Fig. 8 Antimicrobial additives Market, 2018-2030 (Kilotons) (USD Million)
Fig. 9 Value chain analysis
Fig. 10 Market dynamics
Fig. 11 Porter’s Analysis
Fig. 12 PESTEL Analysis
Fig. 13 Antimicrobial additives Market, by type: Key takeaways
Fig. 14 Antimicrobial additives Market, by type: Market share, 2023 & 2030
Fig. 15 Antimicrobial additives Market, by application: Key takeaways
Fig. 16 Antimicrobial additives Market, by application: Market share, 2023 & 2030
Fig. 17 Antimicrobial additives Market, by end-use: Key takeaways
Fig. 18 Antimicrobial additives Market, by end-use: Market share, 2023 & 2030
Fig. 19 Antimicrobial additives Market, by region: Key takeaways
Fig. 20 Antimicrobial additives Market, by region: Market share, 2023 & 2030

What questions do you have? Get quick response from our industry experts. Request a Free Consultation

Market Segmentation

  • Antimicrobial additives type Outlook (Volume, Kilotons; Revenue, USD Million, 2018 - 2030)
    • Organic 
      • Silver
      • Copper
      • Zinc
    • Inorganic
      • OBPA
      • DCOIT
      • Triclosan
  • Antimicrobial additives application Outlook (Volume, Kilotons; Revenue, USD Million, 2018 - 2030)
    • Plastics
    • Paints & coatings
    • Pulp & paper
    • Others
  • Antimicrobial additives end-use Outlook (Volume, Kilotons; Revenue, USD Million, 2018 - 2030)
    • Healthcare
    • Food & beverage
    • Packaging
    • Building & construction
    • Automotive & transportation
    • Textile
    • Consumer goods
    • Others
  • Antimicrobial additives Regional Outlook (Volume, Kilotons; Revenue, USD Million, 2018 - 2030)
    • North America
      • North America Antimicrobial additives Market, By type
        • Organic
          • Silver
          • Copper
          • Zinc
        • Inorganic
          • OBPA
          • DCOIT
          • Triclosan
      • North America Antimicrobial additives Market, By Application
        • Plastic
        • Paints & coatings
        • Pulp & paper
        • Others
      • North America Antimicrobial additives Market, By End-use
        • Healthcare
        • Food & beverage
        • Packaging
        • Building & construction
        • Automotive & transportation
        • Textile
        • Consumer goods
        • Others
      • U.S.
        • U.S. Antimicrobial additives Market, By type
          • Organic
            • Silver
            • Copper
            • Zinc
          • Inorganic
            • OBPA
            • DCOIT
            • Triclosan
        • U.S. Antimicrobial additives Market, By application
          • Plastic
          • Paints & coatings
          • Pulp & paper
          • Others
        • U.S. Antimicrobial additives Market, By end-use
          • Healthcare
          • Food & beverage
          • Packaging
          • Building & construction
          • Automotive & transportation
          • Textile
          • Consumer goods
          • Others
      • Canada
        • Canada Antimicrobial additives Market, By type
          • Organic
            • Silver
            • Copper
            • Zinc
          • Inorganic
            • OBPA
            • DCOIT
            • Triclosan
        • Canada Antimicrobial additives Market, By application
          • Plastic
          • Paints & coatings
          • Pulp & paper
          • Others
        • Canada Antimicrobial additives Market, By end-use
          • Healthcare
          • Food & beverage
          • Packaging
          • Building & construction
          • Automotive & transportation
          • Textile
          • Consumer goods
          • Others
      • Mexico
        • Mexico Antimicrobial additives Market, By type
          • Organic
            • Silver
            • Copper
            • Zinc
          • Inorganic
            • OBPA
            • DCOIT
            • Triclosan
        • Mexico Antimicrobial additives Market, By application
          • Plastic
          • Paints & coatings
          • Pulp & paper
          • Others
        • Mexico Antimicrobial additives Market, By end-use
          • Healthcare
          • Food & beverage
          • Packaging
          • Building & construction
          • Automotive & transportation
          • Textile
          • Consumer goods
          • Others
    • Europe
      • Europe Antimicrobial additives Market, By type
        • Organic
          • Silver
          • Copper
          • Zinc
        • Inorganic
          • OBPA
          • DCOIT
          • Triclosan
      • Europe Antimicrobial additives Market, By application
        • Plastic
        • Paints & coatings
        • Pulp & paper
        • Others
      • Europe Antimicrobial additives Market, By end-use
        • Healthcare
        • Food & beverage
        • Packaging
        • Building & construction
        • Automotive & transportation
        • Textile
        • Consumer goods
        • Others
      • Germany
        • Germany Antimicrobial additives Market, By type
          • Organic
            • Silver
            • Copper
            • Zinc
          • Inorganic
            • OBPA
            • DCOIT
            • Triclosan
        • Germany Antimicrobial additives Market, By application
          • Plastic
          • Paints & coatings
          • Pulp & paper
          • Others
        • Germany Antimicrobial additives Market, By end-use
          • Healthcare
          • Food & beverage
          • Packaging
          • Building & construction
          • Automotive & transportation
          • Textile
          • Consumer goods
          • Others
      • France
        • France Antimicrobial additives Market, By type
          • Organic
            • Silver
            • Copper
            • Zinc
          • Inorganic
            • OBPA
            • DCOIT
            • Triclosan
        • France Antimicrobial additives Market, By application
          • Plastic
          • Paints & coatings
          • Pulp & paper
          • Others
        • France Antimicrobial additives Market, By end-use
          • Healthcare
          • Food & beverage
          • Packaging
          • Building & construction
          • Automotive & transportation
          • Textile
          • Consumer goods
          • Others
      • UK
        • UK Antimicrobial additives Market, By type
          • Organic
            • Silver
            • Copper
            • Zinc
          • Inorganic
            • OBPA
            • DCOIT
            • Triclosan
        • UK Antimicrobial additives Market, By application
          • Plastic
          • Paints & coatings
          • Pulp & paper
          • Others
        • UK Antimicrobial additives Market, By end-use
          • Healthcare
          • Food & beverage
          • Packaging
          • Building & construction
          • Automotive & transportation
          • Textile
          • Consumer goods
          • Others
      • Spain
        • Spain Antimicrobial additives Market, By type
          • Organic
            • Silver
            • Copper
            • Zinc
          • Inorganic
            • OBPA
            • DCOIT
            • Triclosan
        • Spain Antimicrobial additives Market, By application
          • Plastic
          • Paints & coatings
          • Pulp & paper
          • Others
        • Spain Antimicrobial additives Market, By end-use
          • Healthcare
          • Food & beverage
          • Packaging
          • Building & construction
          • Automotive & transportation
          • Textile
          • Consumer goods
          • Others
      • Netherlands
        • Netherlands Antimicrobial additives Market, By type
          • Organic
            • Silver
            • Copper
            • Zinc
          • Inorganic
            • OBPA
            • DCOIT
            • Triclosan
        • Netherlands Antimicrobial additives Market, By application
          • Plastic
          • Paints & coatings
          • Pulp & paper
          • Others
        • Netherlands Antimicrobial additives Market, By end-use
          • Healthcare
          • Food & beverage
          • Packaging
          • Building & construction
          • Automotive & transportation
          • Textile
          • Consumer goods
          • Others
    • Asia Pacific
      • Asia Pacific Antimicrobial additives Market, By type
        • Organic
          • Silver
          • Copper
          • Zinc
        • Inorganic
          • OBPA
          • DCOIT
          • Triclosan
      • Asia Pacific  Antimicrobial additives Market, By application
        • Plastic
        • Paints & coatings
        • Pulp & paper
        • Others
      • Asia Pacific  Antimicrobial additives Market, By end-use
        • Healthcare
        • Food & beverage
        • Packaging
        • Building & construction
        • Automotive & transportation
        • Textile
        • Consumer goods
        • Others
      • China
        • China Antimicrobial additives Market, By type
          • Organic
            • Silver
            • Copper
            • Zinc
          • Inorganic
            • OBPA
            • DCOIT
            • Triclosan
        • China Antimicrobial additives Market, By application
          • Plastic
          • Paints & coatings
          • Pulp & paper
          • Others
        • China Antimicrobial additives Market, By end-use
          • Healthcare
          • Food & beverage
          • Packaging
          • Building & construction
          • Automotive & transportation
          • Textile
          • Consumer goods
          • Others
      • India
        • India Antimicrobial additives Market, By type
          • Organic
            • Silver
            • Copper
            • Zinc
          • Inorganic
            • OBPA
            • DCOIT
            • Triclosan
        • India Antimicrobial additives Market, By application
          • Plastic
          • Paints & coatings
          • Pulp & paper
          • Others
        • India Antimicrobial additives Market, By end-use
          • Healthcare
          • Food & beverage
          • Packaging
          • Building & construction
          • Automotive & transportation
          • Textile
          • Consumer goods
          • Other 
      • Japan
        • Japan Antimicrobial additives Market, By type
          • Organic
            • Silver
            • Copper
            • Zinc
          • Inorganic
            • OBPA
            • DCOIT
            • Triclosan
        • Japan Antimicrobial additives Market, By application
          • Plastic
          • Paints & coatings
          • Pulp & paper
          • Others
        • Japan Antimicrobial additives Market, By end-use
          • Healthcare
          • Food & beverage
          • Packaging
          • Building & construction
          • Automotive & transportation
          • Textile
          • Consumer goods
          • Others
      • South Korea
        • South Korea Antimicrobial additives Market, By type
          • Organic
            • Silver
            • Copper
            • Zinc
          • Inorganic
            • OBPA
            • DCOIT
            • Triclosan
        • South Korea  Antimicrobial additives Market, By application
          • Plastic
          • Paints & coatings
          • Pulp & paper
          • Others
        • South Korea  Antimicrobial additives Market, By end-use
          • Healthcare
          • Food & beverage
          • Packaging
          • Building & construction
          • Automotive & transportation
          • Textile
          • Consumer goods
          • Others
      • Singapore
        • Singapore Antimicrobial additives Market, By type
          • Organic
            • Silver
            • Copper
            • Zinc
          • Inorganic
            • OBPA
            • DCOIT
            • Triclosan
        • Singapore Antimicrobial additives Market, By application
          • Plastic
          • Paints & coatings
          • Pulp & paper
          • Others
        • Singapore Antimicrobial additives Market, By end-use
          • Healthcare
          • Food & beverage
          • Packaging
          • Building & construction
          • Automotive & transportation
          • Textile
          • Consumer goods
          • Others
      • Malaysia
        • Malaysia Antimicrobial additives Market, By type
          • Organic
            • Silver
            • Copper
            • Zinc
          • Inorganic
            • OBPA
            • DCOIT
            • Triclosan
        • Malaysia Antimicrobial additives Market, By application
          • Plastic
          • Paints & coatings
          • Pulp & paper
          • Others
        • Malaysia Antimicrobial additives Market, By end-use
          • Healthcare
          • Food & beverage
          • Packaging
          • Building & construction
          • Automotive & transportation
          • Textile
          • Consumer goods
          • Others
      • Thailand
        • Thailand Antimicrobial additives Market, By type
          • Organic
            • Silver
            • Copper
            • Zinc
          • Inorganic
            • OBPA
            • DCOIT
            • Triclosan
        • Thailand Antimicrobial additives Market, By application
          • Plastic
          • Paints & coatings
          • Pulp & paper
          • Others
        • Thailand Antimicrobial additives Market, By end-use
          • Healthcare
          • Food & beverage
          • Packaging
          • Building & construction
          • Automotive & transportation
          • Textile
          • Consumer goods
          • Others
      • Vietnam
        • Vietnam Antimicrobial additives Market, By type
          • Organic
            • Silver
            • Copper
            • Zinc
          • Inorganic
            • OBPA
            • DCOIT
            • Triclosan
        • Vietnam Antimicrobial additives Market, By application
          • Plastic
          • Paints & coatings
          • Pulp & paper
          • Others
        • Vietnam Antimicrobial additives Market, By end-use
          • Healthcare
          • Food & beverage
          • Packaging
          • Building & construction
          • Automotive & transportation
          • Textile
          • Consumer goods
          • Others 
      • Australia
        • Australia Antimicrobial additives Market, By type
          • Organic
            • Silver
            • Copper
            • Zinc
          • Inorganic
            • OBPA
            • DCOIT
            • Triclosan
        • Australia Antimicrobial additives Market, By application
          • Plastic
          • Paints & coatings
          • Pulp & paper
          • Others
        • Australia Antimicrobial additives Market, By end-use
          • Healthcare
          • Food & beverage
          • Packaging
          • Building & construction
          • Automotive & transportation
          • Textile
          • Consumer goods
          • Others
    • Central & South America
      • Central & South America Antimicrobial additives Market, By type
        • Organic
          • Silver
          • Copper
          • Zinc
        • Inorganic
          • OBPA
          • DCOIT
          • Triclosan
      • Central & South America Antimicrobial additives Market, By application
        • Plastic
        • Paints & coatings
        • Pulp & paper
        • Others
      • Central & South America Antimicrobial additives Market, By end-use
        • Healthcare
        • Food & beverage
        • Packaging
        • Building & construction
        • Automotive & transportation
        • Textile
        • Consumer goods
        • Others
      • Brazil
        • Brazil Antimicrobial additives Market, By type
          • Organic
            • Silver
            • Copper
            • Zinc
          • Inorganic
            • OBPA
            • DCOIT
            • Triclosan
        • Brazil Antimicrobial additives Market, By application
          • Plastic
          • Paints & coatings
          • Pulp & paper
          • Others
        • Brazil Antimicrobial additives Market, By end-use
          • Healthcare
          • Food & beverage
          • Packaging
          • Building & construction
          • Automotive & transportation
          • Textile
          • Consumer goods
          • Others 
      • Argentina
        • Argentina Antimicrobial additives Market, By type
          • Organic
            • Silver
            • Copper
            • Zinc
          • Inorganic
            • OBPA
            • DCOIT
            • Triclosan
        • Argentina Antimicrobial additives Market, By application
          • Plastic
          • Paints & coatings
          • Pulp & paper
          • Others
        • Argentina Antimicrobial additives Market, By end-use
          • Healthcare
          • Food & beverage
          • Packaging
          • Building & construction
          • Automotive & transportation
          • Textile
          • Consumer goods
          • Others
    • Middle East & Africa
      • Middle East & Africa Antimicrobial additives Market, By type
        • Organic
          • Silver
          • Copper
          • Zinc
        • Inorganic
          • OBPA
          • DCOIT
          • Triclosan
      • Middle East & Africa Antimicrobial additives Market, By application
        • Plastic
        • Paints & coatings
        • Pulp & paper
        • Others
      • Middle East & Africa Antimicrobial additives Market, By end-use
        • Healthcare
        • Food & beverage
        • Packaging
        • Building & construction
        • Automotive & transportation
        • Textile
        • Consumer goods
        • Others
      • Saudi Arabia
        • Saudi Arabia Antimicrobial additives Market, By type
          • Organic
            • Silver
            • Copper
            • Zinc
          • Inorganic
            • OBPA
            • DCOIT
            • Triclosan
        • Saudi Arabia Antimicrobial additives Market, By application
          • Plastic
          • Paints & coatings
          • Pulp & paper
          • Others
        • Saudi Arabia  Antimicrobial additives Market, By end-use
          • Healthcare
          • Food & beverage
          • Packaging
          • Building & construction
          • Automotive & transportation
          • Textile
          • Consumer goods
          • Others
      • United Arab Emirates (UAE)
        • United Arab Emirates (UAE) Antimicrobial additives Market, By type
          • Organic
            • Silver
            • Copper
            • Zinc
          • Inorganic
            • OBPA
            • DCOIT
            • Triclosan
        • United Arab Emirates (UAE) Antimicrobial additives Market, By application
          • Plastic
          • Paints & coatings
          • Pulp & paper
          • Others
        • United Arab Emirates (UAE) Antimicrobial additives Market, By end-use
          • Healthcare
          • Food & beverage
          • Packaging
          • Building & construction
          • Automotive & transportation
          • Textile
          • Consumer goods
          • Others
        • South Africa
          • South Africa Antimicrobial additives Market, By type
            • Organic
              • Silver
              • Copper
              • Zinc
            • Inorganic
              • OBPA
              • DCOIT
              • Triclosan
          • South Africa Antimicrobial additives Market, By application
            • Plastic
            • Paints & coatings
            • Pulp & paper
            • Others
          • South Africa Antimicrobial additives Market, By end-use
            • Healthcare
            • Food & beverage
            • Packaging
            • Building & construction
            • Automotive & transportation
            • Textile
            • Consumer goods
            • Others

Antimicrobial Additives Market Dynamics

Driver: Ascending Product Demand in Medical Devices Market

Medical devices require antimicrobial additives as they help in preventing the surfaces of devices, equipment, and implants from microbes. These antimicrobial additives kill the harmful bacteria that lead to infections, including carbapenem-resistant enterobacteriaceae and methicillin-resistant staphylococcus aureus. According to the research conducted by the Centers for Disease Control and Prevention in 2017, approximately 4% of inpatients in acute care hospitals in the U.S. contract at least one health-related infection. Medical devices such as urinary catheters, vascular access devices, or enteral feeding tubes are particularly susceptible to the colonization of bacteria, which can enter the bloodstream. Therefore, as a solution, companies engaged in manufacturing medical devices are increasingly focusing on using antimicrobial masterbatches for blending with medical device polymers as these additives are highly successful in preventing colonization on the surface of device components. Thus, the rising utilization of antimicrobial additives in medical devices is expected to fuel market growth in the forecast period.

Driver: Rising Demand for Antimicrobial Packaging from Various End-Use Industries

Antimicrobial packaging is widely utilized in the food & beverage industry as it is preservative-free, requires minimal processing, and inhibits the growth of microorganisms and thus extends the shelf life of perishable products. Rising consumer awareness regarding health and the ascending need for products with a longer shelf life have resulted in the increased utilization of antimicrobial packaging in the recent past and this trend is expected to continue over the forecast period. Different ways of incorporating antimicrobials in packaging include immobilizing antimicrobials in polymers by using covalent or ion linkages, adopting inherently antimicrobial polymers, coating polymer surfaces with antimicrobials, directly incorporating volatile and non-volatile antimicrobials into polymers, and adding pads/sachets, which have volatile antimicrobial agents, to packages. Antimicrobial additives are used to produce antimicrobial packaging products, which help in the prevention of spoilage of food, beverages, and medicines due to microbial contamination. These additives are incorporated in food packaging structure, and their selection varies depending on the food type. An increase in the number of restaurants and fast-food joints is expected to drive the demand for packaging, thereby increasing the product demand. Moreover, paper packaging for food and medicine requires additives, thus creating huge growth prospects for the antimicrobial additives market.

Restraint: Stringent Environmental Regulations

The use of antimicrobial additives in healthcare products including disposable hygiene products and medical devices is recognized as one of the significant trends in the healthcare market. Stringent regulations have made antimicrobial additives suppliers introduce and set up new compositions to meet the safe administration and anti-bacterial properties standards such as Biocidal Products Regulation (BPR) EU 528/2012 and Federal Insecticide, Fungicide, and Rodenticide Act (FIFRA), are expected to hamper the growth of the antimicrobial additive market over the forecast period. Antimicrobial products are regulated globally to protect the environment and humans from substances that may cause a harmful effect. Antimicrobials, when assimilated into plastics, can be considered ‘treated articles. These articles are treated with a biocidal substance but are not biocidal products, therefore waive many of the regulatory requirements present for biocidal products and active substances for the approval and registration of antimicrobial additives manufacturing and sale, which hinder the growth of the antimicrobial additive market.

What Does This Report Include?

This section will provide insights into the contents included in this antimicrobial additives market report and help gain clarity on the structure of the report to assist readers in navigating smoothly.

Antimicrobial additives market qualitative analysis

  • Industry overview

  • Industry trends

  • Market drivers and restraints

  • Market size

  • Growth prospects

  • Porter’s analysis

  • PESTEL analysis

  • Key market opportunities prioritized

  • Competitive landscape

    • Company overview

    • Financial performance

    • Product benchmarking

    • Latest strategic developments

Antimicrobial additives market quantitative analysis

  • Market size, estimates, and forecast from 2018 to 2030

  • Market estimates and forecast for product segments up to 2030

  • Regional market size and forecast for product segments up to 2030

  • Market estimates and forecast for application segments up to 2030

  • Regional market size and forecast for application segments up to 2030

  • Company financial performance

What questions do you have? Get quick response from our industry experts. Request a Free Consultation

Research Methodology

A three-pronged approach was followed for deducing the antimicrobial additives market estimates and forecasts. The process has three steps: information procurement, analysis, and validation. The whole process is cyclical, and steps repeat until the estimates are validated. The three steps are explained in detail below:

Information procurement: Information procurement is one of the most extensive and important stages in our research process, and quality data is critical for accurate analysis. We followed a multi-channel data collection process for antimicrobial additives market to gather the most reliable and current information possible.

  • We buy access to paid databases such as Hoover’s and Factiva for company financials, industry information, white papers, industry journals, SME journals, and more.
  • We tap into Grand View’s proprietary database of data points and insights from active and archived monitoring and reporting.
  • We conduct primary research with industry experts through questionnaires and one-on-one phone interviews.
  • We pull from reliable secondary sources such as white papers and government statistics, published by organizations like WHO, NGOs, World Bank, etc., Key Opinion Leaders (KoL) publications, company filings, investor documents, and more.
  • We purchase and review investor analyst reports, broker reports, academic commentary, government quotes, and wealth management publications for insightful third-party perspectives.

Analysis: We mine the data collected to establish baselines for forecasting, identify trends and opportunities, gain insight into consumer demographics and drivers, and so much more. We utilized different methods of antimicrobial additives market data depending on the type of information we’re trying to uncover in our research.

  • Market Research Efforts: Bottom-up Approach for estimating and forecasting demand size and opportunity, top-down Approach for new product forecasting and penetration, and combined approach of both Bottom-up and Top-down for full coverage analysis.

  • Value-Chain-Based Sizing & Forecasting: Supply-side estimates for understanding potential revenue through competitive benchmarking, forecasting, and penetration modeling.

  • Demand-side estimates for identifying parent and ancillary markets, segment modeling, and heuristic forecasting.

  • Qualitative Functional Deployment (QFD) Modelling for market share assessment.

Market formulation and validation: We mine the data collected to establish baselines for forecasting, identify trends and opportunities, gain insight into consumer demographics and drivers, and so much more. We utilize different methods of data analysis depending on the type of information we’re trying to uncover in our research.

  • Market Formulation: This step involves the finalization of market numbers. This step on an internal level is designed to manage outputs from the Data Analysis step.

  • Data Normalization: The final market estimates and forecasts are then aligned and sent to industry experts, in-panel quality control managers for validation.

  • This step also entails the finalization of the report scope and data representation pattern.

  • Validation: The process entails multiple levels of validation. All these steps run in parallel, and the study is forwarded for publishing only if all three levels render validated results.

Antimicrobial Additives Market Categorization:

The antimicrobial additives market was categorized into four segments, namely type (Organic, Inorganic), application (Plastics, Paints & Coatings, Pulp & Paper), end-use (Healthcare, Packaging, Food & Beverage, Building & Construction, Automotive & Transportation, Textile, Consumer Goods), and regions (North America, Europe, Asia Pacific, Central & South America, Middle East & Africa).

Segment Market Methodology:

The antimicrobial additives market was segmented into type, application, end-use, and regions. The demand at a segment level was deduced using a funnel method. Concepts like the TAM, SAM, SOM, etc., were put into practice to understand the demand. We at GVR deploy three methods to deduce market estimates and determine forecasts. These methods are explained below:

Market research approaches: Bottom-up

  • Demand estimation of each product across countries/regions summed up to from the total market.

  • Variable analysis for demand forecast.

  • Demand estimation via analyzing paid database, and company financials either via annual reports or paid database.

  • Primary interviews for data revalidation and insight collection.

Market research approaches: Top-down

  • Used extensively for new product forecasting or analyzing penetration levels.

  • Tool used invoice product flow and penetration models Use of regression multi-variant analysis for forecasting Involves extensive use of paid and public databases.

  • Primary interviews and vendor-based primary research for variable impact analysis.

Market research approaches: Combined

  • This is the most common method. We apply concepts from both the top-down and bottom-up approaches to arrive at a viable conclusion.

Regional Market Methodology:

The antimicrobial additives market was analyzed at a regional level. The globe was divided into North America, Europe, Asia Pacific, Central & South America, and Middle East & Africa, keeping in focus variables like consumption patterns, export-import regulations, consumer expectations, etc. These regions were further divided into fourteen countries, namely, the U.S.; Canada; Mexico; Germany; the UK.; France; Italy; China; India; Japan; Brazil; Argentina; GCC Countries; and South Africa

All three above-mentioned market research methodologies were applied to arrive at regional-level conclusions. The regions were then summed up to form the global market.

Antimicrobial additives market companies & financials:

The antimicrobial additives market was analyzed via companies operating in the sector. Analyzing these companies and cross-referencing them to the demand equation helped us validate our assumptions and conclusions. Key market players analyzed include:

  • NanoBioMatters Industries S.L: The company is headquartered in Valencia, Spain, and was established in 2004 to achieve expertise in the fields of organo-clay technology, plastics reinforcement, and bio-based materials. The proprietary technology of NanoBioMatters is based on natural clays which are purified, refined, and modified to ensure compatibility with a variety of polymer systems. The company’s modification technology consists of active functionalities and antimicrobial or antioxidant additives. The production facilities of the company can produce 2500 metric tons/year of additives and 4000 metric tons/year of masterbatches with the help of its modern laboratories for the development of additives in plastics. It offers two major products through its portfolio: standard modified clay additives, namely O2Block Barrier Additives, and functionalized (active) additives, namely BactiBlock. The company has a business presence across key countries including Spain, the U.S., Japan, and India. Its standard modified clay additives are used to improve physical properties in rheology, thermal, barrier, and foaming; whereas, functionalized (active) additives are used as a performance-enhancing carrier and dispersant.

  • BASF SE: BASF SE was established in 1865 and is headquartered in Ludwigshafen, Germany. It is engaged in the production of a broad range of products such as petrochemicals, catalysts, nutrition products, coatings, monomers, intermediates, construction chemicals, performance materials & and chemicals, dispersions & and pigments, crop protection products, personal care chemicals. The company has segregated its business into six segments, namely chemicals, industrial solutions, materials, nutrition and care, surface technologies, and agricultural solutions. It caters its products to various industries including agriculture, automotive & and transportation, pharmaceutical, oil & and gas, food and beverage, and construction. The company is known for its integrated value chain process consisting of raw material manufacturing, processing, and distribution of end products. As of December 2018, its operations are spread across 80 countries with production units in countries of Asia Pacific, Europe, North America, and Africa with about 122,404 employees.

  • RTP Company: RTP was founded in 1982 and is headquartered in Winona, Minnesota, U.S. The privately held company has approximately 18 product plants situated across the globe including Singapore, China, Suzhou, France, Germany, the U.S., and Mexico. The company chooses from over 60 resins and hundreds of additives to design a thermoplastic compound to cater to specific end-use requirements. The company’s customized thermoplastics help with static dissipation, structural reinforcement, greased water resistance, continuous use of high temperatures, UL-recognized flammability, soft-touch over-moldable elastomers, and special color and appearance effects. The company supplies its products to various industries including automotive, healthcare, electrical & and electronics, industrial, and energy. The company offers various functional additive masterbatches along with color products and specialty compounds. These additive masterbatches offer plastic processors optimal functionality at a lesser cost of usage and maximize additive usage.

  • Milliken Chemical: The company was established in 1865 and is headquartered in South Carolina, U.S. The company produces a range of products including additives, specialty silicones, chemical intermediates, colorants, concentrates and masterbatches, solutions, and floor and carpet care. It caters to the needs of several market segments including building and construction, agriculture and turf, coatings, automotive and transportation, comfort, paints and inks, electronics, consumer goods, industrial goods, home and laundry care, medical, and packaging. As of 2018, the company has an employee strength of approximately 9,140 personnel across the globe. The company has a significant market presence in countries including the U.S., Singapore, China, India, Belgium, Brazil, and Mexico.

  • BioCote Limited: The firm was founded in 1994 and is headquartered in the UK. The company is a supplier of antimicrobial technology, which protects against microbes such as bacteria and mold. The HACCP-approved company caters to the needs of around 50 countries. The company’s antimicrobial additives include silver, zinc, copper, and organics. These additives are used in plastics & polymers, paints & coatings, textiles & fabrics, paper, and ceramics.

  • Microban International: Microban was founded in 1984 and is headquartered in North Carolina, U.S. The company is engaged in offering antimicrobial technologies and odor control solutions. SilverShield, ZPTech, AEGIS, Excalibur, Scentry Revive, and Scentry are some of the major brands offered by the company. It offers over 1000 products worldwide and has operations in the U.S., Hong Kong, China, and the UK. It caters to approximately 250 clients in 30 countries. Since 2011, the company has been operating as a subsidiary of Barr Brands International, which uses distinguished technologies to enhance consumer, textile, industrial, and medical products across the globe.

  • Clariant AG: The company was founded in 1995 and is headquartered in Muttenz, Switzerland. The company is engaged in offering specialty chemical products. It operates in business areas namely care chemicals, natural resources, catalysis, and plastics & coatings. The business units of the company include additives, catalysts, masterbatches, functional minerals, electronic materials, oil & mining services, industrial & consumer specialties, pigments, and biotech & bio-based chemicals. Cesa-antimicro, a product offered by the company, is an antimicrobial additive that is used in products requiring long-lasting antimicrobial action and for engineering polymers, which are processed at high temperatures. As of 2018, the company employed approximately 17,901 employees with a vast global network in 53 countries.

  • Avient Corporation: Avient Corporation, formerly known as PolyOne Corporation, was founded in 1927 and is headquartered in Ohio, U.S. The company changed its name to Avient Corporation after the complete acquisition of the color masterbatch business of Clariant and Clariant Chemicals India, Ltd. in July 2020. Its business segments include color, additives & inks, specialty engineered and sustainable materials, and distribution services. The company’s product portfolio caters to multiple industries such as building & construction, electrical & electronics, healthcare, packaging, textile, and transportation. Avient Corporation uses different distribution channels such as direct sales personnel, distributors, and commissioned sales agents. It is listed on the New York Stock Exchange. As of 2020, the company had an employee base of 8,400 personnel, along with 61 manufacturing sites and 8 distribution facilities across the globe in regions including Asia Pacific, South America, Europe, and North America.

  • Momentive Performance Materials Inc.: The company was established in 2006 and its global headquarters is located in New York, U.S. The company is engaged in offering silicones and advanced materials. The product portfolio of the company includes adhesives & sealants additives, adhesives & sealants, antifoams, ceramics, coatings, coatings additives, coupling, crosslinking & adhesion promotion, demulsifiers & non elastomers, elastomers, emulsions, encapsulants, gels & potting, fluids mechanical, grease, modifiers, mold release agents, plastic additives, quartz, resins, softeners, super spreaders, urethane additives, and water repellent. < Back to Table of Contents Antimicrobial Additives Market ©Grand View Research, Inc. 198 The wide range of product portfolio of the company caters to various industries including aerospace, agriculture, automotive, beauty & personal, building & construction, consumer goods, electrical transmission & distribution, electronics, food processing & packaging, furniture bedding & carpets, healthcare, home appliances, oil & gas, packaging & converting, renewable energy, transportation, tire & rubber, and textile leather & nonwoven.

  • Life Materials Technologies Limited: Life Materials Technologies Limited is a privately held company with a presence in Hong Kong and Thailand. The material technology company’s core activities include developing and producing antimicrobial additives and treatments for the manufacturers of ceramics, plastics, paper, coatings, and textiles. The company’s products are used to prevent mold in building products, reduce bacterial odors in textiles, inhibit the growth of allergy-inducing molds in bedding and carpeting, and inhibit bacterial growth in food handling areas.

Value chain-based sizing & forecasting

Supply Side Estimates

  • Company revenue estimation via referring to annual reports, investor presentations, and Hoover’s.

  • Segment revenue determination via variable analysis and penetration modeling.

  • Competitive benchmarking to identify market leaders and their collective revenue shares.

  • Forecasting via analyzing commercialization rates, pipelines, market initiatives, distribution networks, etc.

Demand side estimates

  • Identifying parent markets and ancillary markets

  • Segment penetration analysis to obtain pertinent

  • revenue/volume

  • Heuristic forecasting with the help of subject matter experts

  • Forecasting via variable analysis

Antimicrobial Additives Market Report Objectives:

  • Understanding market dynamics (in terms of drivers, restraints, & opportunities) in the countries.

  • Understanding trends & variables in the individual countries & their impact on growth and using analytical tools to provide high-level insights into the market dynamics and the associated growth pattern.

  • Understanding market estimates and forecasts (with the base year as 2022, historic information from 2018 to 2021, and forecast from 2023 to 2030). Regional estimates & forecasts for each category are available and are summed up to form the global market estimates.

Antimicrobial Additives Market Report Assumptions:

  • The report provides market value for the base year 2022 and a yearly forecast till 2030 in terms of revenue/volume or both. The market for each of the segment outlooks has been provided on region & country basis for the above-mentioned forecast period.

  • The key industry dynamics, major technological trends, and application markets are evaluated to understand their impact on the demand for the forecast period. The growth rates were estimated using correlation, regression, and time-series analysis.

  • We have used the bottom-up approach for market sizing, analyzing key regional markets, dynamics, & trends for various products and end-users. The total market has been estimated by integrating the country markets.

  • All market estimates and forecasts have been validated through primary interviews with the key industry participants.

  • Inflation has not been accounted for to estimate and forecast the market.

  • Numbers may not add up due to rounding off.

  • Europe consists of EU-8, Central & Eastern Europe, along with the Commonwealth of Independent States (CIS).

  • Asia Pacific includes South Asia, East Asia, Southeast Asia, and Oceania (Australia & New Zealand).

  • Latin America includes Central American countries and the South American continent

  • Middle East includes Western Asia (as assigned by the UN Statistics Division) and the African continent.

Primary Research

GVR strives to procure the latest and unique information for reports directly from industry experts, which gives it a competitive edge. Quality is of utmost importance to us, therefore every year we focus on increasing our experts’ panel. Primary interviews are one of the critical steps in identifying recent market trends and scenarios. This process enables us to justify and validate our market estimates and forecasts to our clients. With more than 8,000 reports in our database, we have connected with some key opinion leaders across various domains, including healthcare, technology, consumer goods, and the chemical sector. Our process starts with identifying the right platform for a particular type of report, i.e., emails, LinkedIn, seminars, or telephonic conversation, as every report is unique and requires a differentiated approach.

We send out questionnaires to different experts from various regions/ countries, which is dependent on the following factors:

  • Report/Market scope: If the market study is global, we send questionnaires to industry experts across various regions, including North America, Europe, Asia Pacific, Latin America, and MEA.

  • Market Penetration: If the market is driven by technological advancements, population density, disease prevalence, or other factors, we identify experts and send out questionnaires based on region or country dominance.

The time to start receiving responses from industry experts varies based on how niche or well-penetrated the market is. Our reports include a detailed chapter on the KoL opinion section, which helps our clients understand the perspective of experts already in the market space.

What questions do you have? Get quick response from our industry experts. Request a Free Consultation
pdf icn

GET A FREE SAMPLE

arrow icn

This FREE sample includes data points, ranging from trend analyses to estimates and forecasts. See for yourself.

gvr icn

NEED A CUSTOM REPORT?

We can customize every report - free of charge - including purchasing stand-alone sections or country-level reports, as well as offer affordable discounts for start-ups & universities. Contact us now

Certified Icon

We are GDPR and CCPA compliant! Your transaction & personal information is safe and secure. For more details, please read our privacy policy.