The global textile market size was valued at USD 1,837.27 billion in 2023 and is anticipated to grow at a compound annual growth rate (CAGR) of 7.4% in revenue from 2024 to 2030. The ever-increasing apparel demand from the fashion industry and the meteoric growth of e-commerce platforms are expected to drive market growth over the forecast period. The textile industry works on three major principles: designing, producing, and distributing different flexible materials such as yarn and clothing. Many processes, such as knitting, crocheting, weaving, and others, are primarily used to manufacture a wide range of finished and semi-finished goods in bedding, clothing, apparel, medical, and other accessories.
The U.S. is anticipated to be the largest market for textiles in the North American region. It is one of the largest producers, raw cotton exporters, and top raw textile importers. Fashion is the largest application segment in the region, owing to the fast-changing fashionable trends and ease of adoption due to the rapidly emerging online fast fashion companies.
There has been an increasing trend in the use of smart textiles in the market that use optical fibers, metals, and various conductive polymers to interact with the environment. These helps detect and react to various physical stimuli such as mechanical, thermal, or chemical & electric sources. This is expected to propel the growth of the technical application segment in the textiles market during the forecast period.
The rapidly growing consumer preference towards sustainable products is forcing major textile companies to focus on restructuring their business and investing in manufacturing practices that target sustainable products. For instance, DuPont’s plant-based faux fur for performance fashion apparel and Eastman’s usage of discarded carpets in new materials is expected to open several major industry avenues over the forecast period.
Fashion is gaining increasingly higher importance in consumers’ lifestyles. This can be attributed to the constant exposure to advertisements that results in impulsive buying. In addition, social media is another major factor adding to the rising demand for fashionable wear. Companies such as H&M and Zara are utilizing social media platforms to reach potential customers and gain higher market shares.
The recent coronavirus pandemic has acted as a restraint to the global market growth for textiles. Global trade restrictions due to a disrupted supply chain and the decline in textile product consumption amid the imposed lockdowns further negatively impacted the market progress. However, the industry is expected to recover strongly during the forecast period, aided by government support and increasing public awareness regarding effective precautionary measures.
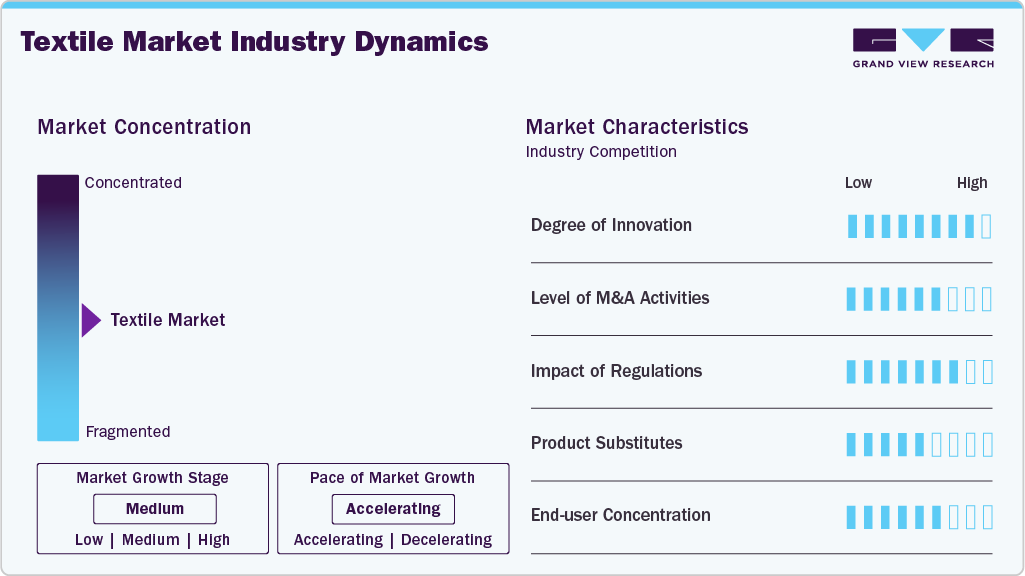
Market growth stage is medium, and pace of the market growth is accelerating.The market is fragmented due to several small- and medium-sized manufacturers, especially in countries such as China and India. Moreover, the easy availability of low-cost labor, coupled with strengthening government support to establish the business units of various major players in these countries, is expected to bring healthy growth to the market.
The textile industry utilizes a number of technologies to manufacture textile products for their use in applications including household, technical, fashion, and others. The major technologies incorporated by the textile manufacturers include spun bond, melt-blown, air-laid, needle punch, wet-laid, and others.
Expanding application scope of textiles in the formulation of products related to oil & gas, automotive, and aerospace industries is expected to remain a favorable factor for the market. Furthermore, technological advancement, in terms of the development of textile products based on spider silk and aramid fiber, is expected to reduce the importance of substitutes. However, high ease of incorporation of metal and plastics in manufacturing industrial products, including automotive vehicles and machines, is expected to remain a considerable threat of substitution to the global textile market.
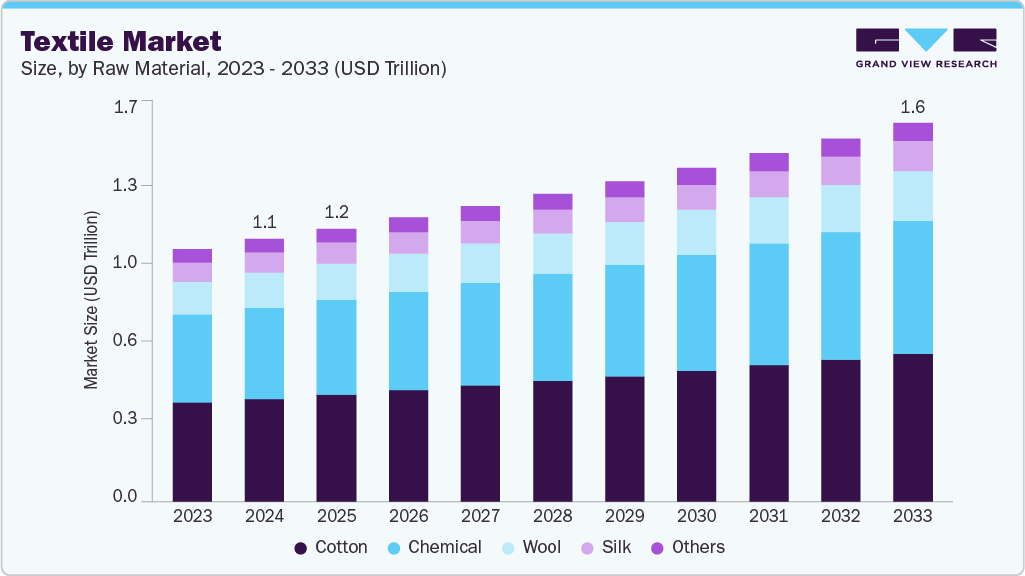
The cotton segment led the market and accounted for over 38% of the overall revenue share in 2023. Cotton is the world’s most important natural fiber, attributed to its superior properties, such as high strength, absorption, and color retention. China, India, and the U.S. primarily produce cotton and cotton-based products worldwide.
The expansion of the textile industry, on account of the rising demand for garments and apparel in these countries, is likely to augment the demand for cotton, which is expected to drive segment growth over the forecast period. According to a report published by the Textile Exchange, more than 95% of all industry-grade cotton is grown in Brazil, India, China, Pakistan, the U.S., Australia, Cameroon, and Côte d’Ivoire.
Chemical-based textile plays an essential role in the textile manufacturing industry. Though chemicals are hazardous to human health and the environment, they are extensively used as mercerizing agents, neutralizers, leveling agents, binders, thickeners, and stain-removers in the textile industry.
Wool-based textiles segment is expected to grow at a significant rate over the forecast period. Wool, primarily composed of hydrogen, carbon, sulfur, and nitrogen, is extensively used to manufacture insulation products such as winter wear, blankets, carpeting, upholstery, etc. In addition, the same raw material-based products are used to absorb odor and noise in heavy machinery, thereby contributing to the growth of the technical application segment.
Some other raw materials used in the production of textiles are silk, minerals such as glass fibers and asbestos, and other synthetic materials. Silk finds extensive use in manufacturing clothing items, surgical sutures, parachutes, silk comforters, and other products having high strength and elasticity, which is expected to drive the segment growth over the forecast period.
The natural fibers product segment led the market in 2023 because of their extensive use in diverse applications of the fashion and apparel industry. Increasing environmental concerns, coupled with the continued consumer shift to use sustainable products, is further expected to increase the demand for natural fibers, thereby driving the growth of the overall global textiles market size over the coming years.
The surging demand for natural fibers from the apparel and fashion industries is expected to be a key driver for the growth of segment of the global textile market over the forecast period. However, these fibers are costlier than synthetic fibers, which can act as an obstacle to the growth of the natural fibers segment of the textiles market.
Polyester is expected to grow at significant rate over the forecast period. This growth can be attributed to its beneficial properties such as high strength, chemical & wrinkle resistance, and quick drying. It is used in households as cushioning & insulating material in pillows and in industries for making carpets, air filters, coated fabrics, and other products.
Nylon is widely used in apparel and home-furnishing applications owing to its high resilience, elasticity, and moisture-absorbing properties. In addition, it acts as a substitute for silk-based products such as women’s stockings, parachutes, flak vests, and others.
The other product segment includes polyethylene (PE), polypropylene (PP), aramid, and polyamide. Properties such as high resistance against acids & alkalis at high temperatures and minimum moisture retention have increased the demand for polyethylene in the market for textiles. Additionally, the use of polypropylene in the textile industry further enhances the market’s growth.
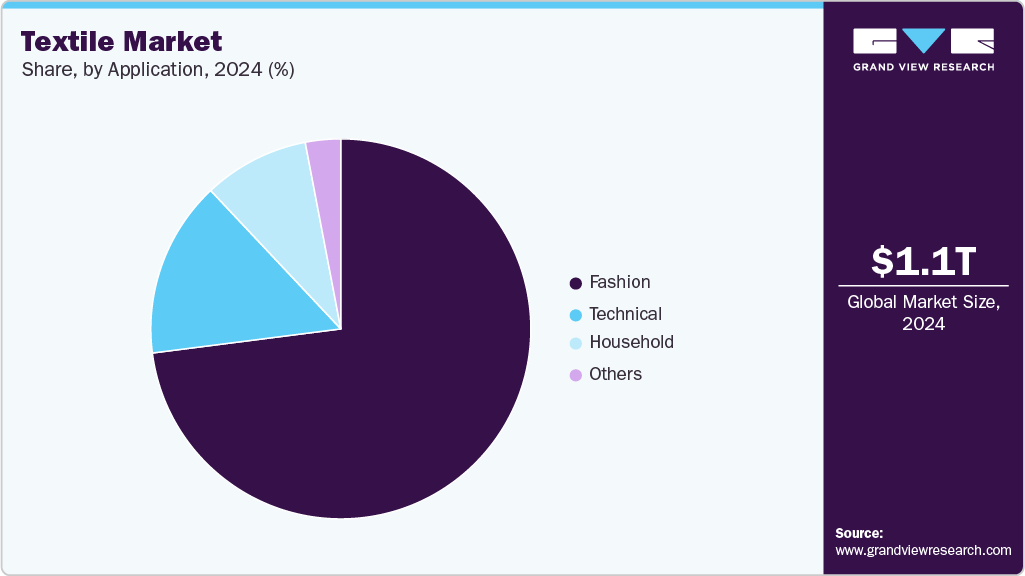
The fashion segment dominated the market in 2023, owing to the increasing consumer spending on clothing and apparel. In addition, high consumer requirements for crease-free suiting & shirting fabrics and quality dyed & printed fabrics across the globe are likely to drive the global market demand for textiles over the forecast period.
An increase in demand for formal & casual wear and other fashionable clothing among all age groups in the global population is a major driver for the textiles market growth. Moreover, increasing population and urbanization in emerging economies such as India, Bangladesh, Vietnam, Brazil, and others will likely propel the demand for clothing and apparel, positively contributing to market advancement.
Demand for textiles in the technical segment is expected to grow at the fastest rate over the projected period, owing to its high-performance properties and end-user applications. In addition, increasing application in construction, transportation, medical and protective clothing have boosted their use, consequently driving the textiles market.
The use of textiles in different areas of a household is one of the prominent growth drivers. This includes its utilization in bedding, upholstery, carpets, kitchen cloths, towels, and others. In addition, the high consumption of natural fibers, such as linen and cotton, along with synthetic fibers used for household textiles, further propels the segment’s growth.
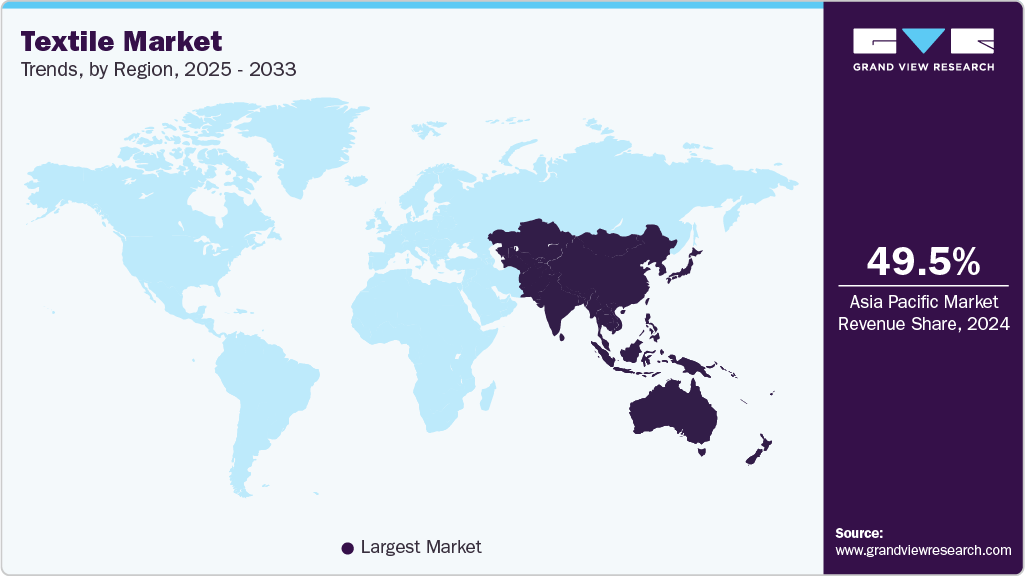
The Asia Pacific region dominated the market with a revenue share of more than 53% in 2023, owing to the increasing sales volume of clothing and apparel goods. The increasing population is expected to result in further substantial growth of the region. In addition, the presence of many customers on e-commerce platforms buying clothing and related accessories in developing economies is further driving the growth of the overall textiles market.
Increased penetration of organized retail, favorable demographics, rising income levels, and favorable government policies are expected to drive the demand for textiles, especially in countries such as India, Bangladesh, Pakistan, and others. For instance, in India, 100 percent foreign direct investment (FDI) is allowed in textiles, which is expected to propel regional market growth over the forecast period.
North America is expected to witness fast-paced growth in the coming years due to the growing industrial manufacturing and the rising number of product launches in the sports and fashion industries. The U.S. is expected to remain a significant cotton producer in the industry, owing to rising textile product demand from various end-use sectors. The textile market is witnessing a huge product demand for industrial manufacturing and from the home textile sector owing to the increase in awareness about the uses of technical textiles.
The market textile in Europe is expected to expand at a significant rate over the forecast period. This growth can be attributed to favorable government policies and trade agreements, such as free-trade agreements and the Euro-Mediterranean Dialogue in the textile and clothing industry.
The demand for textiles in North America and Central & South America will likely witness promising growth over the projected period, owing to the rapidly rising popularity of sports & apparel and home-furnishing textile products. In addition, the consumption of textile fibers, such as synthetic and cellulose fibers, needed for filtration in industrial applications is expected to impact the market growth over the forecast period positively.
The market for textiles has been witnessing a rising trend through strategies such as geographical expansions and mergers & acquisitions. Companies are trying to increase their sales through various government trade agreements and partnerships with e-commerce portals such as Amazon, flip kart, eBay, and others.
In December 2023, RSWM announced the acquisition of Ginni Filaments, an India based producer of combed cotton & open-end yarns. This acquisition will help RSWN to enhance its productivity and product diversity to cater to its premium customers.
In August 2022, American Textile Company (ATC) recently opened a technology center in Pittsburgh, U.S. as part of a digital transformation which expands to its manufacturing operations.The new location encourages collaboration through an open design and balances openness with areas for employee focus.
Report Attribute |
Details |
Market size value in 2024 |
USD 1,983.92 billion |
Revenue forecast in 2030 |
USD 3,047.23 billion |
Growth Rate |
CAGR of 7.4% from 2024 to 2030 |
Historical data |
2018 - 2023 |
Forecast period |
2024 - 2030 |
Quantitative units |
Volume in Million tons, Revenue in USD Billion/million and CAGR from 2023 to 2030 |
Report coverage |
Volume forecast, revenue forecast, company ranking, competitive landscape, growth factors, and trends |
Segments covered |
Raw-material, product, application, region |
Regional scope |
North America, Europe, Asia Pacific, South America, and Middle East & Africa |
Country scope |
U.S., Canada, Mexico, Germany, U.K., France, Russia, Turkey, Italy, China, India, Japan, Australia, Saudi Arabia, Iran, Brazil |
Key companies profiled |
BSL Limited, INVISTA S.R.L., Lu Thai Textile Co., Ltd., Paramount Textile Limited, Paulo de Oliveira, S.A., Successori REDA S.p.A., Shadong Jining Ruyi Woolen Textile Co. Ltd., Shandong Demian Incorporated Company, Shijiazhuang Changshan Textile Co., Ltd, Weiqiao Textile Company Limited, DBL Group, B.D. Textile Mills Pvt. Ltd., IBENA Inc., Heytex Bramsche GmbH, Bahariye AS, Fratelli Balli S.p.A., İpekiş Mensucat Türk A.Ş, Lakhmi Woollen Mills, Wilh. Wülfing GmbH & Co. KG, Lanificio F.lli Cerruti, Özlem Kumaş, Ltd., Trabaldo Togna S.p.A., Yünsa Yünlü Sanayi ve Ticaret A.Ş., Xinhui Woollen Textile Co., Ltd., O'Formula Co., Ltd., Wuxi Xiexin Group Co., Ltd., The Bombay Dyeing & Mfg. Co., Ltd, Huafu Top Dyed Melange Yarn Co., Ltd., Mayur Fabrics, Solvay S.A., Sinopec Yizheng Chemical Fibre Company Limited, Li & Fung Group, JCT Limited |
Customization scope |
Free report customization (equivalent up to 8 analysts working days) with purchase. Addition or alteration to country, regional & segment scope. |
Pricing and purchase options |
Avail customized purchase options to meet your exact research needs. Explore purchase options |
This report forecasts revenue growth at global, regional & country levels and provides an analysis on the industry trends in each of the sub-segments from 2018 to 2030. For the purpose of this study, Grand View Research has segmented the global textile market report on the basis of raw-material, product, application, and region:
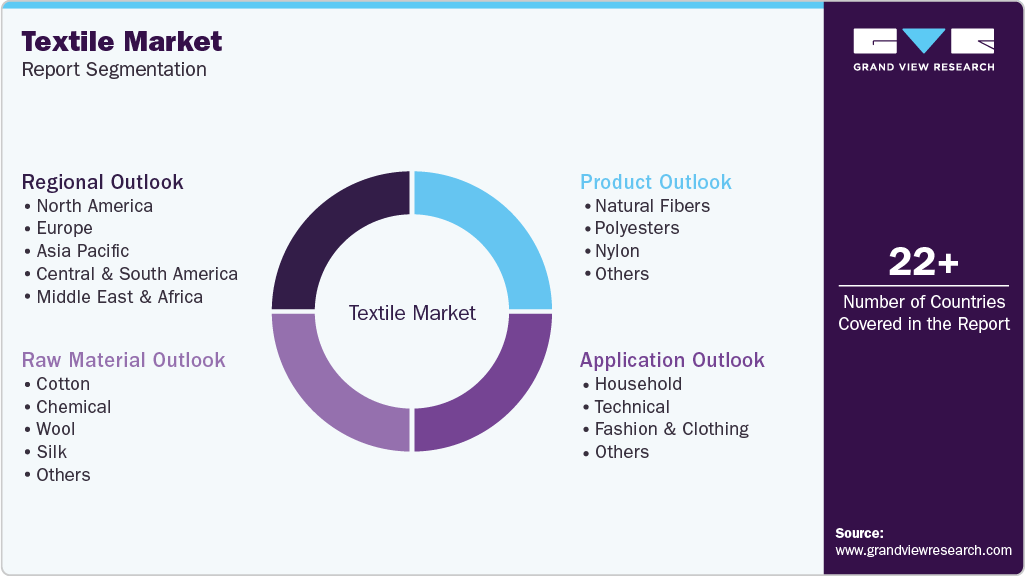
Raw-material Outlook (Volume, Kilotons; Revenue, USD Billion; 2018 - 2030)
Cotton
Chemical
Wool
Silk
Others
Product Outlook (Volume, Kilotons; Revenue, USD Billion; 2018 - 2030)
Natural fibers
Polyesters
Nylon
Others
Application Outlook (Volume, Kilotons; Revenue, USD Billion; 2018 - 2030)
Household
Bedding
Kitchen
Upholstery
Towel
others
Technical
Construction
Transport
Medical
Protective
Fashion & Clothing
Apparel
Ties & Clothing accessories
Handbags
Others
Others
Regional Outlook (Volume, Kilotons; Revenue, USD Billion; 2018 - 2030)
North America
U.S.
Canada
Mexico
Europe
Germany
France
Italy
UK
Turkey
Russia
Asia Pacific
China
India
Japan
Australia
Central & South America
Brazil
Middle East & Africa
Saudi Arabia
Iran
b. The global textile market size was estimated at USD 1695.13 billion in 2022 and is expected to reach USD 1,837.27 billion in 2022.
b. The textile market is expected to grow at a compound annual growth rate of 7.6% from 2023 to 2030 to reach USD 3,047.23 billion by 2030.
b. Natural fibers led the market and accounted for over 44.1% share of the global revenue in 2022 on account of their use in the diverse application of the fashion and apparel industry
b. Some of the key players operating in the textile market include BSL Limited, INVISTA S.R.L., Lu Thai Textile Co., Ltd., Paramount Textile Limited, Paulo de Oliveira, S.A., Successori REDA S.p.A., Shadong Jining Ruyi Woolen Textile Co. Ltd., Shandong Demian Incorporated Company, Shijiazhuang Changshan Textile Co., Ltd, and Weiqiao Textile Company Limited.
b. The key factors that are driving the textile market include growing product demand for personal care & hygiene products, rising product use for production of geotextiles, and surge in demand for textile for disposable protective gears for medical applications
Table of Contents
Chapter 1. Textile Market: Methodology and Scope
1.1. Market Segmentation & Scope
1.2. Market Definition
1.3. Information Procurement
1.3.1. Purchased Database
1.3.2. GVR’s Internal Database
1.3.3. Secondary Sources & Third-Party Perspectives
1.3.4. Primary Research
1.4. Information Analysis
1.4.1. Data Analysis Models
1.5. Market Formulation & Data Visualization
1.6. Data Validation & Publishing
Chapter 2. Textile Market: Executive Summary
2.1. Market Outlook
2.2. Segmental Outlook
2.3. Competitive Insights
Chapter 3. Textile Market: Variables, Trends, and Scope
3.1. Market Lineage
3.1.1. Global Textile Market Outlook
3.2. Industry Value Chain Analysis
3.3. Technology Overview
3.3.1. Geotextile
3.3.2. Smart textile
3.3.3. Waterproof breathable textile (WBT)
3.3.4. Antimicrobial medical textiles
3.4. Regulatory Framework
3.4.1. Standard & Compliances
3.5. Market Dynamics
3.5.1. Market Driver analysis
3.5.1.1. Improving protective clothing market
3.5.1.2. Automotive industry growth
3.5.1.3. Expansion in construction sector
3.5.1.4. Rising importance of technical textile
3.5.2. Market restraint analysis
3.5.3. Fragmented market scenario
3.6. Business Environment Analysis: Textile Market
3.6.1. Industry Analysis - Porters Model
3.6.1.1. Supplier Power
3.6.1.2. Buyer Power
3.6.1.3. Substitution Threat
3.6.1.4. Threat from New Entrant
3.6.1.5. Industry Rivalry
3.6.2. PESTEL ANALYSIS
3.6.2.1. Political Landscape
3.6.2.2. Economic Landscape
3.6.2.3. Social Landscape
3.6.2.4. Technology Landscape
3.6.2.5. Environmental Landscape
3.6.2.6. Legal Landscape
3.7. Import & Export Scenario
3.7.1. Textile import & export trade statistics, by country, 2018-2020
3.7.1.1. U.S.
3.7.1.2. Canada
3.7.1.3. Mexico
3.7.1.4. Germany
3.7.1.5. France
3.7.1.6. U.K.
3.7.1.7. Italy
3.7.1.8. Turkey
3.7.1.9. Russia
3.7.1.10. China
3.7.1.11. Japan
3.7.1.12. India
3.7.1.13. Australia
3.7.1.14. Brazil
3.7.1.15. Saudi Arabia
3.7.1.16. Iran
3.7.2. Recent trade agreements
3.7.3. Factors prevailing in imports and exports of textile products
Chapter 4. Textile Market: Material Estimates & Trend Analysis
4.1. Textile Market: Raw Material Movement Analysis, 2023 & 2030
4.2. Global Textile Market, by Raw Material, 2018 - 2030 (USD Billion)
4.2.1. Textile market estimates & forecasts, BY Raw Material, 2018 - 2030
4.3. Cotton
4.3.1. Textile market estimates & forecasts, in cotton, 2018 - 2030 (Kilotons) (USD Billion)
4.4. Chemical
4.4.1. Textile market estimates & forecasts, in chemical, 2018 - 2030 (Kilotons) (USD Billion)
4.5. Wool
4.5.1. Textile market estimates & forecasts, in Wool, 2018 - 2030 (Kilotons) (USD Billion)
4.6. Silk
4.6.1. Textile market estimates & forecasts, in Silk, 2018 - 2030 (Kilotons) (USD Billion)
4.7. Others
4.7.1. Textile market estimates & forecasts, in others, 2018 - 2030 (Kilotons) (USD Billion)
Chapter 5. Textile Market: Product Estimates & Trend Analysis
5.1. Textile Market: Product Movement Analysis & Market Share, 2023 & 2030
5.1.1. GLOBAL Textile market estimates & forecasts, By Product, 2018 - 2030
5.2. Natural Fibers
5.2.1. Textile market estimates & forecasts, in Natural Fibers, 2018 - 2030 (Kilotons) (USD Billion)
5.3. Polyester
5.3.1. Textile market estimates & forecasts, in Polyester, 2018 - 2030 (Kilotons) (USD Billion)
5.4. Nylon
5.4.1. Textile market estimates & forecasts, in Nylon, 2018 - 2030 (Kilotons) (USD Billion)
5.5. Others
5.5.1. Textile market estimates & forecasts, in Others, 2018 - 2030 (Kilotons) (USD Billion)
Chapter 6. Textile Market: Application Estimates & Trend Analysis
6.1. Textile Market: Application Movement Analysis, 2023 & 2030
6.1.1. Textile market estimates & forecasts, by, application, 2018 - 2030
6.2. Household
6.2.1. Textile market estimates & forecasts, in Household, 2018 - 2030 (Kilotons) (USD Billion)
6.3. Bedding
6.3.1. Textile market estimates & forecasts, in Bedding, 2018 - 2030 (Kilotons) (USD Billion)
6.4. Kitchen
6.4.1. Textile market estimates & forecasts, in Kitchen, 2018 - 2030 (Kilotons) (USD Billion)
6.5. Upholstery
6.5.1. Textile market estimates & forecasts, in Upholstery, 2018 - 2030 (Kilotons) (USD Billion)
6.6. Towel
6.6.1. Textile market estimates & forecasts, in Towel, 2018 - 2030 (Kilotons) (USD Billion)
6.7. Others
6.7.1. Textile market estimates & forecasts, in Others, 2018 - 2030 (Kilotons) (USD Billion)
6.8. Technical
6.8.1. Textile market estimates & forecasts, in Technical, 2018 - 2030 (Kilotons) (USD Billion)
6.9. Construction
6.9.1. Textile market estimates & forecasts, in Construction, 2018 - 2030 (Kilotons) (USD Billion)
6.10. Transportation
6.10.1. Textile market estimates & forecasts, in Transportation, 2018 - 2030 (Kilotons) (USD Billion)
6.11. Protective
6.11.1. Textile market estimates & forecasts, in Protective, 2018 - 2030 (Kilotons) (USD Billion)
6.12. Medical
6.12.1. Textile market estimates & forecasts, in Medical, 2018 - 2030 (Kilotons) (USD Billion)
6.13. Others
6.13.1. Textile market estimates & forecasts, in Others, 2018 - 2030 (Kilotons) (USD Billion)
6.14. Fashion & Clothing
6.14.1. Textile market estimates & forecasts, in Fashion & Clothing, 2018 - 2030 (Kilotons) (USD Billion)
6.15. Apparel
6.15.1. Textile market estimates & forecasts, in Apparel, 2018 - 2030 (Kilotons) (USD Billion)
6.16. Ties & Clothing Accessories
6.16.1. Textile market estimates & forecasts, in Ties & Clothing Accessories, 2018 - 2030 (Kilotons) (USD Billion)
6.17. Handbags
6.17.1. Textile market estimates & forecasts, in Handbags, 2018 - 2030 (Kilotons) (USD Billion)
6.18. Others
6.18.1. Textile market estimates & forecasts, in Others, 2018 - 2030 (Kilotons) (USD Billion)
6.19. Others
6.19.1. Textile market estimates & forecasts, in Others, 2018 - 2030 (Kilotons) (USD Billion)
Chapter 7. Textile Market: Regional Estimates & Trend Analysis
7.1. Regional market place: Key takeaways
7.2. Regional Movement Analysis & Market Share, 2023 & 2030
7.3. North America
7.3.1. Market estimates and forecasts, 2018 - 2030 (Kilotons) (USD Billion)
7.3.2. Market estimates and forecasts, by product, 2018 - 2030 (Kilotons) (USD Billion)
7.3.3. Market estimates and forecasts, by application, 2018 - 2030 (Kilotons) (USD Billion)
7.3.3.1. Market estimates and forecasts in household, by sub-application, 2018 - 2030 (Kilotons) (USD Billion)
7.3.3.2. Market estimates and forecasts in technical, by sub-application, 2018 - 2030 (Kilotons) (USD Billion)
7.3.3.3. Market estimates and forecasts in fashion & clothing, by sub-application, 2018 - 2030 (Kilotons) (USD Billion)
7.3.4. U.S.
7.3.4.1. Market estimates and forecasts, 2018 - 2030 (Kilotons) (USD Billion)
7.3.4.2. Market estimates and forecasts, by raw material, 2018 - 2030 (Kilotons) (USD Billion)
7.3.4.3. Market estimates and forecasts, by product, 2018 - 2030 (Kilotons) (USD Billion)
7.3.4.4. Market estimates and forecasts, by application, 2018 - 2030 (Kilotons) (USD Billion)
7.3.4.4.1. Market estimates and forecasts in household, by sub-application, 2018 - 2030 (Kilotons) (USD Billion)
7.3.4.4.2. Market estimates and forecasts in technical, by sub-application, 2018 - 2030 (Kilotons) (USD Billion)
7.3.4.4.3. Market estimates and forecasts in fashion & clothing, by sub-application, 2018 - 2030 (Kilotons) (USD Billion
7.3.5. Canada
7.3.5.1. Market estimates and forecasts, 2018 - 2030 (Kilotons) (USD Billion)
7.3.5.2. Market estimates and forecasts, by raw material, 2018 - 2030 (Kilotons) (USD Billion)
7.3.5.3. Market estimates and forecasts, by product, 2018 - 2030 (Kilotons) (USD Billion)
7.3.5.4. Market estimates and forecasts, by application, 2018 - 2030 (Kilotons) (USD Billion)
7.3.5.4.1. Market estimates and forecasts in household, by sub-application, 2018 - 2030 (Kilotons) (USD Billion)
7.3.5.4.2. Market estimates and forecasts in technical, by sub-application, 2018 - 2030 (Kilotons) (USD Billion)
7.3.5.4.3. Market estimates and forecasts in fashion & clothing, by sub-application, 2018 - 2030 (Kilotons) (USD Billion
7.3.6. Mexico
7.3.6.1. Market estimates and forecasts, 2018 - 2030 (Kilotons) (USD Billion)
7.3.6.2. Market estimates and forecasts, by raw material, 2018 - 2030 (Kilotons) (USD Billion)
7.3.6.3. Market estimates and forecasts, by product, 2018 - 2030 (Kilotons) (USD Billion)
7.3.6.4. Market estimates and forecasts, by application, 2018 - 2030 (Kilotons) (USD Billion)
7.3.6.4.1. Market estimates and forecasts in household, by sub-application, 2018 - 2030 (Kilotons) (USD Billion)
7.3.6.4.2. Market estimates and forecasts in technical, by sub-application, 2018 - 2030 (Kilotons) (USD Billion)
7.3.6.4.3. Market estimates and forecasts in fashion & clothing, by sub-application, 2018 - 2030 (Kilotons) (USD Billion
7.4. Europe
7.4.1. Market estimates and forecasts, 2018 - 2030 (Kilotons) (USD Billion)
7.4.2. Market estimates and forecasts, by product, 2018 - 2030 (Kilotons) (USD Billion)
7.4.3. Market estimates and forecasts, by application, 2018 - 2030 (Kilotons) (USD Billion)
7.4.3.1. Market estimates and forecasts in household, by sub-application, 2018 - 2030 (Kilotons) (USD Billion)
7.4.3.2. Market estimates and forecasts in technical, by sub-application, 2018 - 2030 (Kilotons) (USD Billion)
7.4.3.3. Market estimates and forecasts in fashion & clothing, by sub-application, 2018 - 2030 (Kilotons) (USD Billion)
7.4.4. Germany
7.4.4.1. Market estimates and forecasts, 2018 - 2030 (Kilotons) (USD Billion)
7.4.4.2. Market estimates and forecasts, by raw material, 2018 - 2030 (Kilotons) (USD Billion)
7.4.4.3. Market estimates and forecasts, by product, 2018 - 2030 (Kilotons) (USD Billion)
7.4.4.4. Market estimates and forecasts, by application, 2018 - 2030 (Kilotons) (USD Billion)
7.4.4.4.1. Market estimates and forecasts in household, by sub-application, 2018 - 2030 (Kilotons) (USD Billion)
7.4.4.4.2. Market estimates and forecasts in technical, by sub-application, 2018 - 2030 (Kilotons) (USD Billion)
7.4.4.4.3. Market estimates and forecasts in fashion & clothing, by sub-application, 2018 - 2030 (Kilotons) (USD Billion
7.4.5. France
7.4.5.1. Market estimates and forecasts, 2018 - 2030 (Kilotons) (USD Billion)
7.4.5.2. Market estimates and forecasts, by raw material, 2018 - 2030 (Kilotons) (USD Billion)
7.4.5.3. Market estimates and forecasts, by product, 2018 - 2030 (Kilotons) (USD Billion)
7.4.5.4. Market estimates and forecasts, by application, 2018 - 2030 (Kilotons) (USD Billion)
7.4.5.4.1. Market estimates and forecasts in household, by sub-application, 2018 - 2030 (Kilotons) (USD Billion)
7.4.5.4.2. Market estimates and forecasts in technical, by sub-application, 2018 - 2030 (Kilotons) (USD Billion)
7.4.5.4.3. Market estimates and forecasts in fashion & clothing, by sub-application, 2018 - 2030 (Kilotons) (USD Billion
7.4.6. Italy
7.4.6.1. Market estimates and forecasts, 2018 - 2030 (Kilotons) (USD Billion)
7.4.6.2. Market estimates and forecasts, by raw material, 2018 - 2030 (Kilotons) (USD Billion)
7.4.6.3. Market estimates and forecasts, by product, 2018 - 2030 (Kilotons) (USD Billion)
7.4.6.4. Market estimates and forecasts, by application, 2018 - 2030 (Kilotons) (USD Billion)
7.4.6.4.1. Market estimates and forecasts in household, by sub-application, 2018 - 2030 (Kilotons) (USD Billion)
7.4.6.4.2. Market estimates and forecasts in technical, by sub-application, 2018 - 2030 (Kilotons) (USD Billion)
7.4.6.4.3. Market estimates and forecasts in fashion & clothing, by sub-application, 2018 - 2030 (Kilotons) (USD Billion
7.4.7. UK
7.4.7.1. Market estimates and forecasts, 2018 - 2030 (Kilotons) (USD Billion)
7.4.7.2. Market estimates and forecasts, by raw material, 2018 - 2030 (Kilotons) (USD Billion)
7.4.7.3. Market estimates and forecasts, by product, 2018 - 2030 (Kilotons) (USD Billion)
7.4.7.4. Market estimates and forecasts, by application, 2018 - 2030 (Kilotons) (USD Billion)
7.4.7.4.1. Market estimates and forecasts in household, by sub-application, 2018 - 2030 (Kilotons) (USD Billion)
7.4.7.4.2. Market estimates and forecasts in technical, by sub-application, 2018 - 2030 (Kilotons) (USD Billion)
7.4.7.4.3. Market estimates and forecasts in fashion & clothing, by sub-application, 2018 - 2030 (Kilotons) (USD Billion
7.4.8. Turkey
7.4.8.1. Market estimates and forecasts, 2018 - 2030 (Kilotons) (USD Billion)
7.4.8.2. Market estimates and forecasts, by raw material, 2018 - 2030 (Kilotons) (USD Billion)
7.4.8.3. Market estimates and forecasts, by product, 2018 - 2030 (Kilotons) (USD Billion)
7.4.8.4. Market estimates and forecasts, by application, 2018 - 2030 (Kilotons) (USD Billion)
7.4.8.4.1. Market estimates and forecasts in household, by sub-application, 2018 - 2030 (Kilotons) (USD Billion)
7.4.8.4.2. Market estimates and forecasts in technical, by sub-application, 2018 - 2030 (Kilotons) (USD Billion)
7.4.8.4.3. Market estimates and forecasts in fashion & clothing, by sub-application, 2018 - 2030 (Kilotons) (USD Billion
7.4.9. Russia
7.4.9.1. Market estimates and forecasts, 2018 - 2030 (Kilotons) (USD Billion)
7.4.9.2. Market estimates and forecasts, by raw material, 2018 - 2030 (Kilotons) (USD Billion)
7.4.9.3. Market estimates and forecasts, by product, 2018 - 2030 (Kilotons) (USD Billion)
7.4.9.4. Market estimates and forecasts, by application, 2018 - 2030 (Kilotons) (USD Billion)
7.4.9.4.1. Market estimates and forecasts in household, by sub-application, 2018 - 2030 (Kilotons) (USD Billion)
7.4.9.4.2. Market estimates and forecasts in technical, by sub-application, 2018 - 2030 (Kilotons) (USD Billion)
7.4.9.4.3. Market estimates and forecasts in fashion & clothing, by sub-application, 2018 - 2030 (Kilotons) (USD Billion
7.5. Asia Pacific
7.5.1. Market estimates and forecasts, 2018 - 2030 (Kilotons) (USD Billion)
7.5.2. Market estimates and forecasts, by product, 2018 - 2030 (Kilotons) (USD Billion)
7.5.3. Market estimates and forecasts, by application, 2018 - 2030 (Kilotons) (USD Billion)
7.5.3.1. Market estimates and forecasts in household, by sub-application, 2018 - 2030 (Kilotons) (USD Billion)
7.5.3.2. Market estimates and forecasts in technical, by sub-application, 2018 - 2030 (Kilotons) (USD Billion)
7.5.3.3. Market estimates and forecasts in fashion & clothing, by sub-application, 2018 - 2030 (Kilotons) (USD Billion)
7.5.4. China
7.5.4.1. Market estimates and forecasts, 2018 - 2030 (Kilotons) (USD Billion)
7.5.4.2. Market estimates and forecasts, by raw material, 2018 - 2030 (Kilotons) (USD Billion)
7.5.4.3. Market estimates and forecasts, by product, 2018 - 2030 (Kilotons) (USD Billion)
7.5.4.4. Market estimates and forecasts, by application, 2018 - 2030 (Kilotons) (USD Billion)
7.5.4.4.1. Market estimates and forecasts in household, by sub-application, 2018 - 2030 (Kilotons) (USD Billion)
7.5.4.4.2. Market estimates and forecasts in technical, by sub-application, 2018 - 2030 (Kilotons) (USD Billion)
7.5.4.4.3. Market estimates and forecasts in fashion & clothing, by sub-application, 2018 - 2030 (Kilotons) (USD Billion
7.5.5. India
7.5.5.1. Market estimates and forecasts, 2018 - 2030 (Kilotons) (USD Billion)
7.5.5.2. Market estimates and forecasts, by raw material, 2018 - 2030 (Kilotons) (USD Billion)
7.5.5.3. Market estimates and forecasts, by product, 2018 - 2030 (Kilotons) (USD Billion)
7.5.5.4. Market estimates and forecasts, by application, 2018 - 2030 (Kilotons) (USD Billion)
7.5.5.4.1. Market estimates and forecasts in household, by sub-application, 2018 - 2030 (Kilotons) (USD Billion)
7.5.5.4.2. Market estimates and forecasts in technical, by sub-application, 2018 - 2030 (Kilotons) (USD Billion)
7.5.5.4.3. Market estimates and forecasts in fashion & clothing, by sub-application, 2018 - 2030 (Kilotons) (USD Billion
7.5.6. Japan
7.5.6.1. Market estimates and forecasts, 2018 - 2030 (Kilotons) (USD Billion)
7.5.6.2. Market estimates and forecasts, by raw material, 2018 - 2030 (Kilotons) (USD Billion)
7.5.6.3. Market estimates and forecasts, by product, 2018 - 2030 (Kilotons) (USD Billion)
7.5.6.4. Market estimates and forecasts, by application, 2018 - 2030 (Kilotons) (USD Billion)
7.5.6.4.1. Market estimates and forecasts in household, by sub-application, 2018 - 2030 (Kilotons) (USD Billion)
7.5.6.4.2. Market estimates and forecasts in technical, by sub-application, 2018 - 2030 (Kilotons) (USD Billion)
7.5.6.4.3. Market estimates and forecasts in fashion & clothing, by sub-application, 2018 - 2030 (Kilotons) (USD Billion
7.5.7. Australia
7.5.7.1. Market estimates and forecasts, 2018 - 2030 (Kilotons) (USD Billion)
7.5.7.2. Market estimates and forecasts, by raw material, 2018 - 2030 (Kilotons) (USD Billion)
7.5.7.3. Market estimates and forecasts, by product, 2018 - 2030 (Kilotons) (USD Billion)
7.5.7.4. Market estimates and forecasts, by application, 2018 - 2030 (Kilotons) (USD Billion)
7.5.7.4.1. Market estimates and forecasts in household, by sub-application, 2018 - 2030 (Kilotons) (USD Billion)
7.5.7.4.2. Market estimates and forecasts in technical, by sub-application, 2018 - 2030 (Kilotons) (USD Billion)
7.5.7.4.3. Market estimates and forecasts in fashion & clothing, by sub-application, 2018 - 2030 (Kilotons) (USD Billion
7.6. Central & South America
7.6.1. Market estimates and forecasts, 2018 - 2030 (Kilotons) (USD Billion)
7.6.2. Market estimates and forecasts, by product, 2018 - 2030 (Kilotons) (USD Billion)
7.6.3. Market estimates and forecasts, by application, 2018 - 2030 (Kilotons) (USD Billion)
7.6.3.1. Market estimates and forecasts in household, by sub-application, 2018 - 2030 (Kilotons) (USD Billion)
7.6.3.2. Market estimates and forecasts in technical, by sub-application, 2018 - 2030 (Kilotons) (USD Billion)
7.6.3.3. Market estimates and forecasts in fashion & clothing, by sub-application, 2018 - 2030 (Kilotons) (USD Billion)
7.6.4. Brazil
7.6.4.1. Market estimates and forecasts, 2018 - 2030 (Kilotons) (USD Billion)
7.6.4.2. Market estimates and forecasts, by raw material, 2018 - 2030 (Kilotons) (USD Billion)
7.6.4.3. Market estimates and forecasts, by product, 2018 - 2030 (Kilotons) (USD Billion)
7.6.4.4. Market estimates and forecasts, by application, 2018 - 2030 (Kilotons) (USD Billion)
7.6.4.4.1. Market estimates and forecasts in household, by sub-application, 2018 - 2030 (Kilotons) (USD Billion)
7.6.4.4.2. Market estimates and forecasts in technical, by sub-application, 2018 - 2030 (Kilotons) (USD Billion)
7.6.4.4.3. Market estimates and forecasts in fashion & clothing, by sub-application, 2018 - 2030 (Kilotons) (USD Billion
7.7. Middle East & Africa
7.7.1. Market estimates and forecasts, 2018 - 2030 (Kilotons) (USD Billion)
7.7.2. Market estimates and forecasts, by product, 2018 - 2030 (Kilotons) (USD Billion)
7.7.3. Market estimates and forecasts, by application, 2018 - 2030 (Kilotons) (USD Billion)
7.7.3.1. Market estimates and forecasts in household, by sub-application, 2018 - 2030 (Kilotons) (USD Billion)
7.7.3.2. Market estimates and forecasts in technical, by sub-application, 2018 - 2030 (Kilotons) (USD Billion)
7.7.3.3. Market estimates and forecasts in fashion & clothing, by sub-application, 2018 - 2030 (Kilotons) (USD Billion)
7.7.4. Saudi Arabia
7.7.4.1. Market estimates and forecasts, 2018 - 2030 (Kilotons) (USD Billion)
7.7.4.2. Market estimates and forecasts, by raw material, 2018 - 2030 (Kilotons) (USD Billion)
7.7.4.3. Market estimates and forecasts, by product, 2018 - 2030 (Kilotons) (USD Billion)
7.7.4.4. Market estimates and forecasts, by application, 2018 - 2030 (Kilotons) (USD Billion)
7.7.4.4.1. Market estimates and forecasts in household, by sub-application, 2018 - 2030 (Kilotons) (USD Billion)
7.7.4.4.2. Market estimates and forecasts in technical, by sub-application, 2018 - 2030 (Kilotons) (USD Billion)
7.7.4.4.3. Market estimates and forecasts in fashion & clothing, by sub-application, 2018 - 2030 (Kilotons) (USD Billion
7.7.5. Iran
7.7.5.1. Market estimates and forecasts, 2018 - 2030 (Kilotons) (USD Billion)
7.7.5.2. Market estimates and forecasts, by raw material, 2018 - 2030 (Kilotons) (USD Billion)
7.7.5.3. Market estimates and forecasts, by product, 2018 - 2030 (Kilotons) (USD Billion)
7.7.5.4. Market estimates and forecasts, by application, 2018 - 2030 (Kilotons) (USD Billion)
7.7.5.4.1. Market estimates and forecasts in household, by sub-application, 2018 - 2030 (Kilotons) (USD Billion)
7.7.5.4.2. Market estimates and forecasts in technical, by sub-application, 2018 - 2030 (Kilotons) (USD Billion)
7.7.5.4.3. Market estimates and forecasts in fashion & clothing, by sub-application, 2018 - 2030 (Kilotons) (USD Billion
Chapter 8. Competitive Landscape
8.1. Competitive Environment
8.2. Strategy Framework
8.3. Vendor Landscape
8.4. Public Companies
8.4.1. Company Market position analysis
8.4.2. SWOT ANALYSIS
8.5. Private Companies
Chapter 9. Company Profiles
9.1. BSL Limited
9.1.1. Company overview
9.1.2. Financial performance
9.1.3. Product benchmarking
9.1.4. Strategic initiatives
9.2. INVISTA S.R.L.
9.2.1. Company overview
9.2.2. Financial performance
9.2.3. Product benchmarking
9.2.4. Strategic initiatives
9.3. Lu Thai Textile Co., Ltd.
9.3.1. Company overview
9.3.2. Financial performance
9.3.3. Product benchmarking
9.3.4. Strategic initiatives
9.4. Paramount Textile Limited
9.4.1. Company overview
9.4.2. Financial performance
9.4.3. Product benchmarking
9.4.4. Strategic initiatives
9.5. Paulo de Oliveira, S.A.
9.5.1. Company overview
9.5.2. Financial performance
9.5.3. Product benchmarking
9.5.4. Strategic initiatives
9.6. Successori REDA S.p.A.
9.6.1. Company overview
9.6.2. Financial performance
9.6.3. Product benchmarking
9.6.4. Strategic initiatives
9.7. Shadong Jining Ruyi Woolen Textile Co. Ltd.
9.7.1. Company overview
9.7.2. Financial performance
9.7.3. Product benchmarking
9.7.4. Strategic initiatives
9.8. Sinopec Yizheng Chemical Fibre Company Limited
9.8.1. Company overview
9.8.2. Financial performance
9.8.3. Product benchmarking
9.8.4. Strategic initiatives
9.9. China textiles Ltd.
9.9.1. Company overview
9.9.2. Financial performance
9.9.3. Product benchmarking
9.9.4. Strategic initiatives
9.10. Rhodia SA
9.10.1. Company overview
9.10.2. Financial performance
9.10.3. Product benchmarking
9.10.4. Strategic initiatives
9.11. Li & Fung Group
9.11.1. Company overview
9.11.2. Financial performance
9.11.3. Product benchmarking
9.11.4. Strategic initiatives
9.12. Modern Woollens Ltd.
9.12.1. Company overview
9.12.2. Financial performance
9.12.3. Product benchmarking
9.12.4. Strategic initiatives
9.13. Mayur Suitings
9.13.1. Company overview
9.13.2. Financial performance
9.13.3. Product benchmarking
9.13.4. Strategic initiatives
9.14. JCT Limited
9.14.1. Company overview
9.14.2. Financial performance
9.14.3. Product benchmarking
9.14.4. Strategic initiatives
9.15. Shijiazhuang Changshan Textile Co Ltd
9.15.1. Company overview
9.15.2. Financial performance
9.15.3. Product benchmarking
9.15.4. Strategic initiatives
9.16. Weiqiao Textile Co Ltd
9.16.1. Company overview
9.16.2. Financial performance
9.16.3. Product benchmarking
9.16.4. Strategic initiatives
9.17. Huafu Top Dyed Melange Yarn Co., Ltd.
9.17.1. Company overview
9.17.2. Financial performance
9.17.3. Product benchmarking
9.17.4. Strategic initiatives
9.18. DBL Group
9.18.1. Company overview
9.18.2. Financial performance
9.18.3. Product benchmarking
9.18.4. Strategic initiatives
9.19. B.D. Textile Mills Pvt. Ltd.
9.19.1. Company overview
9.19.2. Financial performance
9.19.3. Product benchmarking
9.19.4. Strategic initiatives
9.20. IBENA Inc.
9.20.1. Company overview
9.20.2. Financial performance
9.20.3. Product benchmarking
9.20.4. Strategic initiatives
9.21. Heytex Bramsche GmbH
9.21.1. Company overview
9.21.2. Financial performance
9.21.3. Product benchmarking
9.21.4. Strategic initiatives
9.22. Bahariye AS
9.22.1. Company overview
9.22.2. Financial performance
9.22.3. Product benchmarking
9.22.4. Strategic initiatives
9.23. Fratelli Balli SpA
9.23.1. Company overview
9.23.2. Financial performance
9.23.3. Product benchmarking
9.23.4. Strategic initiatives
9.24. İpekiş Mensucat Türk A.Ş.
9.24.1. Company overview
9.24.2. Financial performance
9.24.3. Product benchmarking
9.24.4. Strategic initiatives
9.25. Lakhmi Woollen Mills
9.25.1. Company overview
9.25.2. Financial performance
9.25.3. Product benchmarking
9.25.4. Strategic initiatives
9.26. Wilh. Wülfing GmbH & Co. KG
9.26.1. Company overview
9.26.2. Financial performance
9.26.3. Product benchmarking
9.26.4. Strategic initiatives
9.27. Lanificio F.lli Cerruti
9.27.1. Company overview
9.27.2. Financial performance
9.27.3. Product benchmarking
9.27.4. Strategic initiatives
9.28. O'Formula Co., Ltd
9.28.1. Company overview
9.28.2. Financial performance
9.28.3. Product benchmarking
9.28.4. Strategic initiatives
9.29. Trabaldo Togna SpA
9.29.1. Company overview
9.29.2. Financial performance
9.29.3. Product benchmarking
9.29.4. Strategic initiatives
9.30. Xinhui Woollen Textile Co., Ltd
9.30.1. Company overview
9.30.2. Financial performance
9.30.3. Product benchmarking
9.30.4. Strategic initiatives
9.31. Yünsa Yünlü Sanayi ve Ticaret A.Ş.
9.31.1. Company overview
9.31.2. Financial performance
9.31.3. Product benchmarking
9.31.4. Strategic initiatives
9.32. Özlem Kumaş, Ltd
9.32.1. Company overview
9.32.2. Financial performance
9.32.3. Product benchmarking
9.32.4. Strategic initiatives
9.33. Wuxi Xiexin Group Co., Ltd
9.33.1. Company overview
9.33.2. Financial performance
9.33.3. Product benchmarking
9.33.4. Strategic initiatives
9.34. The Bombay Dyeing & Mfg. Co., Ltd
9.34.1. Company overview
9.34.2. Financial performance
9.34.3. Product benchmarking
9.34.4. Strategic initiatives
9.35. Grasim Industries Limited
9.35.1. Company overview
9.35.2. Financial performance
9.35.3. Product benchmarking
9.35.4. Strategic initiatives
9.36. FabIndia Overseas Ltd.
9.36.1. Company overview
9.36.2. Financial performance
9.36.3. Product benchmarking
9.36.4. Strategic initiatives
9.37. Honeywell International Inc.
9.37.1. Company overview
9.37.2. Financial performance
9.37.3. Product benchmarking
9.37.4. Strategic initiatives
List of Tables
1. Textiles - Market driver analysis
2. U.S. construction industry, by segment, 2018 - 2023(USD Billion)
3. Comparison of regular textiles and technical textiles
4. Textiles - Market restraint analysis
5. U.S. textiles imports and exports, 2018 - 2023 (USD Billion)
6. Canada textiles imports and exports, 2018 - 2023 (USD Billion)
7. Mexico textiles imports and exports, 2018 - 2023 (USD Billion)
8. Germany textiles imports and exports, 2018 - 2023 (USD Billion)
9. France textiles imports and exports, 2018 - 2023 (USD Billion)
10. U.K. textiles imports and exports, 2018 - 2023 (USD Billion)
11. Italy textiles imports and exports, 2018 - 2023 (USD Billion)
12. Turkey textiles imports and exports, 2018 - 2023 (USD Billion)
13. Russia textiles imports and exports, 2018 - 2023 (USD Billion)
14. China textiles imports and exports, 2018 - 2023 (USD Billion)
15. Japan textiles imports and exports, 2018 - 2023 (USD Billion)
16. India textiles imports and exports, 2018 - 2023 (USD Billion)
17. Australia textiles imports and exports, 2018 - 2023 (USD Billion)
18. Brazil textiles imports and exports, 2018 - 2023 (USD Billion)
19. Saudi Arabia textiles imports and exports, 2018 - 2023 (USD Billion)
20. Iran textiles imports and exports, 2018 - 2023 (USD Billion)
21. Global cotton-based textile market volume and revenue, 2018 - 2030 (Kilotons) (USD Billion)
22. Global chemical-based textile market volume and revenue, 2018 - 2030 (Kilotons) (USD Billion)
23. Global wool-based textile market volume and revenue, 2018 - 2030 (Kilotons) (USD Billion)
24. Global silk-based textile market volume and revenue, 2018 - 2030 (Kilotons) (USD Billion)
25. Global textile market volume and revenue from other raw materials, 2018 - 2030 (Kilotons) (USD Billion)
26. Global natural-fiber textile market volume and revenue, 2018 - 2030 (Kilotons) (USD Billion)
27. Global polyester textile market volume and revenue, 2018 - 2030 (Kilotons) (USD Billion)
28. Global nylon textile market volume and revenue, 2018 - 2030 (Kilotons) (USD Billion)
29. Global textile market volume and revenue from other products, 2018 - 2030 (Kilotons) (USD Billion)
30. Global market for textiles in household, 2018 - 2030 (Kilotons) (USD Billion)
31. Global market for textiles in household for bedding, 2018 - 2030 (Kilotons) (USD Billion)
32. Global market for textiles in household for kitchen, 2018 - 2030 (Kilotons) (USD Billion)
33. Global market for textiles in household for upholstery, 2018 - 2030 (Kilotons) (USD Billion)
34. Global market for textiles in household for towels, 2018 - 2030 (Kilotons) (USD Billion)
35. Global market for textiles in household for other sub-applications, 2018 - 2030 (Kilotons) (USD Billion)
36. Global market for textiles in technical, 2018 - 2030 (Kilotons) (USD Billion)
37. Global market for textiles in technical for construction, 2018 - 2030 (Kilotons) (USD Billion)
38. Global market for textiles in technical for transportation, 2018 - 2030 (Kilotons) (USD Billion)
39. Global market for textiles in technical for protective, 2018 - 2030 (Kilotons) (USD Billion)
40. Global market for textiles in technical for medical, 2018 - 2030 (Kilotons) (USD Billion)
41. Global market for textiles in other technical applications, 2018 - 2030 (Kilotons) (USD Billion)
42. Global market for textiles in fashion & clothing, 2018 - 2030 (Kilotons) (USD Billion)
43. Global market for textiles in fashion & clothing for apparel, 2018 - 2030 (Kilotons) (USD Billion)
44. Global market for textiles in fashion & clothing for ties & clothing accessories, 2018 - 2030 (Kilotons) (USD Billion)
45. Global market for textiles in fashion & clothing for handbags, 2018 - 2030 (Kilotons) (USD Billion)
46. Global market for textiles in fashion & clothing for other sub-applications, 2018 - 2030 (Kilotons) (USD Billion)
47. Global market for textiles in other applications, 2018 - 2030 (Kilotons) (USD Billion)
48. North America textile market, 2018 - 2030 (Kilotons) (USD Billion)
49. North America textile market volume, by raw material, 2018 - 2030 (Kilotons)
50. North America textile market revenue, by raw material, 2018 - 2030 (USD Billion)
51. North America textile market volume, by product, 2018 - 2030 (Kilotons)
52. North America textile market revenue, by product, 2018 - 2030 (USD Billion)
53. North America textile market volume, by application, 2018 - 2030 (Kilotons)
54. North America textile market revenue, by application, 2018 - 2030 (USD Billion)
55. North America textile market volume in household, by sub-application, 2018 - 2030 (Kilotons)
56. North America textile market revenue in household, by sub-application, 2018 - 2030 (USD Billion)
57. North America textile market volume in technical, by sub-application, 2018 - 2030 (Kilotons)
58. North America textile market revenue in technical, by sub-application, 2018 - 2030 (USD Billion)
59. North America textile market volume in fashion & clothing, by sub-application, 2018 - 2030 (Kilotons)
60. North America textile market revenue in fashion & clothing, by sub-application, 2018 - 2030 (USD Billion)
61. U.S. textile market, 2018 - 2030 (Kilotons) (USD Billion)
62. U.S. textile market volume, by raw material, 2018 - 2030 (Kilotons)
63. U.S. textile market revenue, by raw material, 2018 - 2030 (USD Billion)
64. U.S. textile market volume, by product, 2018 - 2030 (Kilotons)
65. U.S. textile market revenue, by product, 2018 - 2030 (USD Billion)
66. U.S. textile market volume, by application, 2018 - 2030 (Kilotons)
67. U.S. textile market revenue, by application, 2018 - 2030 (USD Billion)
68. U.S. textile market volume in household, by sub-application, 2018 - 2030 (Kilotons)
69. U.S. textile market revenue in household, by sub-application, 2018 - 2030 (USD Billion)
70. U.S. textile market volume in technical, by sub-application, 2018 - 2030 (Kilotons)
71. U.S. textile market revenue in technical, by sub-application, 2018 - 2030 (USD Billion)
72. U.S. textile market volume in fashion & clothing, by sub-application, 2018 - 2030 (Kilotons)
73. U.S. textile market revenue in fashion & clothing, by sub-application, 2018 - 2030 (USD Billion)
74. Canada textile market, 2018 - 2030 (Kilotons) (USD Billion)
75. Canada textile market volume, by raw material, 2018 - 2030 (Kilotons)
76. Canada textile market revenue, by raw material, 2018 - 2030 (USD Billion)
77. Canada textile market volume, by product, 2018 - 2030 (Kilotons)
78. Canada textile market revenue, by product, 2018 - 2030 (USD Billion)
79. Canada textile market volume, by application, 2018 - 2030 (Kilotons)
80. Canada textile market revenue, by application, 2018 - 2030 (USD Billion)
81. Canada textile market volume in household, by sub-application, 2018 - 2030 (Kilotons)
82. Canada textile market revenue in household, by sub-application, 2018 - 2030 (USD Billion)
83. Canada textile market volume in technical, by sub-application, 2018 - 2030 (Kilotons)
84. Canada textile market revenue in technical, by sub-application, 2018 - 2030 (USD Billion)
85. Canada textile market volume in fashion & clothing, by sub-application, 2018 - 2030 (Kilotons)
86. Canada textile market revenue in fashion & clothing, by sub-application, 2018 - 2030 (USD Billion)
87. Mexico textile market, 2018 - 2030 (Kilotons) (USD Billion)
88. Mexico textile market volume, by raw material, 2018 - 2030 (Kilotons)
89. Mexico textile market revenue, by raw material, 2018 - 2030 (USD Billion)
90. Mexico textile market volume, by product, 2018 - 2030 (Kilotons)
91. Mexico textile market revenue, by product, 2018 - 2030 (USD Billion)
92. Mexico textile market volume, by application, 2018 - 2030 (Kilotons)
93. Mexico textile market revenue, by application, 2018 - 2030 (USD Billion)
94. Mexico textile market volume in household, by sub-application, 2018 - 2030 (Kilotons)
95. Mexico textile market revenue in household, by sub-application, 2018 - 2030 (USD Billion)
96. Mexico textile market volume in technical, by sub-application, 2018 - 2030 (Kilotons)
97. Mexico textile market revenue in technical, by sub-application, 2018 - 2030 (USD Billion)
98. Mexico textile market volume in fashion & clothing, by sub-application, 2018 - 2030 (Kilotons)
99. Mexico textile market revenue in fashion & clothing, by sub-application, 2018 - 2030 (USD Billion)
100. Europe textile market, 2018 - 2030 (Kilotons) (USD Billion)
101. Europe textile market volume, by raw material, 2018 - 2030 (Kilotons)
102. Europe textile market revenue, by raw material, 2018 - 2030 (USD Billion)
103. Europe textile market volume, by product, 2018 - 2030 (Kilotons)
104. Europe textile market revenue, by product, 2018 - 2030 (USD Billion)
105. Europe textile market volume, by application, 2018 - 2030 (Kilotons)
106. Europe textile market revenue, by application, 2018 - 2030 (USD Billion)
107. Europe textile market volume in household, by sub-application, 2018 - 2030 (Kilotons)
108. Europe textile market revenue in household, by sub-application, 2018 - 2030 (USD Billion)
109. Europe textile market volume in technical, by sub-application, 2018 - 2030 (Kilotons)
110. Europe textile market revenue in technical, by sub-application, 2018 - 2030 (USD Billion)
111. Europe textile market volume in fashion & clothing, by sub-application, 2018 - 2030 (Kilotons)
112. Europe textile market revenue in fashion & clothing, by sub-application, 2018 - 2030 (USD Billion)
113. Russia textile market, 2018 - 2030 (Kilotons) (USD Billion)
114. Russia textile market volume, by raw material, 2018 - 2030 (Kilotons)
115. Russia textile market revenue, by raw material, 2018 - 2030 (USD Billion)
116. Russia textile market volume, by product, 2018 - 2030 (Kilotons)
117. Russia textile market revenue, by product, 2018 - 2030 (USD Billion)
118. Russia textile market volume, by application, 2018 - 2030 (Kilotons)
119. Russia textile market revenue, by application, 2018 - 2030 (USD Billion)
120. Russia textile market volume in household, by sub-application, 2018 - 2030 (Kilotons)
121. Russia textile market revenue in household, by sub-application, 2018 - 2030 (USD Billion)
122. Russia textile market volume in technical, by sub-application, 2018 - 2030 (Kilotons)
123. Russia textile market revenue in technical, by sub-application, 2018 - 2030 (USD Billion)
124. Russia textile market volume in fashion & clothing, by sub-application, 2018 - 2030 (Kilotons)
125. Russia textile market revenue in fashion & clothing, by sub-application, 2018 - 2030 (USD Billion)
126. Germany textile market, 2018 - 2030 (Kilotons) (USD Billion)
127. Germany textile market volume, by raw material, 2018 - 2030 (Kilotons)
128. Germany textile market revenue, by raw material, 2018 - 2030 (USD Billion)
129. Germany textile market volume, by product, 2018 - 2030 (Kilotons)
130. Germany textile market revenue, by product, 2018 - 2030 (USD Billion)
131. Germany textile market volume, by application, 2018 - 2030 (Kilotons)
132. Germany textile market revenue, by application, 2018 - 2030 (USD Billion)
133. Germany textile market volume in household, by sub-application, 2018 - 2030 (Kilotons)
134. Germany textile market revenue in household, by sub-application, 2018 - 2030 (USD Billion)
135. Germany textile market volume in technical, by sub-application, 2018 - 2030 (Kilotons)
136. Germany textile market revenue in technical, by sub-application, 2018 - 2030 (USD Billion)
137. Germany textile market volume in fashion & clothing, by sub-application, 2018 - 2030 (Kilotons)
138. Germany textile market revenue in fashion & clothing, by sub-application, 2018 - 2030 (USD Billion)
139. France textile market, 2018 - 2030 (Kilotons) (USD Billion)
140. France textile market volume, by raw material, 2018 - 2030 (Kilotons)
141. France textile market revenue, by raw material, 2018 - 2030 (USD Billion)
142. France textile market volume, by product, 2018 - 2030 (Kilotons)
143. France textile market revenue, by product, 2018 - 2030 (USD Billion)
144. France textile market volume, by application, 2018 - 2030 (Kilotons)
145. France textile market revenue, by application, 2018 - 2030 (USD Billion)
146. France textile market volume in household, by sub-application, 2018 - 2030 (Kilotons)
147. France textile market revenue in household, by sub-application, 2018 - 2030 (USD Billion)
148. France textile market volume in technical, by sub-application, 2018 - 2030 (Kilotons)
149. France textile market revenue in technical, by sub-application, 2018 - 2030 (USD Billion)
150. France textile market volume in fashion & clothing, by sub-application, 2018 - 2030 (Kilotons)
151. France textile market revenue in fashion & clothing, by sub-application, 2018 - 2030 (USD Billion)
152. Turkey textile market, 2018 - 2030 (Kilotons) (USD Billion)
153. Turkey textile market volume, by raw material, 2018 - 2030 (Kilotons)
154. Turkey textile market revenue, by raw material, 2018 - 2030 (USD Billion)
155. Turkey textile market volume, by product, 2018 - 2030 (Kilotons)
156. Turkey textile market revenue, by product, 2018 - 2030 (USD Billion)
157. Turkey textile market volume, by application, 2018 - 2030 (Kilotons)
158. Turkey textile market revenue, by application, 2018 - 2030 (USD Billion)
159. Turkey textile market volume in household, by sub-application, 2018 - 2030 (Kilotons)
160. Turkey textile market revenue in household, by sub-application, 2018 - 2030 (USD Billion)
161. Turkey textile market volume in technical, by sub-application, 2018 - 2030 (Kilotons)
162. Turkey textile market revenue in technical, by sub-application, 2018 - 2030 (USD Billion)
163. Turkey textile market volume in fashion & clothing, by sub-application, 2018 - 2030 (Kilotons)
164. Turkey textile market revenue in fashion & clothing, by sub-application, 2018 - 2030 (USD Billion)
165. Italy textile market, 2018 - 2030 (Kilotons) (USD Billion)
166. Italy textile market volume, by raw material, 2018 - 2030 (Kilotons)
167. Italy textile market revenue, by raw material, 2018 - 2030 (USD Billion)
168. Italy textile market volume, by product, 2018 - 2030 (Kilotons)
169. Italy textile market revenue, by product, 2018 - 2030 (USD Billion)
170. Italy textile market volume, by application, 2018 - 2030 (Kilotons)
171. Italy textile market revenue, by application, 2018 - 2030 (USD Billion)
172. Italy textile market volume in household, by sub-application, 2018 - 2030 (Kilotons)
173. Italy textile market revenue in household, by sub-application, 2018 - 2030 (USD Billion)
174. Italy textile market volume in technical, by sub-application, 2018 - 2030 (Kilotons)
175. Italy textile market revenue in technical, by sub-application, 2018 - 2030 (USD Billion)
176. Italy textile market volume in fashion & clothing, by sub-application, 2018 - 2030 (Kilotons)
177. Italy textile market revenue in fashion & clothing, by sub-application, 2018 - 2030 (USD Billion)
178. U.K. textile market, 2018 - 2030 (Kilotons) (USD Billion)
179. U.K. textile market volume, by raw material, 2018 - 2030 (Kilotons)
180. U.K. textile market revenue, by raw material, 2018 - 2030 (USD Billion)
181. U.K. textile market volume, by product, 2018 - 2030 (Kilotons)
182. U.K. textile market revenue, by product, 2018 - 2030 (USD Billion)
183. U.K. textile market volume, by application, 2018 - 2030 (Kilotons)
184. U.K. textile market revenue, by application, 2018 - 2030 (USD Billion)
185. U.K. textile market volume in household, by sub-application, 2018 - 2030 (Kilotons)
186. U.K. textile market revenue in household, by sub-application, 2018 - 2030 (USD Billion)
187. U.K. textile market volume in technical, by sub-application, 2018 - 2030 (Kilotons)
188. U.K. textile market revenue in technical, by sub-application, 2018 - 2030 (USD Billion)
189. U.K. textile market volume in fashion & clothing, by sub-application, 2018 - 2030 (Kilotons)
190. U.K. textile market revenue in fashion & clothing, by sub-application, 2018 - 2030 (USD Billion)
191. Asia Pacific textile market, 2018 - 2030 (Kilotons) (USD Billion)
192. Asia Pacific textile market volume, by raw material, 2018 - 2030 (Kilotons)
193. Asia Pacific textile market revenue, by raw material, 2018 - 2030 (USD Billion)
194. Asia Pacific textile market volume, by product, 2018 - 2030 (Kilotons)
195. Asia Pacific textile market revenue, by product, 2018 - 2030 (USD Billion)
196. Asia Pacific textile market volume, by application, 2018 - 2030 (Kilotons)
197. Asia Pacific textile market revenue, by application, 2018 - 2030 (USD Billion)
198. Asia Pacific textile market volume in household, by sub-application, 2018 - 2030 (Kilotons)
199. Asia Pacific textile market revenue in household, by sub-application, 2018 - 2030 (USD Billion)
200. Asia Pacific textile market volume in technical, by sub-application, 2018 - 2030 (Kilotons)
201. Asia Pacific textile market revenue in technical, by sub-application, 2018 - 2030 (USD Billion)
202. Asia Pacific textile market volume in fashion & clothing, by sub-application, 2018 - 2030 (Kilotons)
203. Asia Pacific textile market revenue in fashion & clothing, by sub-application, 2018 - 2030 (USD Billion)
204. China textile market, 2018 - 2030 (Kilotons) (USD Billion)
205. China textile market volume, by raw material, 2018 - 2030 (Kilotons)
206. China textile market revenue, by raw material, 2018 - 2030 (USD Billion)
207. China textile market volume, by product, 2018 - 2030 (Kilotons)
208. China textile market revenue, by product, 2018 - 2030 (USD Billion)
209. China textile market volume, by application, 2018 - 2030 (Kilotons)
210. China textile market revenue, by application, 2018 - 2030 (USD Billion)
211. China textile market volume in household, by sub-application, 2018 - 2030 (Kilotons)
212. China textile market revenue in household, by sub-application, 2018 - 2030 (USD Billion)
213. China textile market volume in technical, by sub-application, 2018 - 2030 (Kilotons)
214. China textile market revenue in technical, by sub-application, 2018 - 2030 (USD Billion)
215. China textile market volume in fashion & clothing, by sub-application, 2018 - 2030 (Kilotons)
216. China textile market revenue in fashion & clothing, by sub-application, 2018 - 2030 (USD Billion)
217. India textile market, 2018 - 2030 (Kilotons) (USD Billion)
218. India textile market volume, by raw material, 2018 - 2030 (Kilotons)
219. India textile market revenue, by raw material, 2018 - 2030 (USD Billion)
220. India textile market volume, by product, 2018 - 2030 (Kilotons)
221. India textile market revenue, by product, 2018 - 2030 (USD Billion)
222. India textile market volume, by application, 2018 - 2030 (Kilotons)
223. India textile market revenue, by application, 2018 - 2030 (USD Billion)
224. India textile market volume in household, by sub-application, 2018 - 2030 (Kilotons)
225. India textile market revenue in household, by sub-application, 2018 - 2030 (USD Billion)
226. India textile market volume in technical, by sub-application, 2018 - 2030 (Kilotons)
227. India textile market revenue in technical, by sub-application, 2018 - 2030 (USD Billion)
228. India textile market volume in fashion & clothing, by sub-application, 2018 - 2030 (Kilotons)
229. India textile market revenue in fashion & clothing, by sub-application, 2018 - 2030 (USD Billion)
230. Japan textile market, 2018 - 2030 (Kilotons) (USD Billion)
231. Japan textile market volume, by raw material, 2018 - 2030 (Kilotons)
232. Japan textile market revenue, by raw material, 2018 - 2030 (USD Billion)
233. Japan textile market volume, by product, 2018 - 2030 (Kilotons)
234. Japan textile market revenue, by product, 2018 - 2030 (USD Billion)
235. Japan textile market volume, by application, 2018 - 2030 (Kilotons)
236. Japan textile market revenue, by application, 2018 - 2030 (USD Billion)
237. Japan textile market volume in household, by sub-application, 2018 - 2030 (Kilotons)
238. Japan textile market revenue in household, by sub-application, 2018 - 2030 (USD Billion)
239. Japan textile market volume in technical, by sub-application, 2018 - 2030 (Kilotons)
240. Japan textile market revenue in technical, by sub-application, 2018 - 2030 (USD Billion)
241. Japan textile market volume in fashion & clothing, by sub-application, 2018 - 2030 (Kilotons)
242. Japan textile market revenue in fashion & clothing, by sub-application, 2018 - 2030 (USD Billion)
243. Australia textile market, 2018 - 2030 (Kilotons) (USD Billion)
244. Australia textile market volume, by raw material, 2018 - 2030 (Kilotons)
245. Australia textile market revenue, by raw material, 2018 - 2030 (USD Billion)
246. Australia textile market volume, by product, 2018 - 2030 (Kilotons)
247. Australia textile market revenue, by product, 2018 - 2030 (USD Billion)
248. Australia textile market volume, by application, 2018 - 2030 (Kilotons)
249. Australia textile market revenue, by application, 2018 - 2030 (USD Billion)
250. Australia textile market volume in household, by sub-application, 2018 - 2030 (Kilotons)
251. Australia textile market revenue in household, by sub-application, 2018 - 2030 (USD Billion)
252. Australia textile market volume in technical, by sub-application, 2018 - 2030 (Kilotons)
253. Australia textile market revenue in technical, by sub-application, 2018 - 2030 (USD Billion)
254. Australia textile market volume in fashion & clothing, by sub-application, 2018 - 2030 (Kilotons)
255. Australia textile market revenue in fashion & clothing, by sub-application, 2018 - 2030 (USD Billion)
256. Central & South America textile market, 2018 - 2030 (Kilotons) (USD Billion)
257. Central & South America textile market volume, by raw material, 2018 - 2030 (Kilotons)
258. Central & South America textile market revenue, by raw material, 2018 - 2030 (USD Billion)
259. Central & South America textile market volume, by product, 2018 - 2030 (Kilotons)
260. Central & South America textile market revenue, by product, 2018 - 2030 (USD Billion)
261. Central & South America textile market volume, by application, 2018 - 2030 (Kilotons)
262. Central & South America textile market revenue, by application, 2018 - 2030 (USD Billion)
263. Central & South America textile market volume in household, by sub-application, 2018 - 2030 (Kilotons)
264. Central & South America textile market revenue in household, by sub-application, 2018 - 2030 (USD Billion)
265. Central & South America textile market volume in technical, by sub-application, 2018 - 2030 (Kilotons)
266. Central & South America textile market revenue in technical, by sub-application, 2018 - 2030 (USD Billion)
267. Central & South America textile market volume in fashion & clothing, by sub-application, 2018 - 2030 (Kilotons)
268. Central & South America textile market revenue in fashion & clothing, by sub-application, 2018 - 2030 (USD Billion)
269. Brazil textile market, 2018 - 2030 (Kilotons) (USD Billion)
270. Brazil textile market volume, by raw material, 2018 - 2030 (Kilotons)
271. Brazil textile market revenue, by raw material, 2018 - 2030 (USD Billion)
272. Brazil textile market volume, by product, 2018 - 2030 (Kilotons)
273. Brazil textile market revenue, by product, 2018 - 2030 (USD Billion)
274. Brazil textile market volume, by application, 2018 - 2030 (Kilotons)
275. Brazil textile market revenue, by application, 2018 - 2030 (USD Billion)
276. Brazil textile market volume in household, by sub-application, 2018 - 2030 (Kilotons)
277. Brazil textile market revenue in household, by sub-application, 2018 - 2030 (USD Billion)
278. Brazil textile market volume in technical, by sub-application, 2018 - 2030 (Kilotons)
279. Brazil textile market revenue in technical, by sub-application, 2018 - 2030 (USD Billion)
280. Brazil textile market volume in fashion & clothing, by sub-application, 2018 - 2030 (Kilotons)
281. Brazil textile market revenue in fashion & clothing, by sub-application, 2018 - 2030 (USD Billion)
282. Middle East & Africa textile market, 2018 - 2030 (Kilotons) (USD Billion)
283. Middle East & Africa textile market volume, by raw material, 2018 - 2030 (Kilotons)
284. Middle East & Africa textile market revenue, by raw material, 2018 - 2030 (USD Billion)
285. Middle East & Africa textile market volume, by product, 2018 - 2030 (Kilotons)
286. Middle East & Africa textile market revenue, by product, 2018 - 2030 (USD Billion)
287. Middle East & Africa textile market volume, by application, 2018 - 2030 (Kilotons)
288. Middle East & Africa textile market revenue, by application, 2018 - 2030 (USD Billion)
289. Middle East & Africa textile market volume in household, by sub-application, 2018 - 2030 (Kilotons)
290. Middle East & Africa textile market revenue in household, by sub-application, 2018 - 2030 (USD Billion)
291. Middle East & Africa textile market volume in technical, by sub-application, 2018 - 2030 (Kilotons)
292. Middle East & Africa textile market revenue in technical, by sub-application, 2018 - 2030 (USD Billion)
293. Middle East & Africa textile market volume in fashion & clothing, by sub-application, 2018 - 2030 (Kilotons)
294. Middle East & Africa textile market revenue in fashion & clothing, by sub-application, 2018 - 2030 (USD Billion)
295. Saudi Arabia textile market, 2018 - 2030 (Kilotons) (USD Billion)
296. Saudi Arabia textile market volume, by raw material, 2018 - 2030 (Kilotons)
297. Saudi Arabia textile market revenue, by raw material, 2018 - 2030 (USD Billion)
298. Saudi Arabia textile market volume, by product, 2018 - 2030 (Kilotons)
299. Saudi Arabia textile market revenue, by product, 2018 - 2030 (USD Billion)
300. Saudi Arabia textile market volume, by application, 2018 - 2030 (Kilotons)
301. Saudi Arabia textile market revenue, by application, 2018 - 2030 (USD Billion)
302. Saudi Arabia textile market volume in household, by sub-application, 2018 - 2030 (Kilotons)
303. Saudi Arabia textile market revenue in household, by sub-application, 2018 - 2030 (USD Billion)
304. Saudi Arabia textile market volume in technical, by sub-application, 2018 - 2030 (Kilotons)
305. Saudi Arabia textile market revenue in technical, by sub-application, 2018 - 2030 (USD Billion)
306. Saudi Arabia textile market volume in fashion & clothing, by sub-application, 2018 - 2030 (Kilotons)
307. Saudi Arabia textile market revenue in fashion & clothing, by sub-application, 2018 - 2030 (USD Billion)
308. Iran textile market, 2018 - 2030 (Kilotons) (USD Billion)
309. Iran textile market volume, by raw material, 2018 - 2030 (Kilotons)
310. Iran textile market revenue, by raw material, 2018 - 2030 (USD Billion)
311. Iran textile market volume, by product, 2018 - 2030 (Kilotons)
312. Iran textile market revenue, by product, 2018 - 2030 (USD Billion)
313. Iran textile market volume, by application, 2018 - 2030 (Kilotons)
314. Iran textile market revenue, by application, 2018 - 2030 (USD Billion)
315. Iran textile market volume in household, by sub-application, 2018 - 2030 (Kilotons)
316. Iran textile market revenue in household, by sub-application, 2018 - 2030 (USD Billion)
317. Iran textile market volume in technical, by sub-application, 2018 - 2030 (Kilotons)
318. Iran textile market revenue in technical, by sub-application, 2018 - 2030 (USD Billion)
319. Iran textile market volume in fashion & clothing, by sub-application, 2018 - 2030 (Kilotons)
320. Iran textile market revenue in fashion & clothing, by sub-application, 2018 - 2030 (USD Billion)
321. Company ranking analysis
322. Global textile market vendor landscape
List of Figures
1. Textile Market Segmentation
2. Penetration and growth prospect mapping (Kilotons) (USD Billion)
3. Value Chain Analysis
4. Market Dynamics
5. Market Drivers
6. Market Restraints
7. Global personal protective equipment market, 2018 - 2030 (USD Billion)
8. Global automobile production, 2016 - 2019 (Billion Units)
9. Construction industry growth in Asia Pacific, 2016 - 2027
10. U.S. construction industry, 2016 - 2019 (USD Billion)
11. Textile Market - Porter’s Five Forces Model
12. PESTEL Analysis
13. Textile market: Raw material movement analysis
14. Textile market: Product movement analysis
15. Textile market: Application movement analysis
16. Textile Market Regional Overview
17. North America Textile Market Regional Overview
18. Europe Textile Market Regional Overview
19. Asia Pacific Textile Market Regional Overview
20. CSA Textile Market Regional Overview
21. MEA Textile Market Regional Overview
22. Competitive environment
23. Strategy Framework
Market Segmentation
Fashion is increasingly gaining importance in the lifestyle of consumers. This can be attributed to the constant exposure to advertisements resulting in impulsive buying. Social media is another major factor contributing to the rising demand for fashion clothing. Companies such as H&M and Zara utilize social media platforms to attract potential customers and gain higher market shares. The emergence of e-commerce is expected to lead to further expansion of the fashion industry, through increased local and global brand awareness, reduced costs of leasing stores, reduced staffing needs, new growth opportunities, and ease of expansion in the market with fewer geographical challenges. These factors are projected to propel the demand for fashionable clothing, thereby promoting the overall market growth.
The rising importance of employee safety at the workplace is fuel the growth of the personal global protective textile market. Various rules and regulations regarding employee safety and wellness have been issued by the governments across the world. Mandatory policies implemented by agencies for worker safety in various industries are projected to fuel the demand for protective textiles. These regulations specify the type of protective textile required for different industrial and commercial settings. Increasing awareness of the importance of worker safety and security, coupled with stringent regulations and high costs associated with workplace hazards, is anticipated to drive market growth. With the growing GDP and increasing employment in industries across Asia Pacific and Middle East; worker safety has become paramount. Companies emphasize worker safety and have established safety guidelines in order to reduce workplace hazards that adversely impact the operational costs.
The manufacturing of textile products has the potential to negatively impact the environment. Increased use of chemicals, generation & disposal of waste, water usage, and CO2 emissions are some of the factors resulting in the high environmental pollution. The water consumption by clothing and apparel manufacturing industries is high and is estimated to cause stress on the available natural resource. Major cotton-producing economies such as China and India are anticipated to witness medium to high level of water scarcities over the forecast period. In addition, the increasing amount of carbon dioxide emitted from the textile industries is estimated to pose a threat to the environment. Consequently, the implementation of stringent environment safety norms by governments is likely to restrain the market’s expansion.
This section will provide insights into the contents included in this textile market report and help gain clarity on the structure of the report to assist readers in navigating smoothly.
Industry overview
Industry trends
Market drivers and restraints
Market size
Growth prospects
Porter’s analysis
PESTEL analysis
Key market opportunities prioritized
Competitive landscape
Company overview
Financial performance
Product benchmarking
Latest strategic developments
Market size, estimates, and forecast from 2018 to 2030
Market estimates and forecast for product segments up to 2030
Regional market size and forecast for product segments up to 2030
Market estimates and forecast for application segments up to 2030
Regional market size and forecast for application segments up to 2030
Company financial performance
A three-pronged approach was followed for deducing the textile market estimates and forecasts. The process has three steps: information procurement, analysis, and validation. The whole process is cyclical, and steps repeat until the estimates are validated. The three steps are explained in detail below:
Information procurement: Information procurement is one of the most extensive and important stages in our research process, and quality data is critical for accurate analysis. We followed a multi-channel data collection process for textile market to gather the most reliable and current information possible.
Analysis: We mine the data collected to establish baselines for forecasting, identify trends and opportunities, gain insight into consumer demographics and drivers, and so much more. We utilized different methods of textile market data depending on the type of information we’re trying to uncover in our research.
Market Research Efforts: Bottom-up Approach for estimating and forecasting demand size and opportunity, top-down Approach for new product forecasting and penetration, and combined approach of both Bottom-up and Top-down for full coverage analysis.
Value-Chain-Based Sizing & Forecasting: Supply-side estimates for understanding potential revenue through competitive benchmarking, forecasting, and penetration modeling.
Demand-side estimates for identifying parent and ancillary markets, segment modeling, and heuristic forecasting.
Qualitative Functional Deployment (QFD) Modelling for market share assessment.
Market formulation and validation: We mine the data collected to establish baselines for forecasting, identify trends and opportunities, gain insight into consumer demographics and drivers, and so much more. We utilize different methods of data analysis depending on the type of information we’re trying to uncover in our research.
Market Formulation: This step involves the finalization of market numbers. This step on an internal level is designed to manage outputs from the Data Analysis step.
Data Normalization: The final market estimates and forecasts are then aligned and sent to industry experts, in-panel quality control managers for validation.
This step also entails the finalization of the report scope and data representation pattern.
Validation: The process entails multiple levels of validation. All these steps run in parallel, and the study is forwarded for publishing only if all three levels render validated results.
The textile market was categorized into four segments, namely raw-material (Cotton, Chemical, Wool, Silk), product (Natural fibers, Polyesters, Nylon), application (Household, Technical, Fashion & Clothing), and region (North America, Europe, Asia Pacific, Central & South America, and Middle East & Africa)
The textile market was segmented into raw-material, product, application, and regions. The demand at a segment level was deduced using a funnel method. Concepts like the TAM, SAM, SOM, etc., were put into practice to understand the demand. We at GVR deploy three methods to deduce market estimates and determine forecasts. These methods are explained below:
Demand estimation of each product across countries/regions summed up to from the total market.
Variable analysis for demand forecast.
Demand estimation via analyzing paid database, and company financials either via annual reports or paid database.
Primary interviews for data revalidation and insight collection.
Used extensively for new product forecasting or analyzing penetration levels.
Tool used invoice product flow and penetration models Use of regression multi-variant analysis for forecasting Involves extensive use of paid and public databases.
Primary interviews and vendor-based primary research for variable impact analysis.
The textile market was analyzed at a regional level. The globe was divided into North America, Europe, Asia Pacific, Central & South America, and Middle East & Africa, keeping in focus variables like consumption patterns, export-import regulations, consumer expectations, etc. These regions were further divided into sixteen countries, namely, the U.S., Canada, Mexico, Germany, the UK, France, Russia, Turkey, Italy, China, India, Japan, Australia, Saudi Arabia, Iran, Brazil.
All three above-mentioned market research methodologies were applied to arrive at regional-level conclusions. The regions were then summed up to form the global market.
The textile market was analyzed via companies operating in the sector. Analyzing these companies and cross-referencing them to the demand equation helped us validate our assumptions and conclusions. Key market players analyzed include:
BSL Limited: BSL Limited was established in 1971 and is headquartered in Rajasthan, India. The company's product portfolio includes wool, premium light-weighted fabrics, wool modal, wool-blended, trevira wool, and other specialized product fabrics blended with silk, lycra, tencel, and others. It also offers poly-viscose fabrics, worsted fabrics, and a wide array of naturally blended fabrics such as fiber dyed plaids, natural blend emb, fiber dyed plains, and digital print fabrics.
INVISTA S.R.L.: INVISTA S.R.L. was established in 2003 and is headquartered in Kansas, U.S. The company is engaged in the manufacturing and distribution of fibers, fabrics, polymers, chemical intermediates, and specialty chemicals. The company's sub-segments include Apparel & Advanced Textiles, Intermediates, Performance Solutions, and Performance Technologies. It also offers knowledge expertise in plant process design and project execution in the field of textiles. The company has also offered over 4,400 trademark registrations and filed 1,000 patents.
Lu Thai Textile Co., Ltd.: Lu Thai Textile Co., Ltd. was established in 1988 and is headquartered in Shandong, China. The Luthai Group offers a complete range of industrial solutions for textiles, including yarn spinning, finishing, dyeing, garment making, and brand marketing. The company manufactures and distributes textile products derived from raw materials including fiber, silk, cotton, chemical fiber, wool, and other materials. It exhibits an average annual production of 220 million meters of yarn-dyed fabrics, 30 million shirt pieces, and over 90 million meters of piece-dyed fabrics.
Paramount Textile Limited: Paramount Textile Limited was established in 2006 and is headquartered in Dhaka, Bangladesh. The company is involved in the design and manufacturing of yarns and woven fabrics. In 2008, it began its commercial production of yarns and fabrics. The company's product portfolio includes 100% cotton yarn-dyed fabrics, woven fabrics, cotton solid white fabrics, stretch fabrics, and striped & checked shirts. As of 2021, its annual production capacity of yarn dyeing was 110,000 yds. Per day and out of which 91.49% is actually utilized by the company.
Paulo de Oliveira, S.A.: Paulo de Oliveira, S.A. was established in 1936 and is headquartered in Covilhã, Portugal. The company is engaged in the production and distribution of textile products. It conducts a broader range of textile processes such as production from fabric to fabric, spinning, weaving, dyeing, and finishing. The PAULO DE OLIVEIRA Group comprises three companies in the field of textiles, namely Paulo De Oliveira, Tessimax, and Penteadora.
Successori REDA S.p.A.: Successori REDA S.p.A. was established in 1865 and is headquartered in Valle Mosso, Italy. Reda has been a prominent group in the design and production of pure wool fabrics for making high-quality suits. It offers a range of luxury products for top fashion brands. The company exports its fabrics and suits all over the world through its wide distribution network. The Successori REDA S.p.A Group comprises divisions, namely REDA 1865, REDA active, REDA flexo, and rewoolution. Each division is involved in the production of classic and tailored fabrics, which are ideal for physical activity and everyday challenges.
Shandong Jining Ruyi Woolen Textile Co., Ltd.: Shandong Jining Ruyi Woolen Textile Co., Ltd. was established in 1972 and is headquartered in Shandong, China. It is also known as Shandong Ruyi Woolen Garment Group Co., Ltd. The company is engaged in the production and sales of cotton and woolen textiles and garments to domestic and international markets. It designs, manufactures, and distributes worsted fabric products under the brand name of Ruyi. The company exhibits an integrated value chain right from the supply of raw materials to the distribution of textile products.
China Textile (Shenzhen) Co. Ltd: China Textile (Shenzhen) Co. Ltd was established in 1999 and is headquartered in Shenzhen, China. Initially, it was a trading company and later started specializing in research & development, design, and sales of upper-mid-ranged fabrics. The company is engaged in the manufacturing and sales of fabrics such as outdoor, business, and eco-friendly casuals and mid-ranged fabrics. It offers customized fabric solutions to an array of international clients and acclaimed fashion brands. The company manufactures European-style fabrics in China with technical expertise obtained from fabric producers in Spain and Italy.
Modern Woolens Ltd.: Modern Woolens Ltd. was established in 1973 and is headquartered in Rajasthan, India. It is a modern group company incorporated as a spinning carpet yarn manufacturer. Later, it became a prominent designer and producer of other textile businesses such as suiting, thread, insulators, and types of denim, towels, and others. The company designs and manufactures products such as worsted yarns that include pure wool yarns and poly/wool yarns. Pure merino wool tops and woolen & semi-worsted yarns are the other products manufactured by the company for the clothing and carpet industries.
JCT Limited: JCT Limited was established in 1946 and headquartered in New Delhi, India. The company is considered as a prominent manufacturer of textiles and filament yarns. JCT Limited, a distinct company of the Thapar Group, has a distinct business involving the production of synthetic & blended textiles, cotton, and filament yarn of nylon. The company has integrated its operations in various spheres which include spinning, weaving, and processing along with production and quality control facilities. The company has two primary work divisions, the textile division, and the filament division. The textile division is the largest segment in the company and has a product range of materials including 100% cotton, 100% nylon, 100% polyester, including an array of blends such as cotton-polyester, polyester-viscose, and cotton-nylon. In addition, the company uses linen and bamboo fibers to make special effects in its different fabric blends.
Supply Side Estimates
Company revenue estimation via referring to annual reports, investor presentations, and Hoover’s.
Segment revenue determination via variable analysis and penetration modeling.
Competitive benchmarking to identify market leaders and their collective revenue shares.
Forecasting via analyzing commercialization rates, pipelines, market initiatives, distribution networks, etc.
Demand side estimates
Identifying parent markets and ancillary markets
Segment penetration analysis to obtain pertinent
revenue/volume
Heuristic forecasting with the help of subject matter experts
Forecasting via variable analysis
Understanding market dynamics (in terms of drivers, restraints, & opportunities) in the countries.
Understanding trends & variables in the individual countries & their impact on growth and using analytical tools to provide high-level insights into the market dynamics and the associated growth pattern.
Understanding market estimates and forecasts (with the base year as 2022, historic information from 2018 to 2021, and forecast from 2023 to 2030). Regional estimates & forecasts for each category are available and are summed up to form the global market estimates.
The report provides market value for the base year 2022 and a yearly forecast till 2030 in terms of revenue/volume or both. The market for each of the segment outlooks has been provided on region & country basis for the above-mentioned forecast period.
The key industry dynamics, major technological trends, and application markets are evaluated to understand their impact on the demand for the forecast period. The growth rates were estimated using correlation, regression, and time-series analysis.
We have used the bottom-up approach for market sizing, analyzing key regional markets, dynamics, & trends for various products and end-users. The total market has been estimated by integrating the country markets.
All market estimates and forecasts have been validated through primary interviews with the key industry participants.
Inflation has not been accounted for to estimate and forecast the market.
Numbers may not add up due to rounding off.
Europe consists of EU-8, Central & Eastern Europe, along with the Commonwealth of Independent States (CIS).
Asia Pacific includes South Asia, East Asia, Southeast Asia, and Oceania (Australia & New Zealand).
Latin America includes Central American countries and the South American continent
Middle East includes Western Asia (as assigned by the UN Statistics Division) and the African continent.
GVR strives to procure the latest and unique information for reports directly from industry experts, which gives it a competitive edge. Quality is of utmost importance to us, therefore every year we focus on increasing our experts’ panel. Primary interviews are one of the critical steps in identifying recent market trends and scenarios. This process enables us to justify and validate our market estimates and forecasts to our clients. With more than 8,000 reports in our database, we have connected with some key opinion leaders across various domains, including healthcare, technology, consumer goods, and the chemical sector. Our process starts with identifying the right platform for a particular type of report, i.e., emails, LinkedIn, seminars, or telephonic conversation, as every report is unique and requires a differentiated approach.
We send out questionnaires to different experts from various regions/ countries, which is dependent on the following factors:
Report/Market scope: If the market study is global, we send questionnaires to industry experts across various regions, including North America, Europe, Asia Pacific, Latin America, and MEA.
Market Penetration: If the market is driven by technological advancements, population density, disease prevalence, or other factors, we identify experts and send out questionnaires based on region or country dominance.
The time to start receiving responses from industry experts varies based on how niche or well-penetrated the market is. Our reports include a detailed chapter on the KoL opinion section, which helps our clients understand the perspective of experts already in the market space.
NEED A CUSTOM REPORT?
We can customize every report - free of charge - including purchasing stand-alone sections or country-level reports, as well as offer affordable discounts for start-ups & universities. Contact us now
We are GDPR and CCPA compliant! Your transaction & personal information is safe and secure. For more details, please read our privacy policy.
"The quality of research they have done for us has been excellent."