GVR Report cover Biotechnology Market Size, Share & Trend Report

Biotechnology Market Size, Share & Trend Analysis By Technology (Nanobiotechnology, DNA Sequencing, Cell-based Assays), By Application (Health, Bioinformatics), By Region, And Segment Forecasts, 2024 - 2030

  • Report ID: 978-1-68038-134-4
  • Number of Report Pages: 135
  • Format: PDF, Horizon Databook
  • Historical Range: 2018 - 2023
  • Forecast Period: 2023 - 2030 
  • Industry: Healthcare

Biotechnology Market Size & Trends

The global biotechnology market was valued at USD 1.55 trillion in 2023 and is projected to grow at a compound annual growth rate (CAGR) of 13.96% from 2024 to 2030. The market is driven by strong government support through initiatives aimed at the modernization of regulatory framework, improvements in approval processes & reimbursement policies, as well as standardization of clinical studies. The growing foothold of personalized medicine and an increasing number of orphan drug formulations are opening new avenues for biotechnology applications and are driving the influx of emerging and innovative biotechnology companies, further boosting the market revenue.
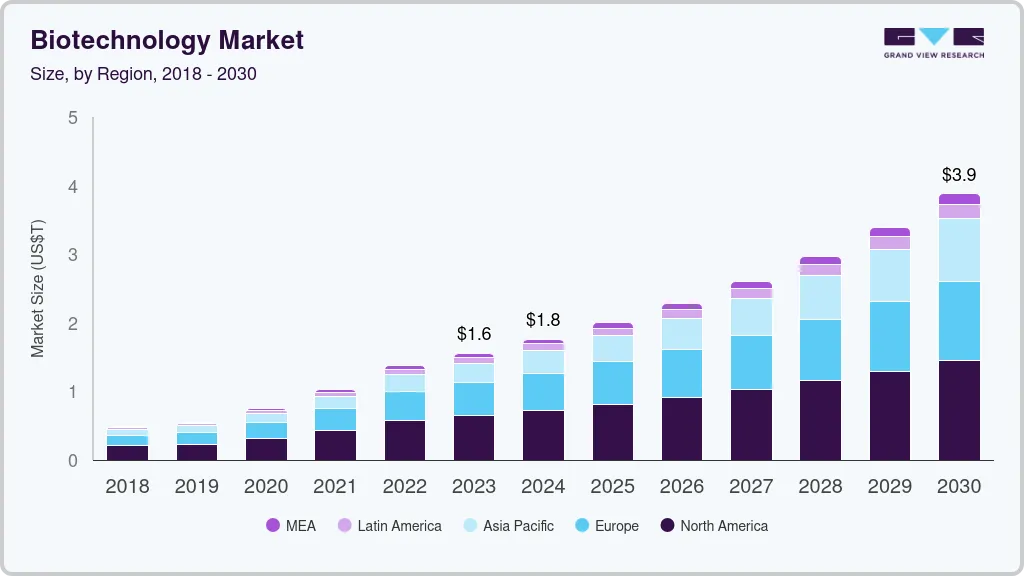
U.S. Biotechnology market size and growth rate, 2024 - 2030

The COVID-19 pandemic has positively impacted the biotechnology market by propelling a rise in opportunities and advancements for drug development and manufacturing of vaccines for the disease. For instance, in 2021, over 11 billion doses of COVID-19 vaccine were produced globally, resulting in vaccination of about half of the world’s population within a year. Furthermore, the success of mRNA vaccines and accelerated approval processes have led to a surge in vaccine-related revenues, as evident by a combined revenue generation of around USD 31 billion in 2021 from Moderna, Pfizer/BioNTech, and Johnson & Johnson vaccines.

Expanding demand for biotechnology tools for agricultural applications including micro-propagation, molecular breeding, tissue culturing, conventional plant breeding & development of genetically modified crops, among others, have boosted the market growth. Moreover, genetically modified crops and herbicide-tolerant & insect resistant seeds are witnessing an increasing popularity and are contributing to the market growth. Rise in adoption of tissue culture technology for production of novel rice variants and disease- & pest-free banana varieties in regions of South Asia and Africa, and use of the technology for cloning of disease-free and nutritious plant varieties have propelled the agricultural applications for biotechnology.

The market is also driven by the presence of strong clinical trial pipeline and funding opportunities available in tissue engineering and regeneration technologies. As per the Alliance for Regenerative Medicine, companies developing cell and gene therapies raised over USD 23.1 billion investments globally in 2021, an increase of about 16% over 2020’s total of USD 19.9 billion. Clinical success of leading gene therapy players in 2021, such as promising results from an in vivo CRISPR treatment for transthyretin amyloidosis, developed by Intellia Therapeutics and Regeneron, are significantly affecting the market growth.

Rising demand for clinical solutions for the treatment of chronic diseases such as cancer, diabetes, age-related macular degeneration, and almost all forms of arthritis are anticipated to boost the market. Major firms are investigating and developing pipeline products for diabetes and neurological disorders, such as Parkinson’s & Alzheimer’s diseases, various types of cancers and cardiovascular diseases. For instance, according to clinicaltrials.gov, as of January 2021, there were 126 agents in clinical trials for the treatment of Alzheimer's disease, with 28 treatments in phase III trials.

Life sciences and healthcare sectors are experiencing a widespread use of fermentation technology and have positively impacted the market growth. Several modifications and advancements in the conventional bioreactors, such as introduction of simplified bioreactors and vortex bioreactors have led to improvements in the fermentation technology and growth in its adoption. Furthermore, vortex bioreactors have also been improvised for wastewater processing, to offer an enhanced operational feasibility. These modifications and improvement in fermentation technology are expected to accelerate market growth in the near future.

CAR T and TCR T-cell therapies are being explored as potential treatment options against chronic viral infections, such as HIV, hepatitis B, and SARS-CoV-2. For instance, scientists at Duke-NUS Medical School are evaluating the use of T-cell therapy in combating the COVID-19 infection. The scientists have demonstrated that TCR-redirected T cells exhibit a functional profile comparable to that of SARS-specific CD8 memory T cells obtained from patients who have recovered from the infection. Such investigations are anticipated to spur further research prospects in this domain and drive the market growth.

Biotechnological techniques including stem cell technology, DNA fingerprinting, and genetic engineering, among other, are gaining significant traction since past few years. Technological advancement in stem cell therapeutics, increasing demand for biologics, and a growing focus on the development of personalized medicines have resulted in a growing market for stem cell technologies. DNA fingerprinting applications are on the rise in forensic science, and for investigation of family relationships in animal populations as well as measurement of the extent of inbreeding. Similarly, genetic engineering and cloning techniques are being increasingly used in animal breeding and for manufacturing of complex biological substances.

Market Concentration & Characteristics

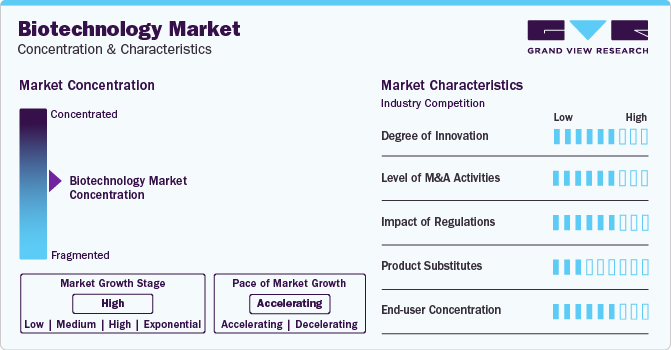
The market growth stage is high, and the pace of the market growth is accelerating. The biotechnology market is characterized by a high degree of innovation due to rapid advancements in genomics, molecular biology, cellular & tissue engineering, bioimaging, novel drug discovery, and delivery methodologies. Such advancements are anticipated to generate prospects for enhancing diagnostic capacities & broadening treatment alternatives.

The market is also characterized by a high level of merger and acquisition (M&A) activity by the leading players. For instance, in October 2023, Amgen announced that it has completed its acquisition of Horizon Therapeutics plc. Horizon Therapeutics is a biopharmaceutical company focused on developing and commercializing therapies for rare genetic and autoimmune diseases.
Biotechnology Market Concentration & Characteristics

There are several regulatory barriers to clinical applications in regenerative medicine, tissue engineering, and stem cells. Stem cell-based therapies are regulated differently in all the countries around the world. Gaining approval for stem cell-based therapies from regulatory authorities is one of the most significant challenges market players face. For instance, stringent norms must be followed to conduct research on embryonic stem cells and introduce changes in gene regulation in humans.

Due to the requirement of heavy investment for the successful development of diagnostic technologies, therapies for the treatment of major diseases, and the increasing biopharmaceutical research is anticipated to lower the risk of product substitution.

Technology Insights

DNA sequencing held a significant market share of 17.43% in 2023 which can be attributed to declining sequencing costs and rising penetration of advanced DNA sequencing techniques. Government funding in genetic research has enabled a rise in applications of sequencing for better understanding of diseases. For instance, in May 2021, a USD 10.7 million NIH grant was awarded to the University of Pittsburgh Graduate School of Public Health and Washington University School of Medicine in St. Louis, for investigation of the genetic basis of Alzheimer’s disease.

Nanobiotechnology is expected to grow at a significant growth rate from 2024 to 2030 owing to an increase in nanomedicine approvals and the advent of advanced technology. For instance, applications of theranostics nanoparticles have gained impetus for enabling prompt diagnosis and customization of treatment options for multiple disorders at once. Factors such as low toxicity, smaller size, and chemical plasticity of nanoparticles have proved to be beneficial for overcoming the limitation associated with conventional routes of generic drug administration. Furthermore, tissue engineering and regeneration medicine held a significant share due to government and private investments in the field, along with high healthcare spending and presence of significant number of mature and emerging players in this space. These factors are expected to drive the segment growth over the forecast period.

Application Insights

The health application segment accounted for the largest share in 2023. Growing disease burden, increasing availability of agri-biotech & bio-services, and technological developments in bio-industrial sector are expected to drive the segment growth. In addition, the segment growth is also fueled by significant advancements in the fields of Artificial Intelligence (AI), machine learning, and big data, which are expected to increase penetration of bioinformatics applications, especially in industries such as food and beverages.
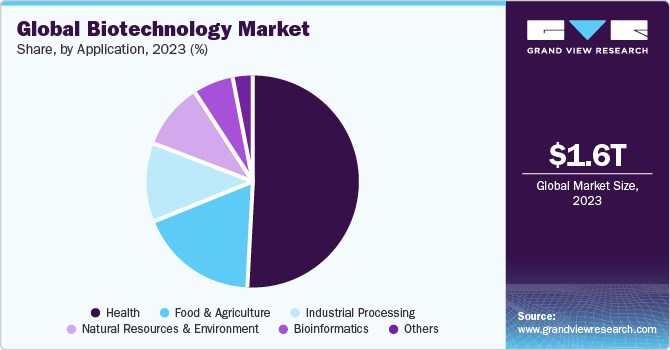
Global Biotechnology market share and size, 2023

Moreover, collaborative efforts and partnerships aimed at development and commercialization of new therapeutic platforms and molecules are anticipated to drive the market growth. For instance, in January 2021, Novartis collaborated with Alnylam for exploring the application of the latter’s siRNA technology for development of targeted therapy for restoration of liver function. Similarly, in September 2021, AstraZeneca and VaxEquity collaborated for development and commercialization of self-amplifying RNA therapeutics platform to explore novel therapeutic programs. Furthermore, growing demand for biosimilars and rising applications of precision medicine are expected to boost segment growth during the forecast period.

Regional Insights

North America accounted for the largest share of 41.37% in 2023. The regional market is witnessing growth due to several factors, such as the presence of key players, extensive R&D activities, and high healthcare expenditure. The region has a high penetration of genomics, proteomics, and cell biology-based platforms that is accelerating the adoption of life sciences tools. Furthermore, rise in prevalence of chronic diseases and rising adoption of personalized medicine applications for the treatment of life threatening disorders is expected to positively impact the market growth in the region.
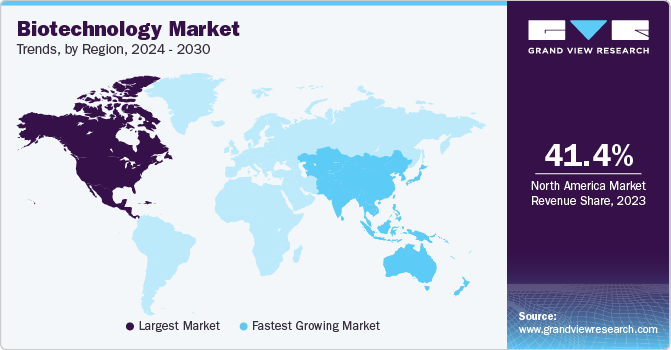
Biotechnology Market Trends, by Region, 2024 - 2030

Asia Pacific is expected to expand at the fastest growth rate from 2024 to 2030. The growth of the regional market can be attributed to increasing investments and improvement in healthcare infrastructure, favorable government initiatives, and expansion strategies from key market players. For instance, in February 2022, Moderna Inc. announced its plans for a geographic expansion of its commercial network in Asia through opening of four new subsidiaries in Malaysia, Singapore, Hong Kong, and Taiwan. In addition, biopharmaceutical collaborations, such as Kiniksa Pharmaceuticals and Huadong Medicine’s strategic collaboration for development and commercialization of Kiniksa’s ARCALYST and mavrilimumab in the Asia-Pacific region are expected to drive the market growth.

  • The biotechnology market in India is majorly driven by the application of biotechnology in the healthcare sector, which majorly includes recombinant therapeutics and vaccines. According to Biospectrum, in December 2023, India was a global supplier of BCG, DBT, and measles vaccines, making it a prominent player in the biotechnology market.

Key Companies & Market Share Insights

The biotechnology market is currently observing a trend where-in companies are joining forces through business collaborations, partnership, and development agreements etc. These strategic initiatives are mainly driven by the need to develop novel therapeutics in a collaborative manner for better outcomes as well as reduced overheads.

Key Biotechnology Companies:

  • AstraZeneca
  • Gilead Sciences, Inc.
  • Bristol-Myers Squibb
  • Sanofi
  • Biogen
  • Abbott Laboratories
  • Pfizer, Inc.
  • Amgen Inc.
  • Novo Nordisk A/S
  • Merck KGaA
  • Johnson & Johnson Services, Inc.
  • Novartis AG
  • F. Hoffmann-La Roche Ltd.
  • Lonza

Recent Developments

  • In October 2023, Gilead Sciences, Inc. and Assembly Biosciences collaborated to create advanced therapeutics for severe viral diseases.

  • In October 2023, Gilead's subsidiary, Kite and Epicrispr Biotechnologies, announced a research collaboration and licensing agreement to utilize Epic Bio's gene regulation platform in developing advanced cancer cell therapies.

  • In September 2023, Merck KGaA announced collaborations with BenevolentAI and Exscientia, leveraging artificial intelligence for drug discovery in oncology, neurology, and immunology, with the potential to produce innovative candidates for clinical development.

  • In July 2023, Alexion and AstraZeneca Rare Disease announced an agreement with Pfizer Inc. to procure preclinical gene therapy programs, solidifying their dedication to advancing next-generation genomic medicines by incorporating complementary assets and cutting-edge technologies.

  • In June 2023, Lonza acquired Synaffix B.V., a biotechnology company specializing in advancing its clinical-stage technology platform for ADC development. The revenues and margins of Synaffix were expected to be incorporated into Lonza's business accounts starting from the acquisition date.

  • In January 2023, Anima Biotech collaborated with AbbVie to accelerate the development of novel mRNA biology modulators for the treatment of various oncology and immunology targets. Some of the key players in the global biotechnology market include:

  • In December 2022, Merck KGaA announced a collaboration with Mersana Therapeutics to advance the development of antibody-drug conjugates (ADCs), specifically focusing on novel STING-agonist ADCs targeting up to two distinct targets. This collaboration aimed at harnessing the potential of ADCs for therapeutic innovation.

Biotechnology Report Scope

Report Attribute

Details

Market size value in 2024

USD 1.76 trillion

Revenue forecast in 2030

USD 3.88 trillion

Growth rate

CAGR of 13.96% from 2024 to 2030

Actual data

2018 - 2023

Forecast period

2024 - 2030

Quantitative units

Revenue in USD billion and CAGR from 2024 to 2030

Report coverage

Revenue forecast, company ranking, competitive landscape, growth factors, and trends

Segments covered

Technology, application, region

Regional scope

North America; Europe; Asia Pacific; Latin America; MEA

Country scope

U.S.; Canada; Germany; UK; France; Italy; Spain; Denmark; Sweden; Norway; Japan; China; India; South Korea; Thailand; Australia; Brazil; Mexico; Argentina; South Africa; Saudi Arabia; UAE; Kuwait

Key companies profiled

AstraZeneca, Gilead Sciences, Inc., Bristol-Myers Squibb, Biogen, Abbott Laboratories, Amgen Inc., Novo Nordisk A/S, Merck KGaA., Johnson & Johnson Services, Inc., Novartis AG, Sanofi, F. Hoffmann-La Roche Ltd., Pfizer, Inc., Lonza

Customization scope

Free report customization (equivalent up to 8 analyst’s working days) with purchase. Addition or alteration to country, regional & segment scope.

Pricing and purchase options

Avail customized purchase options to meet your exact research needs. Explore purchase options


Global Biotechnology Market Report Segmentation

This report forecasts revenue growth and provides an analysis on the latest trends in each of the sub-segments from 2018 to 2030. For the purpose of this report, Grand View Research has segmented the biotechnology market on the basis of technology, application and regions
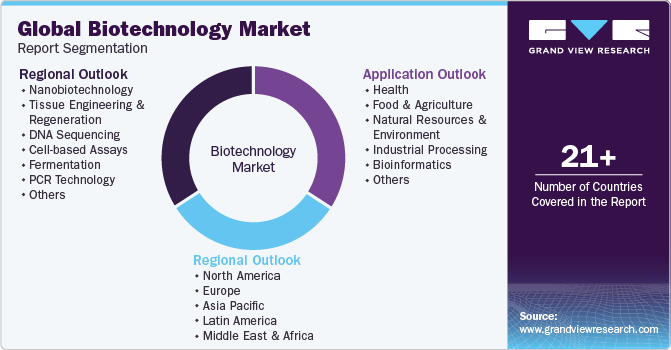
Global Biotechnology Market Report Segmentation

  • Technology Outlook (Revenue, USD Billion, 2018 - 2030)

    • Nanobiotechnology

    • Tissue Engineering and Regeneration

    • DNA Sequencing

    • Cell-based Assays

    • Fermentation

    • PCR Technology

    • Chromatography

    • Others

  • Application Outlook (Revenue, USD Billion, 2018 - 2030)

    • Health

    • Food & Agriculture

    • Natural Resources & Environment

    • Industrial Processing

    • Bioinformatics

    • Others

  • Regional Outlook (Revenue, USD Billion, 2018- 2030)

    • North America

      • U.S.

      • Canada

    • Europe

      • Germany

      • UK

      • France

      • Italy

      • Spain

      • Denmark

      • Sweden

      • Norway

    • Asia Pacific

      • Japan

      • China

      • India

      • South Korea

      • Thailand

      • Australia

    • Latin America

      • Brazil

      • Mexico

      • Argentina

    • Middle East & Africa

      • South Africa

      • Saudi Arabia

      • UAE

      • Kuwait

Frequently Asked Questions About This Report

Table of Contents

Chapter 1. Biotechnology Market: Methodology and Scope
                   1.1. Information Procurement
                   1.2. Information Or Data Analysis
                   1.3. Market Scope & Segment Definition
                   1.4. Market Model
                       1.4.1. Market Study, By Company Market Share
                       1.4.2. Regional Analysis
Chapter 2. Biotechnology Market: Executive Summary
                   2.1. Market Snapshot
                   2.2. Segment Snapshot
                   2.3. Competitive Landscape Snapshot
Chapter 3. Biotechnology Market: Variables, Trends, & Scope
                   3.1. Market Lineage Outlook
                       3.1.1. Parent Market Outlook
                       3.1.2. Related/Ancillary Market Outlook
                   3.2. Market Dynamics
                       3.2.1. Market Driver Analysis
                           3.2.1.1. Presence Of Favorable Government Initiatives
                           3.2.1.2. Rising Demand For Agro-Based Products
                           3.2.1.3. Growing Demand For Synthetic Biology
                           3.2.1.4. Declining Prices Of DNA Sequencing
                           3.2.1.5. Growing Healthcare Expenditure Boosting Development Of Effective Personalized Diagnostic & Therapeutic Procedures For Cancer
                       3.2.2. Market Restraint Analysis
                           3.2.2.1. Ethical & Legal Limitations
                           3.2.2.2. Risks Associated With GM Organisms And Crops
                           3.2.2.3. Challenges Associated With NGS Implementation
                   3.3. Industry Analysis Tools
                       3.3.1. Porter’s Five Forces Analysis
                       3.3.2. PESTEL Analysis
                       3.3.3. COVID-19 Impact Analysis
Chapter 4. Technology Business Analysis
                   4.1. Biotechnology Market: Technology Movement Analysis
                   4.2. Nanobiotechnology
                       4.2.1. Nanobiotechnology Market, 2018 - 2030 (USD Billion)
                   4.3. Tissue Engineering and Regeneration
                       4.3.1. Tissue Engineering and Regeneration Market, 2018 - 2030 (USD Billion)
                   4.4. DNA Sequencing
                       4.4.1. DNA Sequencing Market, 2018 - 2030 (USD Billion)
                   4.5. Cell-based Assays
                       4.5.1. Cell-based Assays Market, 2018 - 2030 (USD Billion)
                   4.6. Fermentation
                       4.6.1. Fermentation Market, 2018 - 2030 (USD Billion)
                   4.7. PCR Technology
                       4.7.1. PCR Technology Market, 2018 - 2030 (USD Billion)
                   4.8. Chromatography
                       4.8.1. Chromatography Market, 2018 - 2030 (USD Billion)
                   4.9. Others
                       4.9.1. Other Technology Market, 2018 - 2030 (USD Billion)
Chapter 5. Application Business Analysis
                   5.1. Biotechnology Market: Application Movement Analysis
                   5.2. Health
                       5.2.1. Health Market, 2018 - 2030 (USD Billion)
                   5.3. Food & Agriculture
                       5.3.1. Food & Agriculture Market, 2018 - 2030 (USD Billion)
                   5.4. Natural Resources & Environment
                       5.4.1. Natural Resources & Environment Market, 2018 - 2030 (USD Billion)
                   5.5. Industrial Processing
                       5.5.1. Industrial Processing Market, 2018 - 2030 (USD Billion)
                   5.6. Bioinformatics
                       5.6.1. Bioinformatics Market, 2018 - 2030 (USD Billion)
                   5.7. Others
                       5.7.1. Other Application Market, 2018 - 2030 (USD Billion)
Chapter 6. Regional Business Analysis
                   6.1. Biotechnology Market Share By Region, 2022 & 2030
                   6.2. North America
                       6.2.1. North America Biotechnology Market, 2018 - 2030 (USD Billion)
                       6.2.2. U.S.
                           6.2.2.1. Key Country Dynamics
                           6.2.2.2. Target Disease Prevalence
                           6.2.2.3. Competitive Scenario
                           6.2.2.4. Regulatory Framework
                           6.2.2.5. Reimbursement Scenario
                           6.2.2.6. U.S. Biotechnology Market, 2018 - 2030 (USD Billion)
                       6.2.3. Canada
                           6.2.3.1. Key Country Dynamics
                           6.2.3.2. Target Disease Prevalence
                           6.2.3.3. Competitive Scenario
                           6.2.3.4. Regulatory Framework
                           6.2.3.5. Reimbursement Scenario
                           6.2.3.6. Canada Biotechnology Market, 2018 - 2030 (USD Billion)
                   6.3. Europe
                       6.3.1. Europe Biotechnology Market, 2018 - 2030 (USD Billion)
                       6.3.2. UK
                           6.3.2.1. Key Country Dynamics
                           6.3.2.2. Target Disease Prevalence
                           6.3.2.3. Competitive Scenario
                           6.3.2.4. Regulatory Framework
                           6.3.2.5. Reimbursement Scenario
                           6.3.2.6. UK Biotechnology Market, 2018 - 2030 (USD Billion)
                       6.3.3. Germany
                           6.3.3.1. Key Country Dynamics
                           6.3.3.2. Target Disease Prevalence
                           6.3.3.3. Competitive Scenario
                           6.3.3.4. Regulatory Framework
                           6.3.3.5. Reimbursement Scenario
                           6.3.3.6. Germany Biotechnology Market, 2018 - 2030 (USD Billion)
                       6.3.4. France
                           6.3.4.1. Key Country Dynamics
                           6.3.4.2. Target Disease Prevalence
                           6.3.4.3. Competitive Scenario
                           6.3.4.4. Regulatory Framework
                           6.3.4.5. Reimbursement Scenario
                           6.3.4.6. France Biotechnology Market, 2018 - 2030 (USD Billion)
                       6.3.5. Italy
                           6.3.5.1. Key Country Dynamics
                           6.3.5.2. Target Disease Prevalence
                           6.3.5.3. Competitive Scenario
                           6.3.5.4. Regulatory Framework
                           6.3.5.5. Reimbursement Scenario
                           6.3.5.6. Italy Biotechnology Market, 2018 - 2030 (USD Billion)
                       6.3.6. Spain
                           6.3.6.1. Key Country Dynamics
                           6.3.6.2. Target Disease Prevalence
                           6.3.6.3. Competitive Scenario
                           6.3.6.4. Regulatory Framework
                           6.3.6.5. Reimbursement Scenario
                           6.3.6.6. Spain Biotechnology Market, 2018 - 2030 (USD Billion)
                       6.3.7. Denmark
                           6.3.7.1. Key Country Dynamics
                           6.3.7.2. Target Disease Prevalence
                           6.3.7.3. Competitive Scenario
                           6.3.7.4. Regulatory Framework
                           6.3.7.5. Reimbursement Scenario
                           6.3.7.6. Denmark Biotechnology Market, 2018 - 2030 (USD Billion)
                       6.3.8. Sweden
                           6.3.8.1. Key Country Dynamics
                           6.3.8.2. Target Disease Prevalence
                           6.3.8.3. Competitive Scenario
                           6.3.8.4. Regulatory Framework
                           6.3.8.5. Reimbursement Scenario
                           6.3.8.6. Sweden Biotechnology Market, 2018 - 2030 (USD Billion)
                       6.3.9. Norway
                           6.3.9.1. Key Country Dynamics
                           6.3.9.2. Target Disease Prevalence
                           6.3.9.3. Competitive Scenario
                           6.3.9.4. Regulatory Framework
                           6.3.9.5. Reimbursement Scenario
                           6.3.9.6. Norway Biotechnology Market, 2018 - 2030 (USD Billion)
                   6.4. Asia Pacific
                       6.4.1. Asia Pacific Biotechnology Market, 2018 - 2030 (USD Billion)
                       6.4.2. Japan
                           6.4.2.1. Key Country Dynamics
                           6.4.2.2. Target Disease Prevalence
                           6.4.2.3. Competitive Scenario
                           6.4.2.4. Regulatory Framework
                           6.4.2.5. Reimbursement Scenario
                           6.4.2.6. Japan Biotechnology Market, 2018 - 2030 (USD Billion)
                       6.4.3. China
                           6.4.3.1. Key Country Dynamics
                           6.4.3.2. Target Disease Prevalence
                           6.4.3.3. Competitive Scenario
                           6.4.3.4. Regulatory Framework
                           6.4.3.5. Reimbursement Scenario
                           6.4.3.6. China Biotechnology Market, 2018 - 2030 (USD Billion)
                       6.4.4. India
                           6.4.4.1. Key Country Dynamics
                           6.4.4.2. Target Disease Prevalence
                           6.4.4.3. Competitive Scenario
                           6.4.4.4. Regulatory Framework
                           6.4.4.5. Reimbursement Scenario
                           6.4.4.6. India Biotechnology Market, 2018 - 2030 (USD Billion)
                       6.4.5. Australia
                           6.4.5.1. Key Country Dynamics
                           6.4.5.2. Target Disease Prevalence
                           6.4.5.3. Competitive Scenario
                           6.4.5.4. Regulatory Framework
                           6.4.5.5. Reimbursement Scenario
                           6.4.5.6. Australia Biotechnology Market, 2018 - 2030 (USD Billion)
                       6.4.6. Thailand
                           6.4.6.1. Key Country Dynamics
                           6.4.6.2. Target Disease Prevalence
                           6.4.6.3. Competitive Scenario
                           6.4.6.4. Regulatory Framework
                           6.4.6.5. Reimbursement Scenario
                           6.4.6.6. Thailand Biotechnology Market, 2018 - 2030 (USD Billion)
                       6.4.7. South Korea
                           6.4.7.1. Key Country Dynamics
                           6.4.7.2. Target Disease Prevalence
                           6.4.7.3. Competitive Scenario
                           6.4.7.4. Regulatory Framework
                           6.4.7.5. Reimbursement Scenario
                           6.4.7.6. South Korea Biotechnology Market, 2018 - 2030 (USD Billion)
                   6.5. Latin America
                       6.5.1. Latin America Biotechnology Market, 2018 - 2030 (USD Billion)
                       6.5.2. Brazil
                           6.5.2.1. Key Country Dynamics
                           6.5.2.2. Target Disease Prevalence
                           6.5.2.3. Competitive Scenario
                           6.5.2.4. Regulatory Framework
                           6.5.2.5. Reimbursement Scenario
                           6.5.2.6. Brazil Biotechnology Market, 2018 - 2030 (USD Billion)
                       6.5.3. Mexico
                           6.5.3.1. Key Country Dynamics
                           6.5.3.2. Target Disease Prevalence
                           6.5.3.3. Competitive Scenario
                           6.5.3.4. Regulatory Framework
                           6.5.3.5. Reimbursement Scenario
                           6.5.3.6. Mexico Biotechnology Market, 2018 - 2030 (USD Billion)
                       6.5.4. Argentina
                           6.5.4.1. Key Country Dynamics
                           6.5.4.2. Target Disease Prevalence
                           6.5.4.3. Competitive Scenario
                           6.5.4.4. Regulatory Framework
                           6.5.4.5. Reimbursement Scenario
                           6.5.4.6. Argentina Biotechnology Market, 2018 - 2030 (USD Billion)
                   6.6. MEA
                       6.6.1. MEA Biotechnology Market, 2018 - 2030 (USD Billion)
                       6.6.2. South Africa
                           6.6.2.1. Key Country Dynamics
                           6.6.2.2. Target Disease Prevalence
                           6.6.2.3. Competitive Scenario
                           6.6.2.4. Regulatory Framework
                           6.6.2.5. Reimbursement Scenario
                           6.6.2.6. Reimbursement Scenario
                           6.6.2.7. South Africa Biotechnology Market, 2018 - 2030 (USD Billion)
                       6.6.3. Saudi Arabia
                           6.6.3.1. Key Country Dynamics
                           6.6.3.2. Target Disease Prevalence
                           6.6.3.3. Competitive Scenario
                           6.6.3.4. Regulatory Framework
                           6.6.3.5. Reimbursement Scenario
                           6.6.3.6. Saudi Arabia Biotechnology Market, 2018 - 2030 (USD Billion)
                       6.6.4. UAE
                           6.6.4.1. Key Country Dynamics
                           6.6.4.2. Target Disease Prevalence
                           6.6.4.3. Competitive Scenario
                           6.6.4.4. Regulatory Framework
                           6.6.4.5. Reimbursement Scenario
                           6.6.4.6. UAE Biotechnology Market, 2018 - 2030 (USD Billion)
                       6.6.5. Kuwait
                           6.6.5.1. Key Country Dynamics
                           6.6.5.2. Target Disease Prevalence
                           6.6.5.3. Competitive Scenario
                           6.6.5.4. Regulatory Framework
                           6.6.5.5. Reimbursement Scenario
                           6.6.5.6. Kuwait Biotechnology Market, 2018 - 2030 (USD Billion)
Chapter 7. Competitive Landscape
                   7.1. Company Categorization
                   7.2. Strategy Mapping
                   7.3. Company Market Share Analysis, 2022
                   7.4. Company Profiles/Listing
                       7.4.1. AstraZeneca
                           7.4.1.1. Overview
                           7.4.1.2. Financial Performance (Net Revenue/Sales/EBITDA/Gross Profit)
                           7.4.1.3. Product Benchmarking
                           7.4.1.4. Strategic Initiatives
                       7.4.2. Gilead Sciences, Inc.
                           7.4.2.1. Overview
                           7.4.2.2. Financial Performance (Net Revenue/Sales/EBITDA/Gross Profit)
                           7.4.2.3. Product Benchmarking
                           7.4.2.4. Strategic Initiatives
                       7.4.3. Bristol-Myers Squibb
                           7.4.3.1. Overview
                           7.4.3.2. Financial Performance (Net Revenue/Sales/EBITDA/Gross Profit)
                           7.4.3.3. Product Benchmarking
                           7.4.3.4. Strategic Initiatives
                       7.4.4. Sanofi
                           7.4.4.1. Overview
                           7.4.4.2. Financial Performance (Net Revenue/Sales/EBITDA/Gross Profit)
                           7.4.4.3. Product Benchmarking
                           7.4.4.4. Strategic Initiatives
                       7.4.5. Biogen
                           7.4.5.1. Overview
                           7.4.5.2. Financial Performance (Net Revenue/Sales/EBITDA/Gross Profit)
                           7.4.5.3. Product Benchmarking
                           7.4.5.4. Strategic Initiatives
                       7.4.6. Abbott Laboratories
                           7.4.6.1. Overview
                           7.4.6.2. Financial Performance (Net Revenue/Sales/EBITDA/Gross Profit)
                           7.4.6.3. Product Benchmarking
                           7.4.6.4. Strategic Initiatives
                       7.4.7. Pfizer, Inc.
                           7.4.7.1. Overview
                           7.4.7.2. Financial Performance (Net Revenue/Sales/EBITDA/Gross Profit)
                           7.4.7.3. Product Benchmarking
                           7.4.7.4. Strategic Initiatives
                       7.4.8. Amgen, Inc.
                           7.4.8.1. Overview
                           7.4.8.2. Financial Performance (Net Revenue/Sales/EBITDA/Gross Profit)
                           7.4.8.3. Product Benchmarking
                           7.4.8.4. Strategic Initiatives
                       7.4.9. Novo Nordisk A/S
                           7.4.9.1. Overview
                           7.4.9.2. Financial Performance (Net Revenue/Sales/EBITDA/Gross Profit)
                           7.4.9.3. Product Benchmarking
                           7.4.9.4. Strategic Initiatives
                       7.4.10. Merck KGaA
                           7.4.10.1. Overview
                           7.4.10.2. Financial Performance (Net Revenue/Sales/EBITDA/Gross Profit)
                           7.4.10.3. Product Benchmarking
                           7.4.10.4. Strategic Initiatives
                       7.4.11. Johnson & Johnson Services, Inc.
                           7.4.11.1. Overview
                           7.4.11.2. Financial Performance (Net Revenue/Sales/EBITDA/Gross Profit)
                           7.4.11.3. Product Benchmarking
                           7.4.11.4. Strategic Initiatives
                       7.4.12. Novartis AG
                           7.4.12.1. Overview
                           7.4.12.2. Financial Performance (Net Revenue/Sales/EBITDA/Gross Profit)
                           7.4.12.3. Product Benchmarking
                           7.4.12.4. Strategic Initiatives
                       7.4.13. F. Hoffmann-La Roche Ltd.
                           7.4.13.1. Overview
                           7.4.13.2. Financial Performance (Net Revenue/Sales/EBITDA/Gross Profit)
                           7.4.13.3. Product Benchmarking
                           7.4.13.4. Strategic Initiatives
                       7.4.14. Lonza
                           7.4.14.1. Overview
                           7.4.14.2. Financial Performance (Net Revenue/Sales/EBITDA/Gross Profit)
                           7.4.14.3. Product Benchmarking
                           7.4.14.4. Strategic Initiatives


List of Tables

Table 1 List of abbreviations
Table 2 Global biotechnology market, by technology, 2018 - 2030 (USD Billion)
Table 3 Global biotechnology market, by application, 2018 - 2030 (USD Billion)
Table 4 Global biotechnology market, by region, 2018 - 2030 (USD Billion)
Table 5 North America biotechnology market, by country, 2018 - 2030 (USD Billion)
Table 6 North America biotechnology market, by technology, 2018 - 2030 (USD Billion)
Table 7 North America biotechnology market, by application, 2018 - 2030 (USD Billion)
Table 8 U.S. biotechnology market, by technology, 2018 - 2030 (USD Billion)
Table 9 U.S. biotechnology market, by application, 2018 - 2030 (USD Billion)
Table 10 Canada biotechnology market, by technology, 2018 - 2030 (USD Billion)
Table 11 Canada biotechnology market, by application, 2018 - 2030 (USD Billion)
Table 12 Europe biotechnology market, by country, 2018 - 2030 (USD Billion)
Table 13 Europe biotechnology market, by technology, 2018 - 2030 (USD Billion)
Table 14 Europe biotechnology market, by application, 2018 - 2030 (USD Billion)
Table 15 UK biotechnology market, by technology, 2018 - 2030 (USD Billion)
Table 16 UK biotechnology market, by application, 2018 - 2030 (USD Billion)
Table 17 Germany biotechnology market, by technology, 2018 - 2030 (USD Billion)
Table 18 Germany biotechnology market, by application, 2018 - 2030 (USD Billion)
Table 19 France biotechnology market, by technology, 2018 - 2030 (USD Billion)
Table 20 France biotechnology market, by application, 2018 - 2030 (USD Billion)
Table 21 Italy biotechnology market, by technology, 2018 - 2030 (USD Billion)
Table 22 Italy biotechnology market, by application, 2018 - 2030 (USD Billion)
Table 23 Spain biotechnology market, by technology, 2018 - 2030 (USD Billion)
Table 24 Spain biotechnology market, by application, 2018 - 2030 (USD Billion)
Table 25 Denmark biotechnology market, by technology, 2018 - 2030 (USD Billion)
Table 26 Denmark biotechnology market, by application, 2018 - 2030 (USD Billion)
Table 27 Sweden biotechnology market, by technology, 2018 - 2030 (USD Billion)
Table 28 Sweden biotechnology market, by application, 2018 - 2030 (USD Billion)
Table 29 Norway biotechnology market, by technology, 2018 - 2030 (USD Billion)
Table 30 Norway biotechnology market, by application, 2018 - 2030 (USD Billion)
Table 31 Asia Pacific biotechnology market, by country, 2018 - 2030 (USD Billion)
Table 32 Asia Pacific biotechnology market, by technology, 2018 - 2030 (USD Billion)
Table 33 Asia Pacific biotechnology market, by application, 2018 - 2030 (USD Billion)
Table 34 Japan biotechnology market, by technology, 2018 - 2030 (USD Billion)
Table 35 Japan biotechnology market, by application, 2018 - 2030 (USD Billion)
Table 36 China biotechnology market, by technology, 2018 - 2030 (USD Billion)
Table 37 China biotechnology market, by application, 2018 - 2030 (USD Billion)
Table 38 India biotechnology market, by technology, 2018 - 2030 (USD Billion)
Table 39 India biotechnology market, by application, 2018 - 2030 (USD Billion)
Table 40 Australia biotechnology market, by technology, 2018 - 2030 (USD Billion)
Table 41 Australia biotechnology market, by application, 2018 - 2030 (USD Billion)
Table 42 Thailand biotechnology market, by technology, 2018 - 2030 (USD Billion)
Table 43 Thailand biotechnology market, by application, 2018 - 2030 (USD Billion)
Table 44 South Korea biotechnology market, by technology, 2018 - 2030 (USD Billion)
Table 45 South Korea biotechnology market, by application, 2018 - 2030 (USD Billion)
Table 46 Latin America biotechnology market, by country, 2018 - 2030 (USD Billion)
Table 47 Latin America biotechnology market, by technology, 2018 - 2030 (USD Billion)
Table 48 Latin America biotechnology market, by application, 2018 - 2030 (USD Billion)
Table 49 Brazil biotechnology market, by technology, 2018 - 2030 (USD Billion)
Table 50 Brazil biotechnology market, by application, 2018 - 2030 (USD Billion)
Table 51 Mexico biotechnology market, by technology, 2018 - 2030 (USD Billion)
Table 52 Mexico biotechnology market, by application, 2018 - 2030 (USD Billion)
Table 53 Argentina biotechnology market, by technology, 2018 - 2030 (USD Billion)
Table 54 Argentina biotechnology market, by application, 2018 - 2030 (USD Billion)
Table 55 Middle East & Africa biotechnology market, by country, 2018 - 2030 (USD Billion)
Table 56 Middle East & Africa biotechnology market, by technology, 2018 - 2030 (USD Billion)
Table 57 Middle East & Africa biotechnology market, by application, 2018 - 2030 (USD Billion)
Table 58 South Africa biotechnology market, by technology, 2018 - 2030 (USD Billion)
Table 59 South Africa biotechnology market, by application, 2018 - 2030 (USD Billion)
Table 60 Saudi Arabia biotechnology market, by technology, 2018 - 2030 (USD Billion)
Table 61 Saudi Arabia biotechnology market, by application, 2018 - 2030 (USD Billion)
Table 62 UAE biotechnology market, by technology, 2018 - 2030 (USD Billion)
Table 63 UAE biotechnology market, by application, 2018 - 2030 (USD Billion)
Table 64 Kuwait biotechnology market, by technology, 2018 - 2030 (USD Billion)
Table 65 Kuwait biotechnology market, by application, 2018 - 2030 (USD Billion)


List of Figures

Fig. 1 Market research process
Fig. 2 Information procurement
Fig. 3 Primary research pattern
Fig. 4 Market research approaches
Fig. 5 Value chain-based sizing & forecasting
Fig. 6 Market formulation & validation
Fig. 7 Biotechnology market segmentation
Fig. 8 Market snapshot, 2022
Fig. 9 Market trends & outlook
Fig. 10 Market driver relevance analysis (current & future impact)
Fig. 11 Market restraint relevance analysis (current & future impact)
Fig. 12 PESTEL analysis
Fig. 13 Porter’s five forces analysis
Fig. 14 Global biotechnology market: Technology movement analysis
Fig. 15 Global biotechnology market, for nanobiotechnology, 2018 - 2030 (USD Billion)
Fig. 16 Global biotechnology market, for tissue engineering & regeneration, 2018 - 2030 (USD Billion)
Fig. 17 Global biotechnology market, for DNA sequencing, 2018 - 2030 (USD Billion)
Fig. 18 Global biotechnology market, for cell-based assays, 2018 - 2030 (USD Billion)
Fig. 19 Global biotechnology market, for fermentation, 2018 - 2030 (USD Billion)
Fig. 20 Global biotechnology market, for PCR technology, 2018 - 2030 (USD Billion)
Fig. 21 Global biotechnology market, for chromatography, 2018 - 2030 (USD Billion)
Fig. 22 Global biotechnology market, for other technologies, 2018 - 2030 (USD Billion)
Fig. 23 Global biotechnology market: Application movement analysis
Fig. 24 Global biotechnology market, for health, 2018 - 2030 (USD Billion)
Fig. 25 Global biotechnology market, for food & agriculture, 2018 - 2030 (USD Billion)
Fig. 26 Global biotechnology market, for natural resources & environment, 2018 - 2030 (USD Billion)
Fig. 27 Global biotechnology market, for industrial processing, 2018 - 2030 (USD Billion)
Fig. 28 Global biotechnology market, for bioinformatics, 2018 - 2030 (USD Billion)
Fig. 29 Global biotechnology market, for other applications, 2018 - 2030 (USD Billion)
Fig. 30 Regional marketplace: Key takeaways
Fig. 31 Regional outlook, 2022 & 2030
Fig. 32 Global biotechnology market: Region movement analysis
Fig. 33 North America biotechnology market, 2018 - 2030 (USD Billion)
Fig. 34 U.S. biotechnology market, 2018 - 2030 (USD Billion)
Fig. 35 Canada biotechnology market, 2018 - 2030 (USD Billion)
Fig. 36 Europe biotechnology market, 2018 - 2030 (USD Billion)
Fig. 37 Germany biotechnology market, 2018 - 2030 (USD Billion)
Fig. 38 UK biotechnology market, 2018 - 2030 (USD Billion)
Fig. 39 France biotechnology market, 2018 - 2030 (USD Billion)
Fig. 40 Italy biotechnology market, 2018 - 2030 (USD Billion)
Fig. 41 Spain biotechnology market, 2018 - 2030 (USD Billion)
Fig. 42 Denmark biotechnology market, 2018 - 2030 (USD Billion)
Fig. 43 Sweden biotechnology market, 2018 - 2030 (USD Billion)
Fig. 44 Norway biotechnology market, 2018 - 2030 (USD Billion)
Fig. 45 Asia Pacific biotechnology market, 2018 - 2030 (USD Billion)
Fig. 46 Japan biotechnology market, 2018 - 2030 (USD Billion)
Fig. 47 China biotechnology market, 2018 - 2030 (USD Billion)
Fig. 48 India biotechnology market, 2018 - 2030 (USD Billion)
Fig. 49 Australia biotechnology market, 2018 - 2030 (USD Billion)
Fig. 50 Thailand biotechnology market, 2018 - 2030 (USD Billion)
Fig. 51 South Korea biotechnology market, 2018 - 2030 (USD Billion)
Fig. 52 Latin America biotechnology market, 2018 - 2030 (USD Billion)
Fig. 53 Brazil biotechnology market, 2018 - 2030 (USD Billion)
Fig. 54 Mexico biotechnology market, 2018 - 2030 (USD Billion)
Fig. 55 Argentina biotechnology market, 2018 - 2030 (USD Billion)
Fig. 56 Middle East and Africa biotechnology market, 2018 - 2030 (USD Billion)
Fig. 57 South Africa biotechnology market, 2018 - 2030 (USD Billion)
Fig. 58 Saudi Arabia biotechnology market, 2018 - 2030 (USD Billion)
Fig. 59 UAE biotechnology market, 2018 - 2030 (USD Billion)
Fig. 60 Kuwait biotechnology market, 2018 - 2030 (USD Billion)

What questions do you have? Get quick response from our industry experts. Request a Free Consultation

Market Segmentation

  • Global Biotechnology: Technology Outlook (Revenue, USD Billion, 2018 - 2030)
    • Nanobiotechnology
    • Tissue Engineering & Regeneration
    • DNA Sequencing
    • Cell-based Assays
    • Fermentation
    • PCR Technology
    • Chromatography
    • Others
  • Global Biotechnology: Application Outlook (Revenue, USD Billion, 2018 - 2030)
    • Health
    • Food & Agriculture
    • Natural Resources & Environment
    • Industrial Processing
    • Bioinformatics
    • Others
  • Biotechnology: Regional Outlook (Revenue, USD Billion, 2018 - 2030)
    • North America
      • North America Biotechnology Market, By Technology 2018 - 2030 (USD Billion)
        • Nanobiotechnology
        • Tissue Engineering & Regeneration
        • DNA Sequencing
        • Cell-based Assays
        • Fermentation
        • PCR Technology
        • Chromatography
        • Others
      • North America Biotechnology Market, By Application 2018 - 2030 (USD Billion)
        • Health
        • Food & Agriculture
        • Natural Resources & Environment
        • Industrial Processing
        • Bioinformatics
        • Others
      • U.S.
        • U.S. Biotechnology Market, By Technology 2018 - 2030 (USD Billion)
          • Nanobiotechnology
          • Tissue Engineering & Regeneration
          • DNA Sequencing
          • Cell-based Assays
          • Fermentation
          • PCR Technology
          • Chromatography
          • Others
        • U.S. Biotechnology Market, By Application 2018 - 2030 (USD Billion)
          • Health
          • Food & Agriculture
          • Natural Resources & Environment
          • Industrial Processing
          • Bioinformatics
          • Others
      • Canada
        • Canada Biotechnology Market, By Technology 2018 - 2030 (USD Billion)
          • Nanobiotechnology
          • Tissue Engineering & Regeneration
          • DNA Sequencing
          • Cell-based Assays
          • Fermentation
          • PCR Technology
          • Chromatography
          • Others
        • Canada Biotechnology Market, By Application 2018 - 2030 (USD Billion)
          • Health
          • Food & Agriculture
          • Natural Resources & Environment
          • Industrial Processing
          • Bioinformatics
          • Others
    • Europe
      • Europe Biotechnology Market, By Technology 2018 - 2030 (USD Billion)
        • Nanobiotechnology
        • Tissue Engineering & Regeneration
        • DNA Sequencing
        • Cell-based Assays
        • Fermentation
        • PCR Technology
        • Chromatography
        • Others
      • Europe Biotechnology Market, By Application 2018 - 2030 (USD Billion)
        • Health
        • Food & Agriculture
        • Natural Resources & Environment
        • Industrial Processing
        • Bioinformatics
        • Others
      • Germany
        • Germany Biotechnology Market, By Technology 2018 - 2030 (USD Billion)
          • Nanobiotechnology
          • Tissue Engineering & Regeneration
          • DNA Sequencing
          • Cell-based Assays
          • Fermentation
          • PCR Technology
          • Chromatography
          • Others
        • Germany Biotechnology Market, By Application 2018 - 2030 (USD Billion)
          • Health
          • Food & Agriculture
          • Natural Resources & Environment
          • Industrial Processing
          • Bioinformatics
          • Others
      • UK
        • UK Biotechnology Market, By Technology 2018 - 2030 (USD Billion)
          • Nanobiotechnology
          • Tissue Engineering & Regeneration
          • DNA Sequencing
          • Cell-based Assays
          • Fermentation
          • PCR Technology
          • Chromatography
          • Others
        • UK Biotechnology Market, By Application 2018 - 2030 (USD Billion)
          • Health
          • Food & Agriculture
          • Natural Resources & Environment
          • Industrial Processing
          • Bioinformatics
          • Others
      • France
        • France Biotechnology Market, By Technology 2018 - 2030 (USD Billion)
          • Nanobiotechnology
          • Tissue Engineering & Regeneration
          • DNA Sequencing
          • Cell-based Assays
          • Fermentation
          • PCR Technology
          • Chromatography
          • Others
        • France Biotechnology Market, By Application 2018 - 2030 (USD Billion)
          • Health
          • Food & Agriculture
          • Natural Resources & Environment
          • Industrial Processing
          • Bioinformatics
          • Others
      • Italy
        • Italy Biotechnology Market, By Technology 2018 - 2030 (USD Billion)
          • Nanobiotechnology
          • Tissue Engineering & Regeneration
          • DNA Sequencing
          • Cell-based Assays
          • Fermentation
          • PCR Technology
          • Chromatography
          • Others
        • Italy Biotechnology Market, By Application 2018 - 2030 (USD Billion)
          • Health
          • Food & Agriculture
          • Natural Resources & Environment
          • Industrial Processing
          • Bioinformatics
          • Others
      • Spain
        • Spain Biotechnology Market, By Technology 2018 - 2030 (USD Billion)
          • Nanobiotechnology
          • Tissue Engineering & Regeneration
          • DNA Sequencing
          • Cell-based Assays
          • Fermentation
          • PCR Technology
          • Chromatography
          • Others
        • Spain Biotechnology Market, By Application 2018 - 2030 (USD Billion)
          • Health
          • Food & Agriculture
          • Natural Resources & Environment
          • Industrial Processing
          • Bioinformatics
          • Others
      • Denmark
        • Denmark Biotechnology Market, By Technology 2018 - 2030 (USD Billion)
          • Nanobiotechnology
          • Tissue Engineering & Regeneration
          • DNA Sequencing
          • Cell-based Assays
          • Fermentation
          • PCR Technology
          • Chromatography
          • Others
        • Denmark Biotechnology Market, By Application 2018 - 2030 (USD Billion)
          • Health
          • Food & Agriculture
          • Natural Resources & Environment
          • Industrial Processing
          • Bioinformatics
          • Others
      • Sweden
        • Sweden Biotechnology Market, By Technology 2018 - 2030 (USD Billion)
          • Nanobiotechnology
          • Tissue Engineering & Regeneration
          • DNA Sequencing
          • Cell-based Assays
          • Fermentation
          • PCR Technology
          • Chromatography
          • Others
        • Sweden Biotechnology Market, By Application 2018 - 2030 (USD Billion)
          • Health
          • Food & Agriculture
          • Natural Resources & Environment
          • Industrial Processing
          • Bioinformatics
          • Others
      • Norway
        • Norway Biotechnology Market, By Technology 2018 - 2030 (USD Billion)
          • Nanobiotechnology
          • Tissue Engineering & Regeneration
          • DNA Sequencing
          • Cell-based Assays
          • Fermentation
          • PCR Technology
          • Chromatography
          • Others
        • Norway Biotechnology Market, By Application 2018 - 2030 (USD Billion)
          • Health
          • Food & Agriculture
          • Natural Resources & Environment
          • Industrial Processing
          • Bioinformatics
          • Others
    • Asia Pacific
      • Asia Pacific Biotechnology Market, By Technology 2018 - 2030 (USD Billion)
        • Nanobiotechnology
        • Tissue Engineering & Regeneration
        • DNA Sequencing
        • Cell-based Assays
        • Fermentation
        • PCR Technology
        • Chromatography
        • Others
      • Asia Pacific Biotechnology Market, By Application 2018 - 2030 (USD Billion)
        • Health
        • Food & Agriculture
        • Natural Resources & Environment
        • Industrial Processing
        • Bioinformatics
        • Others
      • Japan
        • Japan Biotechnology Market, By Technology 2018 - 2030 (USD Billion)
          • Nanobiotechnology
          • Tissue Engineering & Regeneration
          • DNA Sequencing
          • Cell-based Assays
          • Fermentation
          • PCR Technology
          • Chromatography
          • Others
        • Japan Biotechnology Market, By Application 2018 - 2030 (USD Billion)
          • Health
          • Food & Agriculture
          • Natural Resources & Environment
          • Industrial Processing
          • Bioinformatics
          • Others
      • China
        • China Biotechnology Market, By Technology 2018 - 2030 (USD Billion)
          • Nanobiotechnology
          • Tissue Engineering & Regeneration
          • DNA Sequencing
          • Cell-based Assays
          • Fermentation
          • PCR Technology
          • Chromatography
          • Others
        • China Biotechnology Market, By Application 2018 - 2030 (USD Billion)
          • Health
          • Food & Agriculture
          • Natural Resources & Environment
          • Industrial Processing
          • Bioinformatics
          • Others
      • India
        • India Biotechnology Market, By Technology 2018 - 2030 (USD Billion)
          • Nanobiotechnology
          • Tissue Engineering & Regeneration
          • DNA Sequencing
          • Cell-based Assays
          • Fermentation
          • PCR Technology
          • Chromatography
          • Others
        • India Biotechnology Market, By Application 2018 - 2030 (USD Billion)
          • Health
          • Food & Agriculture
          • Natural Resources & Environment
          • Industrial Processing
          • Bioinformatics
          • Others
      • South Korea
        • South Korea Biotechnology Market, By Technology 2018 - 2030 (USD Billion)
          • Nanobiotechnology
          • Tissue Engineering & Regeneration
          • DNA Sequencing
          • Cell-based Assays
          • Fermentation
          • PCR Technology
          • Chromatography
          • Others
        • South Korea Biotechnology Market, By Application 2018 - 2030 (USD Billion)
          • Health
          • Food & Agriculture
          • Natural Resources & Environment
          • Industrial Processing
          • Bioinformatics
          • Others
      • Thailand
        • Thailand Biotechnology Market, By Technology 2018 - 2030 (USD Billion)
          • Nanobiotechnology
          • Tissue Engineering & Regeneration
          • DNA Sequencing
          • Cell-based Assays
          • Fermentation
          • PCR Technology
          • Chromatography
          • Others
        • Thailand Biotechnology Market, By Application 2018 - 2030 (USD Billion)
          • Health
          • Food & Agriculture
          • Natural Resources & Environment
          • Industrial Processing
          • Bioinformatics
          • Others
      • Australia
        • Australia Biotechnology Market, By Technology 2018 - 2030 (USD Billion)
          • Nanobiotechnology
          • Tissue Engineering & Regeneration
          • DNA Sequencing
          • Cell-based Assays
          • Fermentation
          • PCR Technology
          • Chromatography
          • Others
        • Australia Biotechnology Market, By Application 2018 - 2030 (USD Billion)
          • Health
          • Food & Agriculture
          • Natural Resources & Environment
          • Industrial Processing
          • Bioinformatics
          • Others
    • Latin America
      • Latin America Biotechnology Market, By Technology 2018 - 2030 (USD Billion)
        • Nanobiotechnology
        • Tissue Engineering & Regeneration
        • DNA Sequencing
        • Cell-based Assays
        • Fermentation
        • PCR Technology
        • Chromatography
        • Others
      • Latin America Biotechnology Market, By Application 2018 - 2030 (USD Billion)
        • Health
        • Food & Agriculture
        • Natural Resources & Environment
        • Industrial Processing
        • Bioinformatics
        • Others
      • Brazil
        • Brazil Biotechnology Market, By Technology 2018 - 2030 (USD Billion)
          • Nanobiotechnology
          • Tissue Engineering & Regeneration
          • DNA Sequencing
          • Cell-based Assays
          • Fermentation
          • PCR Technology
          • Chromatography
          • Others
        • Brazil Biotechnology Market, By Application 2018 - 2030 (USD Billion)
          • Health
          • Food & Agriculture
          • Natural Resources & Environment
          • Industrial Processing
          • Bioinformatics
          • Others
      • Mexico
        • Mexico Biotechnology Market, By Technology 2018 - 2030 (USD Billion)
          • Nanobiotechnology
          • Tissue Engineering & Regeneration
          • DNA Sequencing
          • Cell-based Assays
          • Fermentation
          • PCR Technology
          • Chromatography
          • Others
        • Mexico Biotechnology Market, By Application 2018 - 2030 (USD Billion)
          • Health
          • Food & Agriculture
          • Natural Resources & Environment
          • Industrial Processing
          • Bioinformatics
          • Others
      • Argentina
        • Argentina Biotechnology Market, By Technology 2018 - 2030 (USD Billion)
          • Nanobiotechnology
          • Tissue Engineering & Regeneration
          • DNA Sequencing
          • Cell-based Assays
          • Fermentation
          • PCR Technology
          • Chromatography
          • Others
        • Argentina Biotechnology Market, By Application 2018 - 2030 (USD Billion)
          • Health
          • Food & Agriculture
          • Natural Resources & Environment
          • Industrial Processing
          • Bioinformatics
          • Others
    • Middle East & Africa
      • Middle East & Africa Biotechnology Market, By Technology 2018 - 2030 (USD Billion)
        • Nanobiotechnology
        • Tissue Engineering & Regeneration
        • DNA Sequencing
        • Cell-based Assays
        • Fermentation
        • PCR Technology
        • Chromatography
        • Others
      • Middle East & Africa Biotechnology Market, By Application 2018 - 2030 (USD Billion)
        • Health
        • Food & Agriculture
        • Natural Resources & Environment
        • Industrial Processing
        • Bioinformatics
        • Others
      • South Africa
        • South Africa Biotechnology Market, By Technology 2018 - 2030 (USD Billion)
          • Nanobiotechnology
          • Tissue Engineering & Regeneration
          • DNA Sequencing
          • Cell-based Assays
          • Fermentation
          • PCR Technology
          • Chromatography
          • Others
        • South Africa Biotechnology Market, By Application 2018 - 2030 (USD Billion)
          • Health
          • Food & Agriculture
          • Natural Resources & Environment
          • Industrial Processing
          • Bioinformatics
          • Others
      • Saudi Arabia
        • Saudi Arabia Biotechnology Market, By Technology 2018 - 2030 (USD Billion)
          • Nanobiotechnology
          • Tissue Engineering & Regeneration
          • DNA Sequencing
          • Cell-based Assays
          • Fermentation
          • PCR Technology
          • Chromatography
          • Others
        • Saudi Arabia Biotechnology Market, By Application 2018 - 2030 (USD Billion)
          • Health
          • Food & Agriculture
          • Natural Resources & Environment
          • Industrial Processing
          • Bioinformatics
          • Others
      • UAE
        • UAE Biotechnology Market, By Technology 2018 - 2030 (USD Billion)
          • Nanobiotechnology
          • Tissue Engineering & Regeneration
          • DNA Sequencing
          • Cell-based Assays
          • Fermentation
          • PCR Technology
          • Chromatography
          • Others
        • UAE Biotechnology Market, By Application 2018 - 2030 (USD Billion)
          • Health
          • Food & Agriculture
          • Natural Resources & Environment
          • Industrial Processing
          • Bioinformatics
          • Others
      • Kuwait
        • Kuwait Biotechnology Market, By Technology 2018 - 2030 (USD Billion)
          • Nanobiotechnology
          • Tissue Engineering & Regeneration
          • DNA Sequencing
          • Cell-based Assays
          • Fermentation
          • PCR Technology
          • Chromatography
          • Others
        • Kuwait Biotechnology Market, By Application 2018 - 2030 (USD Billion)
          • Health
          • Food & Agriculture
          • Natural Resources & Environment
          • Industrial Processing
          • Bioinformatics
          • Others

Biotechnology Market Dynamics

Driver: Presence of Favorable Government Initiatives

The biotechnology sector with its high growth potential in the fields of life sciences, information technology, and agriculture is anticipated to play a major role as a novel manufacturing hub. Biotechnology is one of the most significant sectors contributing to the growth of the economy and enhancing the global profile. The sector is innovative and is on a high growth trajectory. Governments of several countries have undertaken several initiatives to advance the biotechnology sector and offer enough scope for research in this field. The presence of organizations, such as the National Biotechnology Board (NBTB) and The Department of Biotechnology (DBT), enhances funding to support product development and R&D. Rising necessity to understand chronic diseases at a molecular level and develop therapeutic solutions is projected to encourage these organizations to fund R&D programs. An increase in government funding for life sciences research is expected to drive the market in the coming years. Organizations, such as The National Human Genome Research Institute (NHGRI) and National Institutes of Health (NIH) are actively funding several life sciences projects.

Driver: Rising Demand for Agro-based Products

Increasing demand for agricultural and food products, such as wheat, rice, sugarcane, and beans, owing to the growing population in countries, such as the U.S., China, and India, is expected to increase the importance of biotechnology-based products. Various factors such as pest attacks, limited availability of agricultural land, low yield of crops, and shortage of water are encouraging scientists to develop advanced agricultural technologies via extensive R&D. Application of biotechnological processes, such as Genetic Modification (GM) and genetic engineering, in agricultural products is expected to drive the market growth during the forecast period. Furthermore, this has resulted in a significant increase in the growth of the biotech seed market. GM seeds have a higher economic value than conventional seeds due to their higher yield and resistance to pests and diseases. With these added benefits, a growing number of farmers around the world have recognized the value of these crops. As a result, the area under cultivation for biotech crops has exponentially increased.

Restraint: Ethical & Legal Limitations

Regulatory barriers for clinical applications in regenerative medicine, tissue engineering, and stem cells may hinder market growth. Stem cell-based therapies are differently regulated in all the countries around the world. Gaining approval for stem cell-based therapies from regulatory authorities is one of the most significant challenges faced by market players. For instance, stringent norms are required to be followed to conduct research pertaining to embryonic stem cells and introduce changes in gene regulation in humans. Stem cell-derived regenerative therapies are reported to have been used at a rapid rate in veterinary medicines because of less stringent regulations. For instance, equine articular cartilage restoration and chondrogenesis reflected improved clinical symptoms using adult stem cell therapies. The introduction of regenerative medicine into clinical practice demands a specifically designed regulatory framework. In the U.S., Europe, Japan, and China, there are well-designed regulatory policies related to the application and R&D of regenerative medicines.

What Does This Report Include?

This section will provide insights into the contents included in this biotechnology market report and help gain clarity on the structure of the report to assist readers in navigating smoothly.

Biotechnology market qualitative analysis

  • Industry overview

  • Industry trends

  • Market drivers and restraints

  • Market size

  • Growth prospects

  • Porter’s analysis

  • PESTEL analysis

  • Key market opportunities prioritized

  • Competitive landscape

    • Company overview

    • Financial performance

    • Product benchmarking

    • Latest strategic developments

Biotechnology market quantitative analysis

  • Market size, estimates, and forecast from 2018 to 2030

  • Market estimates and forecast for product segments up to 2030

  • Regional market size and forecast for product segments up to 2030

  • Market estimates and forecast for application segments up to 2030

  • Regional market size and forecast for application segments up to 2030

  • Company financial performance

What questions do you have? Get quick response from our industry experts. Request a Free Consultation

Research Methodology

A three-pronged approach was followed for deducing the biotechnology market estimates and forecasts. The process has three steps: information procurement, analysis, and validation. The whole process is cyclical, and steps repeat until the estimates are validated. The three steps are explained in detail below:

Information procurement: Information procurement is one of the most extensive and important stages in our research process, and quality data is critical for accurate analysis. We followed a multi-channel data collection process for biotechnology market to gather the most reliable and current information possible.

  • We buy access to paid databases such as Hoover’s and Factiva for company financials, industry information, white papers, industry journals, SME journals, and more.
  • We tap into Grand View’s proprietary database of data points and insights from active and archived monitoring and reporting.
  • We conduct primary research with industry experts through questionnaires and one-on-one phone interviews.
  • We pull from reliable secondary sources such as white papers and government statistics, published by organizations like WHO, NGOs, World Bank, etc., Key Opinion Leaders (KoL) publications, company filings, investor documents, and more.
  • We purchase and review investor analyst reports, broker reports, academic commentary, government quotes, and wealth management publications for insightful third-party perspectives.

Analysis: We mine the data collected to establish baselines for forecasting, identify trends and opportunities, gain insight into consumer demographics and drivers, and so much more. We utilized different methods of biotechnology market data depending on the type of information we’re trying to uncover in our research.

  • Market Research Efforts: Bottom-up Approach for estimating and forecasting demand size and opportunity, top-down Approach for new product forecasting and penetration, and combined approach of both Bottom-up and Top-down for full coverage analysis.

  • Value-Chain-Based Sizing & Forecasting: Supply-side estimates for understanding potential revenue through competitive benchmarking, forecasting, and penetration modeling.

  • Demand-side estimates for identifying parent and ancillary markets, segment modeling, and heuristic forecasting.

  • Qualitative Functional Deployment (QFD) Modelling for market share assessment.

Market formulation and validation: We mine the data collected to establish baselines for forecasting, identify trends and opportunities, gain insight into consumer demographics and drivers, and so much more. We utilize different methods of data analysis depending on the type of information we’re trying to uncover in our research.

  • Market Formulation: This step involves the finalization of market numbers. This step on an internal level is designed to manage outputs from the Data Analysis step.

  • Data Normalization: The final market estimates and forecasts are then aligned and sent to industry experts, in-panel quality control managers for validation.

  • This step also entails the finalization of the report scope and data representation pattern.

  • Validation: The process entails multiple levels of validation. All these steps run in parallel, and the study is forwarded for publishing only if all three levels render validated results.

Biotechnology Market Categorization:

The biotechnology market was categorized into three segments, namely technology (Nanobiotechnology, Tissue Engineering and Regeneration, DNA Sequencing, Cell-based Assays, Fermentation, PCR Technology, Chromatography), application (Health, Food & Agriculture, Natural Resources & Environment, Industrial Processing, Bioinformatics), and region (North America, Europe, Asia Pacific, Latin America, Middle East & Africa).

Segment Market Methodology:

The biotechnology market was segmented into technology, application, and regions. The demand at a segment level was deduced using a funnel method. Concepts like the TAM, SAM, SOM, etc., were put into practice to understand the demand. We at GVR deploy three methods to deduce market estimates and determine forecasts. These methods are explained below:

Market research approaches: Bottom-up

  • Demand estimation of each product across countries/regions summed up to from the total market.

  • Variable analysis for demand forecast.

  • Demand estimation via analyzing paid database, and company financials either via annual reports or paid database.

  • Primary interviews for data revalidation and insight collection.

Market research approaches: Top-down

  • Used extensively for new product forecasting or analyzing penetration levels.

  • Tool used invoice product flow and penetration models Use of regression multi-variant analysis for forecasting Involves extensive use of paid and public databases.

  • Primary interviews and vendor-based primary research for variable impact analysis.

Market research approaches: Combined

  • This is the most common method. We apply concepts from both the top-down and bottom-up approaches to arrive at a viable conclusion.

Regional Market Methodology:

The biotechnology market was analyzed at a regional level. The global was divided into North America, Europe, Asia Pacific, Latin America, and Middle East & Africa, keeping in focus variables like consumption patterns, export-import regulations, consumer expectations, etc. These regions were further divided into twenty-three countries, namely, the U.S.; Canada; Germany; the UK; France; Italy; Spain; Denmark; Sweden; Norway; Japan; China; India; South Korea; Thailand; Australia; Brazil; Mexico; Argentina; South Africa; Saudi Arabia; UAE; Kuwait.

All three above-mentioned market research methodologies were applied to arrive at regional-level conclusions. The regions were then summed up to form the global market.

Biotechnology market companies & financials:

The biotechnology market was analyzed via companies operating in the sector. Analyzing these companies and cross-referencing them to the demand equation helped us validate our assumptions and conclusions. Key market players analyzed include:

  • AstraZeneca PLC, Headquartered in Cambridge, UK, and established in 1999, AstraZeneca PLC is a publicly owned pharmaceutical company that is involved in the manufacturing and marketing of primary care and specialty care medicines. The company focuses on cardiovascular & metabolic diseases, respiratory, neuroscience, infection & vaccines, oncology, and inflammation & autoimmunity. The company has entered collaboration and partnerships with various organizations to develop regenerative therapies. Some of its partners are FibroGen, Mitsubishi Tanabe Pharma Cooperation, Karolinska Institute, Harvard Stem Cell Institute, Ionis, Max Planck Institute of Molecular Physiology, Moderna, NGM Biopharmaceuticals, and Regulus Therapeutics. The company is globally present with its research centers in the U.S., Sweden, China, and Japan. In 2007, AstraZeneca acquired MedImmune, a global biologic developing company. The company has an employee strength of 83,100 (As of December 2021.

  • Gilead Sciences Inc., Headquartered in Foster City, CA, U.S. and established in 1987, Gilead is a research-based biopharmaceutical organization that is involved in discovering, developing, and commercializing innovative medicines for the treatment of different conditions, such as liver diseases, inflammation, cancer, cardiovascular conditions, respiratory disorders, and HIV/AIDS. The company was incorporated in 1987 and is headquartered in California. The company is involved in collaborations for science, academic, and business purposes. Gilead Sciences is present in over 20 countries across the globe, with a dedicated workforce of over 14,400 employees.

  • Bristol-Myers Squibb, Bristol-Myers Squibb is a biopharmaceutical company, which has delivered innovative medicines to aid patients in prevailing over serious diseases. Many of the drugs that were developed helped millions of patients fight against life-threatening diseases, such as cancer, cardiovascular disease, hepatitis B, and HIV. The company was established in 1887 and headquartered in New York, U.S. The total number of employees working in the company as of December 2021 was 32,200. In the past 10 years, Bristol Myers has delivered around 15 new drug molecules of which four are biologics.

  • Biogen, Headquartered in Cambridge, MA, U.S., and established in 1978, Biogen is a global biopharmaceutical company that is involved in the development, manufacturing, and marketing of therapies. It provides products to support the treatment of hematological conditions, neurodegenerative diseases, and autoimmune disorders. The prime focus of the company is on therapies for multiple sclerosis and spinal muscular atrophy. The company is involved in strategic collaboration with Genentech, a wholly owned subsidiary of Roche Group, for the development of therapies. The company aims to expand its market through the development of treatments for rare, genetic disorders through gene therapy and RNA medicines. As of December 31, 2021, the company had approximately 9,610 employees worldwide.

  • Abbott Laboratories, Abbott Laboratories was incorporated in 1900 and is involved in the discovery, development, manufacturing, and marketing of a wide range of healthcare products. The company headquartered in Illinois, U.S. operates its business through four reportable segments: diagnostic products, established pharmaceutical products, nutritional products, and medical devices. The diagnostic products segment includes various diagnostic systems and tests. The company markets and sells products directly to hospitals, clinics, physicians’ offices, commercial laboratories, blood banks, government agencies, and therapeutic companies through its distribution centers, public warehouses, & third-party distributors. The company has a workforce of 113,000 as of December 2021.

  • Amgen Inc., Amgen Inc. is a biotechnology company engaged in the discovery, development, manufacturing, and marketing of ground-breaking human therapeutics to treat patients suffering from serious illnesses. The company was established in 1980 and headquartered in California, United States. The total number of employees working in the company as of December 2021 was 80,000. The company develops innovative medicines in 6 focused therapeutic areas, including, oncology/hematology, inflammation, cardiovascular disease, bone health, nephrology, and neuroscience. Amgen develops its products by using innovative human genetics to unravel the complications of the disease and recognize the details of human biology. Amgen sells products mainly to pharmaceutical wholesale distributors in the U.S. Outside the U.S. the company sells principally to healthcare providers and/or pharmaceutical wholesale distributors depending on the distribution practice in each country. In the Asia Pacific region, the company also sells products in partnership with other companies, including BeiGene, Daiichi Sankyo, KKC, and Takeda. In addition, the company also markets certain products through direct-to-consumer channels, comprising online media, print, and television.

  • Novo Nordisk A/S, Novo Nordisk A/S is involved in the development, discovery, manufacturing, and marketing of pharmaceutical goods. The company operates via two business segments: diabetes care and biopharmaceuticals. The company's diabetes care business segment includes insulin, GLP-1, and other protein-related products, such as oral anti-diabetic drugs, protein-related delivery systems & needles, and glucagon. The biopharmaceuticals segment deals with products in the areas of hemophilia, hormonal therapy, and inflammation. Novo Nordisk sells its products primarily in Algeria, North America, Japan, India, Argentina, Australia, Brazil, China, Turkey, and other European nations through its distributors, subsidiaries, and other agents. Novo Nordisk A/S was established in the year 1923 and has its headquarters in Denmark. Its shares are registered on NASDAQ OMX Copenhagen and ADRs are listed on the NYSE. Novo Nordisk has a workforce of around 48,478 employees in almost 75 countries and markets its products in over 180 countries. It is a member of the European Federation of Pharmaceutical Industries and Associations (EFPIA).

  • Merck KGaA, Founded in 1668 and headquartered in Darmstadt, Germany, Merck KGaA is a multinational pharmaceutical, life sciences, and chemical company. Involved in offering healthcare solutions and materials. It operates through three business segments: healthcare, life sciences, and performance materials. It has worldwide operations in North America, Europe, Asia, Latin America, Oceania, and Africa. This company offers products for biopharma, consumer health, biosimilars, life science, and performance materials. As of December 2021, the company had an employee strength of 60,348. In November 2015, Merck announced the acquisition of Sigma-Aldrich Co. LLC, which began operating as a subsidiary of Merck KGaA.

  • Johnson & Johnson, Johnson & Johnson is a global healthcare company that is engaged in the research, development, manufacture, and commercialization of a wide range of healthcare products. The company was incorporated in 1887 and is headquartered in New Jersey, U.S. It is a holding company with several operating companies that are operational in almost all countries globally. The company has three business units, namely Pharmaceuticals, Consumer, and Medical Devices. The company enhances access & affordability, establishes healthy communities, and provides healthcare products within the reach of everyone. The company has an employee strength of 141,700 (As of December 2021.

  • Novartis AG, Headquartered in Basel, Switzerland, and established in 1996, Novartis AG is a publicly owned company, which was formed due to a merger between Ciba-Geigy and Sandoz Laboratories. It operates in three divisions—pharmaceuticals, Alcon, and Sandoz. Its pharmaceuticals (innovative medicines) business unit is divided into Novartis Pharmaceuticals and Novartis Oncology. It is engaged in offering generics, medicines, and eye care devices. Its R&D facilities include Friedrich Miescher Institute for Biomedical Research (Basel), The Genomics Institute of the Novartis Research Foundation (California), Novartis Institutes for BioMedical Research (Basel, Massachusetts, New Jersey, California, Shanghai), Novartis Institute for Tropical Diseases (Singapore), Pharmaceutical Development—East Hanover (New Jersey), and Pharmaceutical Development (Basel, Cambridge, Changshu, Hyderabad, Shanghai, Tokyo). The company has an employee strength of 110,000 (As of December 2021).

Value chain-based sizing & forecasting

Supply Side Estimates

  • Company revenue estimation via referring to annual reports, investor presentations, and Hoover’s.

  • Segment revenue determination via variable analysis and penetration modeling.

  • Competitive benchmarking to identify market leaders and their collective revenue shares.

  • Forecasting via analyzing commercialization rates, pipelines, market initiatives, distribution networks, etc.

Demand side estimates

  • Identifying parent markets and ancillary markets

  • Segment penetration analysis to obtain pertinent

  • revenue/volume

  • Heuristic forecasting with the help of subject matter experts

  • Forecasting via variable analysis

Biotechnology Market Report Objectives:

  • Understanding market dynamics (in terms of drivers, restraints, & opportunities) in the countries.

  • Understanding trends & variables in the individual countries & their impact on growth and using analytical tools to provide high-level insights into the market dynamics and the associated growth pattern.

  • Understanding market estimates and forecasts (with the base year as 2023, historic information from 2018 to 2023, and forecast from 2024 to 2030). Regional estimates & forecasts for each category are available and are summed up to form the global market estimates.

Biotechnology Market Report Assumptions:

  • The report provides market value for the base year 2023 and a yearly forecast till 2030 in terms of revenue/volume or both. The market for each of the segment outlooks has been provided on region & country basis for the above-mentioned forecast period.

  • The key industry dynamics, major technological trends, and application markets are evaluated to understand their impact on the demand for the forecast period. The growth rates were estimated using correlation, regression, and time-series analysis.

  • We have used the bottom-up approach for market sizing, analyzing key regional markets, dynamics, & trends for various products and end-users. The total market has been estimated by integrating the country markets.

  • All market estimates and forecasts have been validated through primary interviews with the key industry participants.

  • Inflation has not been accounted for to estimate and forecast the market.

  • Numbers may not add up due to rounding off.

  • Europe consists of EU-8, Central & Eastern Europe, along with the Commonwealth of Independent States (CIS).

  • Asia Pacific includes South Asia, East Asia, Southeast Asia, and Oceania (Australia & New Zealand).

  • Latin America includes Central American countries and the South American continent

  • Middle East includes Western Asia (as assigned by the UN Statistics Division) and the African continent.

Primary Research

GVR strives to procure the latest and unique information for reports directly from industry experts, which gives it a competitive edge. Quality is of utmost importance to us, therefore every year we focus on increasing our experts’ panel. Primary interviews are one of the critical steps in identifying recent market trends and scenarios. This process enables us to justify and validate our market estimates and forecasts to our clients. With more than 8,000 reports in our database, we have connected with some key opinion leaders across various domains, including healthcare, technology, consumer goods, and the chemical sector. Our process starts with identifying the right platform for a particular type of report, i.e., emails, LinkedIn, seminars, or telephonic conversation, as every report is unique and requires a differentiated approach.

We send out questionnaires to different experts from various regions/ countries, which is dependent on the following factors:

  • Report/Market scope: If the market study is global, we send questionnaires to industry experts across various regions, including North America, Europe, Asia Pacific, Latin America, and MEA.

  • Market Penetration: If the market is driven by technological advancements, population density, disease prevalence, or other factors, we identify experts and send out questionnaires based on region or country dominance.

The time to start receiving responses from industry experts varies based on how niche or well-penetrated the market is. Our reports include a detailed chapter on the KoL opinion section, which helps our clients understand the perspective of experts already in the market space.

What questions do you have? Get quick response from our industry experts. Request a Free Consultation
gvr icn

GET A FREE SAMPLE

gvr icn

This FREE sample includes data points, ranging from trend analyses to estimates and forecasts. See for yourself.

gvr icn

NEED A CUSTOM REPORT?

We can customize every report - free of charge - including purchasing stand-alone sections or country-level reports, as well as offer affordable discounts for start-ups & universities. Contact us now

Certified Icon

We are GDPR and CCPA compliant! Your transaction & personal information is safe and secure. For more details, please read our privacy policy.