- Home
- »
- Medical Devices
- »
-
Clear Aligners Market Size & Share, Industry Report, 2033GVR Report cover
![Clear Aligners Market Size, Share & Trends Report]()
Clear Aligners Market (2026 - 2033) Size, Share & Trends Analysis Report By Age (Adults, Teens), By End Use (Hospitals, Standalone Practices), By Material (Polyurethane), By Distribution Channel (Offline, Online), By Region, And segment Forecasts
- Report ID: GVR-4-68038-960-9
- Number of Report Pages: 120
- Format: PDF
- Historical Range: 2021 - 2025
- Forecast Period: 2026 - 2033
- Industry: Healthcare
- Report Summary
- Table of Contents
- Interactive Charts
- Methodology
- Download FREE Sample
-
Download Sample Report
Clear Aligners Market Summary
The global clear aligners market size was estimated at USD 8.29 billion in 2025 and is projected to reach USD 56.81 billion by 2033, growing at a CAGR of 26.95% from 2026 to 2033. The growing shift toward adult orthodontic treatment is emerging as a key demand driver for clear aligners.
Key Market Trends & Insights
- North America dominated the clear aligners market with the largest share of 54.57% in 2025.
- The clear aligners market in the U.S. accounted for the largest market revenue share of 85.38% in North America in 2025.
- By age, adults segment led the market with the largest revenue share of 58.38%in 2025.
- By material, the polyurethane segment led the market with the largest revenue share of 76.26% in 2025.
- Based on distribution channel, the offline segment led the market with the largest revenue share of 73.67% in 2025.
Market Size & Forecast
- 2025 Market Size: USD 8.29 Billion
- 2033 Projected Market Size: USD 56.81 Billion
- CAGR (2026-2033): 26.95%
- North America: Largest market in 2025
- Asia Pacific: Fastest growing market
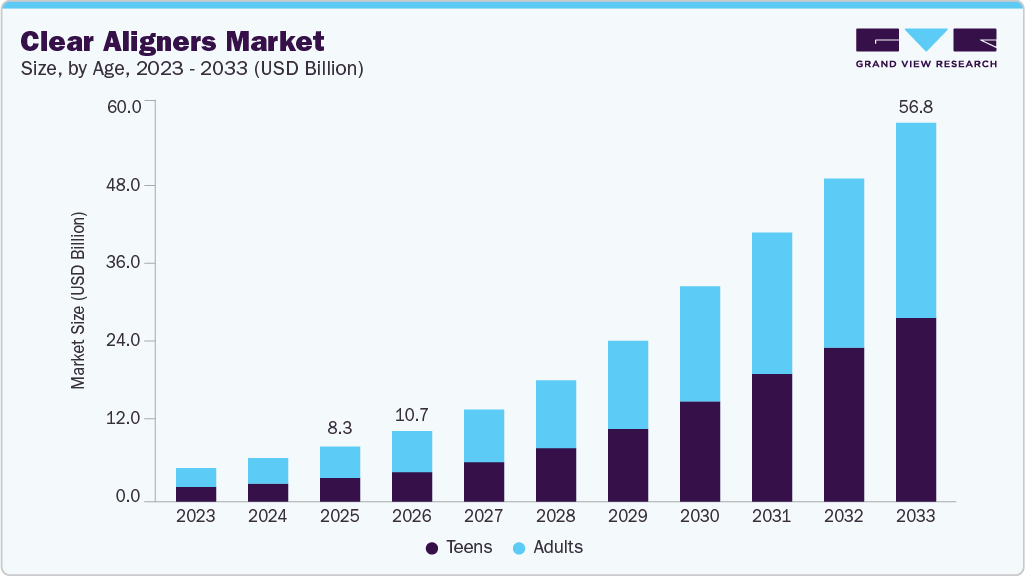
The 2025 study Orthodontic Treatment with Fixed Appliances Versus Aligners highlights that the increasing number of adult patients is actively reshaping clinical orthodontic practice. As adults prioritize aesthetics, comfort, and treatment discretion, demand is shifting away from traditional fixed appliances toward less visible alternatives. The comparative evaluation of braces and aligners in the study reinforces that this demographic preference is structurally strengthening the long-term adoption of clear aligners in routine orthodontic care.
Target Patient Pool
The study Prevalence of Malocclusion Traits in Primary Dentition, 2010-2024: A Systematic Review, published in July 2024 in Healthcare (MDPI), analyzes 47 epidemiological studies on preschool-aged children conducted worldwide between 2010 and 2024. It reports a pooled global malocclusion prevalence of approximately 54% in primary (deciduous) dentition, with wide regional variation ranging from 28.4% to 83.9%, and over half of the studies documenting prevalence above 50%. The most commonly observed occlusal traits were increased overjet and deep overbite, while others, such as anterior open bite and posterior crossbite, varied significantly across regions.
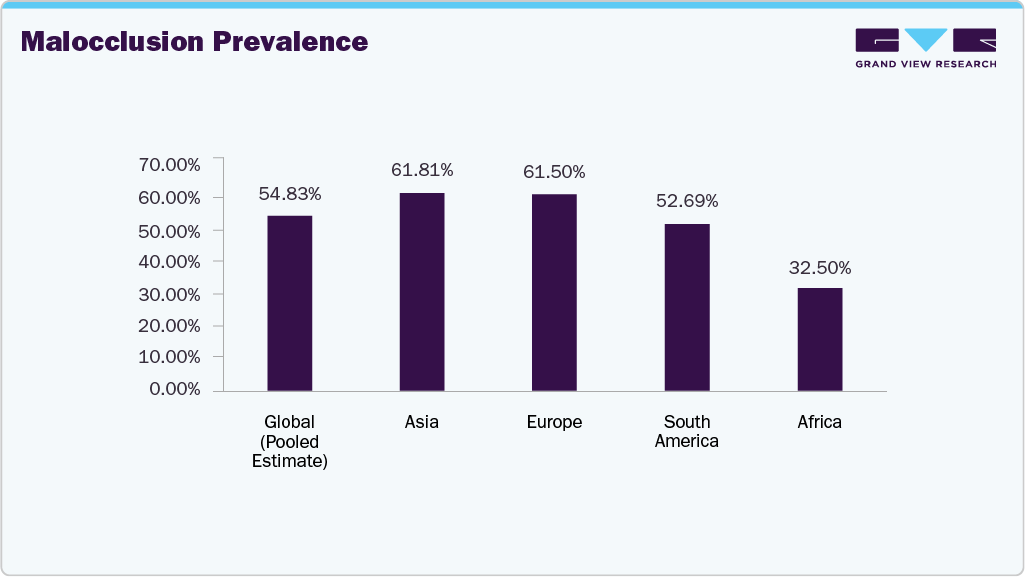
The prevalence profile represents a structurally strong long-term demand base for markets. A global malocclusion burden of ~54% at the preschool stage indicates a large pipeline of future adolescent and adult orthodontic candidates, supporting sustained market expansion. The wide regional variation (28.4%-83.9%) highlights uneven but high-growth opportunity pockets, particularly in regions with rising dental infrastructure and disposable incomes. High incidence of traits such as increased overjet and deep overbite-conditions well-suited for aligner-based correction-further strengthens the clinical suitability and commercial scalability of clear aligners, reinforcing multi-year volume growth potential.
Oral Diseases Cost the World USD 710 Billion Annually
The global economic burden of dental diseases remains substantial, reflecting high treatment intensity, productivity losses, and sustained long-term demand for orthodontic care. A 2024 report published in the Journal of Dental Research estimated that the total economic impact of dental diseases worldwide was USD 710 billion. This comprises roughly USD 387 billion in direct treatment costs and USD 323 billion in indirect costs (lost productivity, disability, etc.). The significant global economic burden of dental diseases highlights the large underlying treatment pool. As patient adoption of orthodontic care expands due to aesthetic preferences and comfort advantages, demand for clear aligner solutions is expected to rise steadily over the forecast period.

Consumer Behaviour
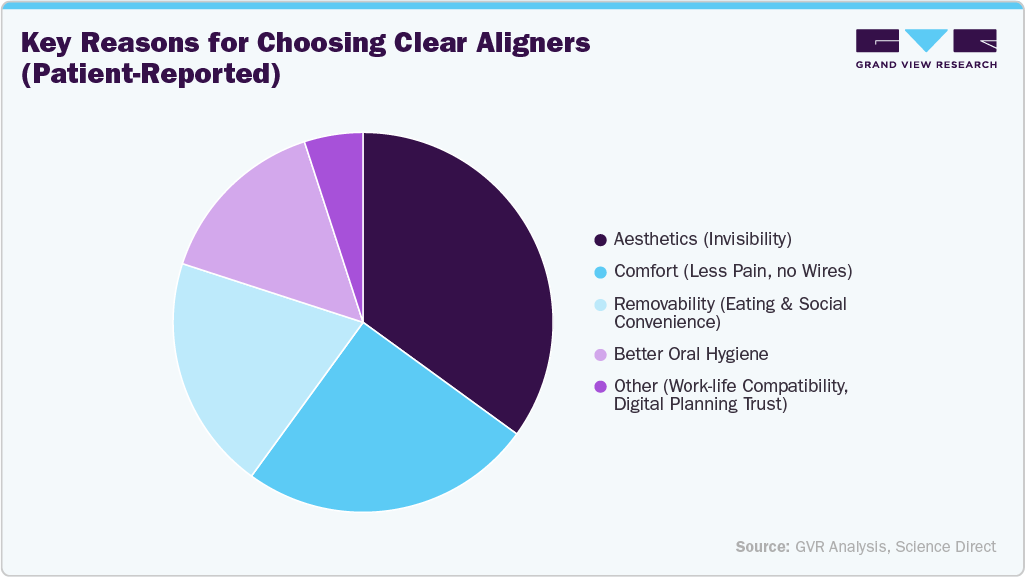
Consumers are increasingly preferring clear aligners due to their discreet appearance, superior comfort, removability, and improved oral hygiene compared to traditional fixed braces. Growing awareness through digital media marketing and dentist recommendations has significantly accelerated adoption, particularly among working adults and young professionals seeking aesthetic orthodontic solutions. The demand is further strengthened by shorter treatment times and the rising popularity of cosmetic dentistry. In parallel, the expansion of multi-specialty and orthodontic clinics into tier-2 and tier-3 cities has improved both accessibility and affordability. The availability of flexible financing options, digital intraoral scanning, and direct-to-consumer models has also enhanced market penetration. A 2023 systematic review published in the Dentistry Journal reported that while clear aligner therapy offers clear advantages in aesthetics and comfort, its predictability and clinical effectiveness vary depending on the type of tooth movement.
Moreover, technological advancements in artificial intelligence and direct 3D printing are transforming clear aligner design, treatment planning, manufacturing efficiency, and clinical monitoring, driving the next phase of precision-driven orthodontic care. Presented below are several renowned peer-reviewed studies that analyze major technological advancements shaping the market. These studies highlight how innovations in AI and 3D printing are actively driving clinical adoption, operational efficiency, and sustained global market growth, while also supporting the rapid expansion of the 3D-printed clear dental aligners market.
-
Unveiling the Role of Artificial Intelligence Applied to Clear Aligner Therapy: A Scoping Review - Published: January 2025. This review evaluates 41 clinical studies to assess how artificial intelligence is being integrated into clear aligner therapy. The findings show that AI is widely used for automated tooth segmentation with accuracy levels approaching 98%, improving digital treatment planning efficiency. AI-driven tools also support the fusion of CBCT and intraoral scan data, enable automated orthodontic measurements, and assist in outcome prediction. Emerging applications include AI-based remote monitoring systems that track aligner progress outside clinical settings, indicating a major shift toward data-driven, precision orthodontics.
-
“AI-Driven Advancements in Orthodontics for Precision and Efficiency” - published in MDPI, April 2025. This paper reviews recent advances in the application of artificial intelligence (AI) within orthodontics, with a specific focus on clear-aligner therapy. AI-powered systems are increasingly used for automated tooth segmentation, digital treatment planning, aligner design, and predictive tooth-movement modeling, significantly improving precision while reducing manual workload. The authors report that AI integration helps lower material and labor costs, accelerates aligner production timelines, and enhances overall clinical workflow efficiency. These technological gains are expected to improve global accessibility, affordability, and standardization of clear-aligner treatments.
-
Review: Advancements in Clear Aligner Fabrication: A Comprehensive Review of Direct-3D Printing Technologies - published in January 2024. This review surveys the shift from traditional thermoformed aligner manufacturing toward direct 3D-printing for clear aligners. It outlines how techniques such as SLA, DLP, PolyJet, and other vat-polymerization methods enable greater precision, customization, and faster production - while reducing waste and costs. The authors highlight advances in polymer resin development that improve biocompatibility, mechanical strength, transparency, and durability of printed aligners. At the same time, the review flags key challenges: ensuring material safety in the oral environment, long-term performance, and establishing industry-wide standards.
The studies show that artificial intelligence and direct 3D printing are being applied across aligner design, treatment planning, manufacturing, and monitoring. These applications support wider clinical use, faster production workflows, and continued market expansion.
Furthermore, strategic initiatives such as the launch of new clear aligners support market growth by addressing a key adoption barrier-long daily wear time. For instance, in September 2024, OrthoFX launched NiTime Clear Aligners in India with FDA 510(k) clearance, offering a reduced daily wear requirement of 9-12 hours compared with the conventional ~22 hours. The system uses proprietary AirShell and HyperElastic polymer technology, which the company states improves tooth-movement efficiency by up to 30%, reduces the need for refinements, and enhances treatment predictability. Shorter wear requirements improve patient compliance, expand adoption among lifestyle-sensitive users, and increase treatment acceptance, thereby supporting higher case volumes and faster aligner penetration in emerging markets such as India.
Pricing Analysis
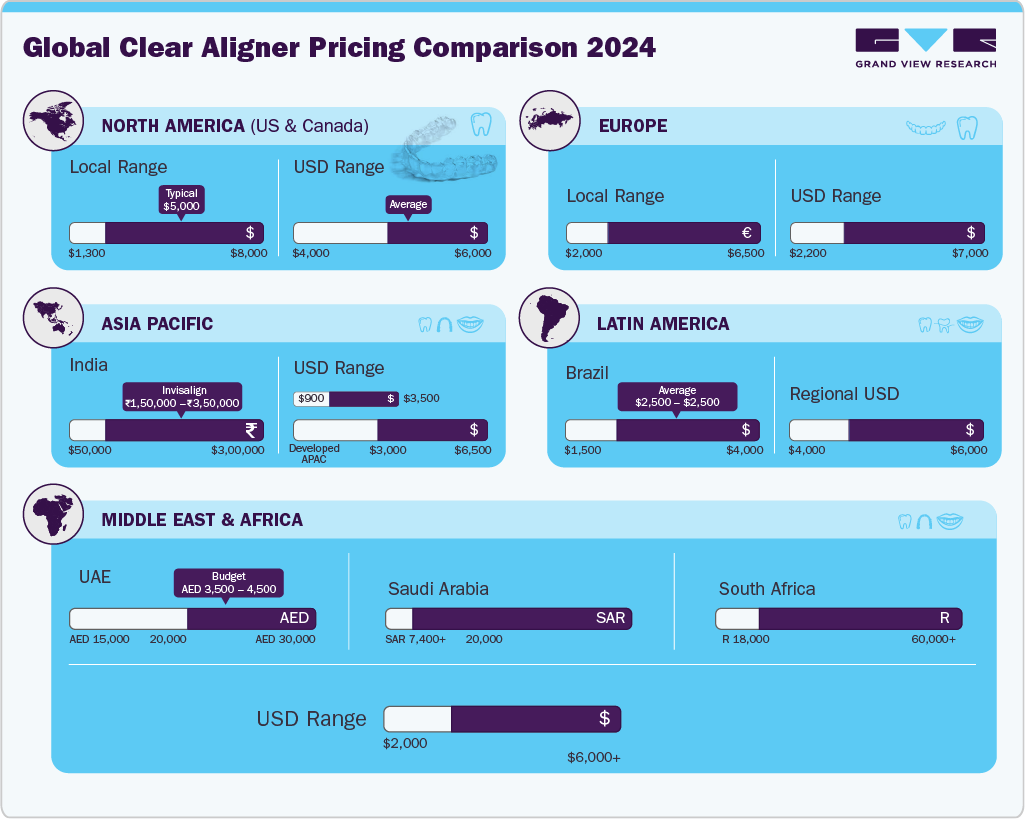
Clear aligner treatment pricing varies significantly across regions due to differences in clinical infrastructure, brand penetration, labor costs, and regulatory environments. North America and Western Europe represent the highest average treatment costs, driven by premium orthodontic services and strong brand dominance. Asia-Pacific and Latin America offer comparatively lower prices due to local manufacturers and lower operating costs. The Middle East shows premium pricing in Gulf countries, while Africa reflects wide variability based on urban access and specialist availability.
Pipeline Analysis
The clear aligner pipeline is expanding through clinical evaluations focused on complex malocclusions, skeletal discrepancies, accelerated tooth movement, and AI-supported treatment planning. Developers are also advancing wear protocols, digital monitoring integration, and adjunctive techniques such as micro-osteoperforations and mini-screws to enhance treatment efficiency. Reflecting these trends, the following table presents selected ongoing and recent clinical studies assessing clear aligner systems across a broad range of orthodontic conditions. These trials, led by academic institutions worldwide, highlight the growing clinical validation of clear aligner technology, its widening therapeutic scope, and its deeper integration with digital and procedural support tools.
Clear Aligners Pipeline Analysis
NCT Number
Conditions
Interventions
Sponsor
Completion Date
NCT06994754
Maxillary Deficiency|Cleft Lip and Palate
DEVICE: clear aligners
Cairo University
2026-12
NCT05573308
Malocclusion|Misaligned Teeth
DEVICE: Clear Aligners with Dental Monitoring|DEVICE: Clear Aligners
University of Illinois at Chicago
12/30/2027
NCT07169968
Mandibular Dental Crowding
DEVICE: clear aligners group|DEVICE: micro-osteoperforations group
Ain Shams University
11/15/2026
NCT07090746
Skeletal Class I Non-extraction Patients With Dental Crowding
DEVICE: Clear aligner|DEVICE: Fixed orthodontic appliance
Mansoura University
2025-12
NCT06536335
Malocclusion
DEVICE: Biomax Nuvola aligners|DEVICE: Biomax Nuvola aligners
Fondazione Policlinico Universitario Agostino Gemelli IRCCS
11/30/2025
NCT07117006
Skeletal Open Bite|Open Bite|Maxillary Intrusion|Mini-screws|Clear Aligner Appliance
DEVICE: miniscrew- supported maxillary posterior segments' intrusion using clear aligners
Cairo University
2/1/2026
NCT06968325
Root Resorption|Pain Perception|Treatment Duration
DEVICE: AI-based TruRoot group:|DEVICE: Conventional clear aligner group
University of Baghdad
12/1/2026
NCT05684510
Malocclusion|Class II Malocclusion
DEVICE: clear aligners|DEVICE: traditional treatment Fixed appliances with class II elastics.
Hama University
12/1/2026
NCT06814262
Orthodontic Appliance Complication
DEVICE: |DEVICE: Superimposition of final and initial positions of lateral incisors: Gingivally beveled 1x1x4mm aligners|DEVICE: Superimposition of final and initial positions of lateral incisors: Gingivally beveled 1x1x5mm aligners
Virginia Commonwealth University
2026-02
NCT04815564
Osteogenesis Imperfecta
DEVICE: Invisalign
Baylor College of Medicine
2027-12
NCT05492773
Crowding of Anterior Mandibular Teeth
DEVICE: Micro-osteoperforations Technique|DEVICE: Active comparater
Hama University
12/4/2026
NCT05905224
Orthodontic Tooth Movement
DEVICE: Invisalign 7-day wear protocol|DEVICE: Invisalign 3-day wear protocol
University of Florida
2028-08
NCT07040176
Distalization|Class II Malocclusion|Aligner Therapy|Distalization by Miniscrews
PROCEDURE: Upper molar distalization
Aristotle University Of Thessaloniki
2028-04
NCT06516185
Crowding, Tooth|Tipped Tooth or Teeth|Rotation of Tooth|Malocclusion, Angle's Class
DEVICE: direct-printed aligner|DEVICE: thermoformed aligner
Universidad Complutense de Madrid
2026-06
NCT06403371
White Spot Lesion
OTHER: Fluoride varnish |OTHER: Normal saline
King Abdullah University Hospital
2024-10
Source: ClinicalTrials.gov
Market Concentration & Characteristics
The clear aligners industry is characterized by its focus on aesthetic and digitally driven orthodontic care, with demand driven by rising malocclusion prevalence, growing adult orthodontic adoption, and advancements in digital dentistry. The market emphasizes treatment precision, patient comfort, and workflow efficiency, supported by increasing dental infrastructure investments and expanding access to orthodontic care across both developed and emerging economies.
The clear aligners industry demonstrates a high degree of innovation, driven by advancements in artificial intelligence, intraoral scanning, and direct 3D printing technologies. AI-based treatment planning, automated tooth segmentation, and predictive movement modeling are improving treatment accuracy and reducing manual workload. At the same time, direct 3D printing of aligners and advanced polymer materials is enhancing fit, force control, and production speed. These innovations are strengthening treatment predictability and enabling scalable, digitally integrated orthodontic workflows.
Regulations play a significant role in the clear aligners industry, as orthodontic devices must comply with stringent safety, biocompatibility, and performance standards enforced by regulatory bodies such as the U.S. FDA, CE authorities in Europe, and other national health agencies. While regulatory oversight ensures patient safety and product reliability, it also increases development costs and approval timelines, influencing product launch cycles and market entry strategies.
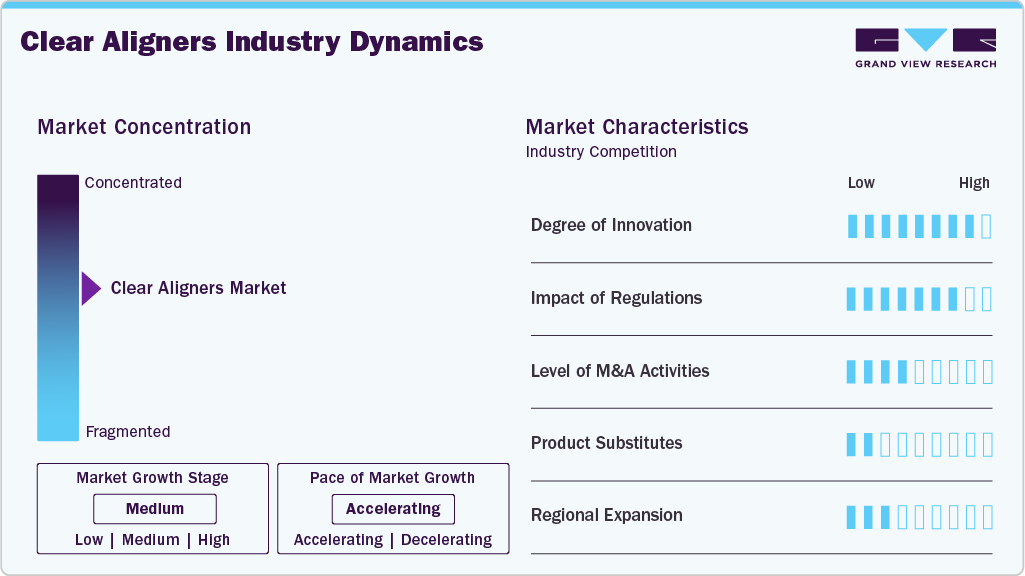
The clear aligners industry has experienced a moderate to high level of mergers, acquisitions, and strategic investments, mainly focused on expanding digital workflows, geographic reach, and product portfolios. Major orthodontic companies are actively acquiring or partnering with software developers, intraoral scanner providers, and material science firms to build integrated digital orthodontic ecosystems and accelerate product innovation.
Product substitutes for clear aligners include traditional fixed metal braces, ceramic braces, lingual braces, and removable orthodontic appliances. While these alternatives remain clinically effective, they often involve greater visibility, reduced comfort, and longer adjustment periods. Clear aligners continue to gain preference due to their removable nature, aesthetic appeal, and ease of oral hygiene maintenance, particularly among adult and working-age patients.
The clear aligners industry is expanding across emerging regions such as Asia-Pacific, Latin America, and the Middle East, driven by rising dental awareness, growing middle-class populations, and expanding private dental clinic networks. Countries like India, China, and Brazil are witnessing increased adoption due to improved access to digital orthodontic infrastructure and growing demand for aesthetic treatments.
Age Insights
The adults segment held the largest market share in 2025 due to persistent untreated malocclusion and rising aesthetic awareness. According to a study published in July 2024 in the American Journal of Orthodontics and Dentofacial Orthopedics, “Adult orthodontics, motivations for treatment, choice, and experience”. This survey-based study examined why adults undergo orthodontic treatment and their experience with different appliance types. It found that many adult patients prefer clear aligners over fixed braces, citing reasons such as better aesthetics, ease of hygiene, and lifestyle compatibility. The results underscore a growing adult demand for aligner therapy driven by appearance, convenience, and comfort.
The teens segment is expected to register the highest growth rate over the forecast period, supported by expanding clinical validation and high treatment acceptance. The July 2025 systematic review and meta-analysis titled “Clinical Effectiveness of Clear Aligner Therapy During Interceptive Orthodontic Treatment in Adolescent Patients” evaluated eight clinical studies involving adolescents with mixed dentition treated using clear aligner therapy (CAT). The review found that CAT enabled measurable transverse arch expansion of approximately 3.0-3.5 mm, delivered effective anterior crossbite correction, and achieved satisfactory bite and occlusal outcomes. Patient and parent satisfaction levels ranged between 85% and 92%, with clear aligners frequently preferred over conventional appliances due to better comfort, superior aesthetics, and easier oral hygiene maintenance. While the authors noted that small sample sizes and study variability limit definitive conclusions, the overall clinical outcomes consistently supported aligners as a viable option for adolescent orthodontic intervention.
Material Insights
The polyurethane segment held the largest market share in 2025 due to its strong balance of flexibility, durability, and force consistency required for effective orthodontic movement. Polyurethane materials offer superior transparency, tear resistance, and sustained elastic recovery compared to alternative plastics, making them widely preferred in clear aligner manufacturing. Their compatibility with advanced thermoforming and direct 3D-printing workflows further supports large-scale production, consistent treatment performance, and broad clinical adoption among leading aligner brands.
Polyethylene Terephthalate Glycol (PETG) is expected to grow at a significant rate during the forecast period due to its high clarity, chemical resistance, and cost-effectiveness in clear aligner manufacturing. PETG offers good thermoformability, consistent force delivery, and enhanced stain resistance compared with conventional plastics. Its suitability for mass production and compatibility with digital orthodontic workflows make it increasingly attractive for mid-range and value aligner brands, supporting rising adoption across emerging and cost-sensitive markets.
End Use Insights
The standalone practitioners segment held the highest market share in 2025, driven by the rapid shift of dentists toward private practice and higher-margin elective treatments. A 2025 report shows that many dentists in England are abandoning NHS-funded work as fees fail to cover operating costs. The British Dental Association estimates that practices subsidise NHS care by approximately USD 400 million annually (£332 million). Routine procedures such as examinations and dentures now generate net losses, accelerating the move toward private care. In April 2025, the Public Accounts Committee warned that NHS dentistry is in crisis, with access falling to 40% of adults by March 2024. As a result, dentists increasingly prioritise privately funded orthodontic treatments, strengthening standalone segment growth.
Group practices are expected to register the highest market growth due to their expanding patient base, strong brand visibility, and ability to invest in advanced digital orthodontic infrastructure. These networks benefit from centralized treatment planning, standardized clinical protocols, and efficient patient acquisition through multi-location operations. Higher case volumes, integrated intraoral scanning, and in-house aligner workflows allow group practices to scale clear aligner adoption faster than independent clinics, supporting accelerated market expansion during the forecast period.
Distribution Channel Insights
The offline segment held the highest market share in 2025, supported by the opening of different clinics and expansion into tier-2 and tier-3 cities. In India and similar markets, dental service providers are rapidly expanding their footprint beyond major metropolitan areas to meet rising demand in smaller cities. Clinics in tier-2/3 cities offer local access to clear aligner treatments, making chairside consultations and follow-ups easier for patients - reinforcing the dominance of offline distribution and in-person treatment delivery.
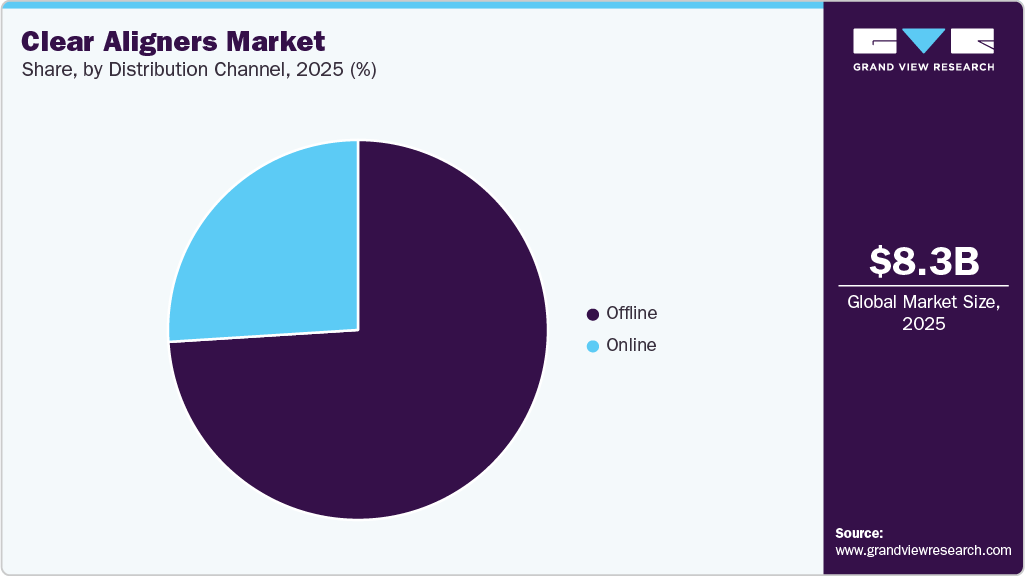
The online channel is expected to register the highest market growth due to rising adoption of digital consultations, remote case assessments, and direct-to-consumer orthodontic platforms. Virtual smile assessments, AI-based treatment planning, and home impression kits are making initial aligner access more convenient for patients. This channel supports faster onboarding, wider geographic reach, and lower upfront consultation costs. However, complex case management and regulatory oversight still limit full treatment dependence on online-only models, keeping hybrid online-offline care dominant.
Regional Insights
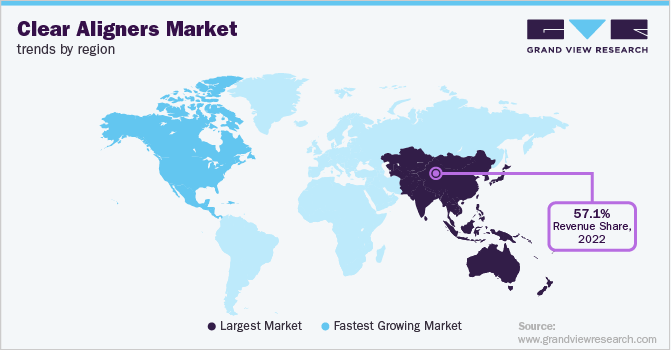
North America held the largest revenue share in the clear aligners market in 2025. Growth is driven by high orthodontic awareness, widespread adoption of digital dentistry, and strong demand for aesthetic orthodontic solutions among adults and teenagers. The region benefits from advanced dental infrastructure, early adoption of intraoral scanners, and a strong presence of leading clear aligner manufacturers. High disposable income, insurance-supported orthodontic procedures in select cases, and continuous product innovation in aligner materials and treatment planning software further support market expansion across the region. In addition, in the South American market, rising urban dental demand and growing private clinic networks are increasing clear aligner adoption. Improving affordability and expanding digital capabilities further strengthen regional market growth.
U.S. Clear Aligners Market Trends
The clear aligners market in the U.S. is driven by rising demand for aesthetic orthodontics, growing adult cases, and rapid adoption of digital dentistry. Reflecting these trends toward early intervention and technology-driven orthodontics, in September 2025, Ormco introduced Spark Junior, a two-phase clear-aligner system designed for children and teens. Phase One targets patients under 13 with up to 25 aligner stages and unlimited refinements over 1.5 years, while Phase Two supports continued orthodontic care into young adulthood. The system integrates BiteSync Class II correction and uses TruGEN transparent material, enabling early, flexible, and digitally optimized orthodontic treatment.
Europe Clear Aligners Market Trends
The clear aligners market in Europe is witnessing steady growth, driven by rising orthodontic awareness, expanding private dental practices, and increasing demand for aesthetic dental solutions. Western European countries are rapidly adopting digital dentistry workflows, including CAD/CAM-based aligner manufacturing and virtual treatment planning, supported by strong regulatory standards and a high focus on clinical safety. These trends are reinforced by continuous training programs for orthodontists and close collaborations with aligner manufacturers. Reflecting this shift toward advanced digital orthodontics, in March 2025, LuxCreo introduced the 4D Aligner at IDS 2025-the first MDR/CE Class IIa-certified, directly 3D-printed clear aligner. Using its proprietary ActiveMemory polymer and multi-thickness design, the system enables precise tooth movement and allows same-day aligner production, significantly reducing patient visits and speeding up treatment initiation.
The UK clear aligners market is driven by increasing demand for private orthodontic care, especially as NHS dental access remains constrained. A growing number of dental practitioners are shifting toward private orthodontic treatments, where clear aligners offer higher margins. Rising adult orthodontic cases, social-media-driven aesthetic awareness, and expanding group dental practices are supporting market demand. Increased adoption of digital scanning and in-clinic aligner workflows is further accelerating growth. The emphasis on minimally visible orthodontic solutions continues to drive aligner preference nationwide.
The clear aligners market in Germany is expanding as demand for aesthetic, convenient orthodontic solutions increases among adults and younger patients. Growth is supported by high dental awareness, strong private insurance coverage, and widespread adoption of digital dentistry technologies such as intraoral scanning and 3D printing. Germany’s well-established dental infrastructure, rising preference for minimally visible treatments, and increasing availability of in-office and direct-provider aligner systems are strengthening market adoption across both urban and regional practices.
Italy clear aligners market is expanding due to rising demand for discreet orthodontic treatments, growth in private dental practices, and increased use of digital scanning and 3D printing. Consumer preference for aesthetic solutions further drives adoption.
The clear aligners market in France is growing as demand increases for aesthetic, removable orthodontic solutions supported by strong dental insurance coverage and expanding digital dentistry adoption. Rising adult treatment uptake and wider access to private dental clinics further drive market expansion.
Spain clear aligners marketis growing steadily, driven by increasing demand for aesthetic orthodontic treatments, expanding private dental clinics, and rising adoption of digital workflows. Greater affordability and awareness among young adults further support market uptake.
Asia Pacific Clear Aligners Market Trends
The clear aligners market in the Asia Pacific is expected to register the fastest growth from 2026 to 2033. Growth is fueled by a large patient pool with untreated malocclusion, rising disposable income, and rapid expansion of private dental clinics in tier-2 and tier-3 cities. Countries such as China, India, South Korea, and Japan are witnessing strong adoption of digital dentistry, supported by growing orthodontic training programs. Increasing aesthetic awareness among young adults and the influence of social media are further accelerating demand.
China clear aligners market is witnessing strong growth, driven by rising middle-class income, increasing cosmetic dental awareness, and the rapid expansion of private dental chains. China has also emerged as a major manufacturing hub for clear aligners, supported by domestic brands and large-scale digital production facilities. The growing adoption of AI-based treatment planning, tele-orthodontics, and direct-to-consumer models is further reshaping market dynamics, while government support for digital healthcare continues to aid long-term expansion.
Supporting this demand trend, a 2024 study published in Frontiers in Pediatrics titled “Prevalence and contributing factors of malocclusion in Zhuang children aged 7-8 years in southern China” found that 58.5% of children exhibited malocclusion, indicating a large early-stage orthodontic treatment pool. Socio-demographic and oral-health factors were significantly associated with a higher risk, reinforcing the need for early orthodontic intervention and strengthening the long-term demand outlook for clear aligner adoption in China.
The clear aligners market in India is expanding due to rising orthodontic awareness, increasing malocclusion prevalence, digital dentistry adoption, and growing demand for aesthetic, convenient treatment options. Studies from India show wide variation in malocclusion prevalence depending on region, age group, and assessment method. A cross-sectional 2024 study among adolescents and young adults (age 14-22) in eastern India reported a malocclusion prevalence of 89.74%; within that, Angle's classification Class I was the most common (68.17%), followed by Class II Div 1 (15.25%), Class II Div 2 (3.11%) and Class III (3.2%). In addition, another meta-analysis of 54 studies covering nearly 98,000 children (aged 8-15) estimated a pooled national prevalence of about 35.4 %. Other region-specific studies report far higher numbers: for instance, a survey of 10-12-year-olds in Kozhikode (Kerala) found 83.3% had some form of malocclusion, with the majority being Angle's classification of malocclusion Class I. Meanwhile, older reports from other regions range from as low as 19.6% to as high as 90%. This widespread highlights inconsistency in measurement and the need for standardized, nation-wide surveys to reliably assess the burden of dental malocclusion in India.
Australia clear aligners market is growing due to rising adult orthodontic demand, strong private dental spending, and rapid adoption of digital workflows, supported by well-developed dental infrastructure and increased preference for aesthetic treatment options.
The clear aligners market in Japan is expanding as consumers prioritize discreet orthodontic solutions, supported by high dental awareness, technological readiness, and increasing adoption of digital scanning, 3D printing, and clinic-driven aligner treatment models across major urban regions.
Latin America Clear Aligners Market Trends
The clear aligners market in Latin America is growing at a moderate pace, supported by expanding private dental clinics and increasing awareness of aesthetic orthodontic treatments. Brazil, Mexico, and Argentina are key markets due to improving access to orthodontic care and rising middle-income populations. The growth of dental tourism, expanding orthodontic training programs, and gradual penetration of digital dentistry workflows are supporting aligner adoption. However, cost sensitivity and uneven access across rural regions continue to influence market development.
Middle East & Africa Clear Aligners Market Trends
The clear aligners market in the Middle East and Africa is experiencing gradual growth, supported by rising demand for cosmetic dentistry, expanding private healthcare infrastructure, and increasing adoption of digital dental technologies. GCC countries, particularly the UAE and Saudi Arabia, are emerging as key growth markets due to high disposable incomes, strong medical tourism, and ongoing healthcare modernization initiatives. The expanding presence of international dental chains is further strengthening market penetration. However, affordability constraints and limited availability of orthodontic specialists continue to restrict faster adoption in several African countries. The GCC market is benefiting from premium treatment demand, rapid digital adoption, and strong investment in advanced dental services.
Supporting the long-term demand outlook, a 2024 study published in The Saudi Dental Journal reported a 59.1% prevalence of malocclusion among preschool children in Riyadh, indicating a substantial future orthodontic treatment pool. The high occurrence of deep overbite and increased overjet highlights the early onset of alignment issues and reinforces the need for early screening and intervention-factors that are expected to sustain future demand for orthodontic and clear aligner therapies across the region.
Key Clear Aligners Company Insights
Some of the key players operating in the market include Align Technology, Ormco Corporation, 3M, Dentsply Sirona, Angel Aligner, Shanghai Smartee Denti-Technology Co., Ltd., Smile White Holdings Limited, Clove Dental, MakeO Healthcare Technologies Pvt. Ltd., and DentalStudio. These companies compete through digital orthodontic innovation, material advancement, and expanded clinical collaboration to strengthen their market positioning.

Key Clear Aligners Companies:
The following are the leading companies in the clear aligners market. These companies collectively hold the largest market share and dictate industry trends.
- Align Technology
- Envista (Ormco Corporation)
- Institut Straumann AG
- 3M
- Dentsply Sirona
- Henry Schein, Inc.
- Angel Aligner
- Modern Me GmbH
- Shanghai Smartee Denti-Technology Co., Ltd.
- Solventum
- SCHEU-DENTAL GmbH
- Great Lakes Dental Technologies
- Shanghai Smartee Denti-Technology Co., Ltd.
- DynaFlex
Recent Developments
-
In October 2025, LuxCreo received a strategic investment from Angelalign Technology (October 2025) to co-develop next-generation high-performance 3D printing materials for clear aligners. The partnership aims to accelerate the adoption of direct-print workflows, leveraging LuxCreo’s “ActiveMemory” smart-material technology to enable aligners with variable elasticity, precise force delivery, and better fit. The collaboration is intended to improve treatment predictability, support complex and personalized orthodontic cases, and expand digital-dentistry ecosystems globally.
-
In September 2025, Align Technology hosted its 2025 Invisalign GP Summit - a premier education and networking event for dental practices. Over 700 dentists and their teams attended hands-on sessions showcasing the latest enhancements in the Invisalign System, the iTero Scanner, and the broader Align Digital Platform. The Summit emphasized optimized workflows, improved patient experience, and integrated digital-dentistry tools - underlining Align’s push to broaden adoption and streamline aligner-based orthodontic care.
-
In September 2025, Medit launched Medit Aligners - a new digital clear-aligner system fully integrated with the Medit Orthodontic Suite (MOS). The system enables clinicians to scan, simulate, plan, design, and initiate aligner treatment chairside - supporting same-day starts and eliminating outsourcing delays. By combining advanced workflow control with digital manufacturing, Medit Aligners aim to reduce turnaround time, improve treatment predictability, and streamline the orthodontic process for both dental professionals and patients.
-
In June 2025, Align Technology launched an integrated consumer-and-professional brand campaign promoting Invisalign treatment for children and teens. Called “Invis is for Kids,” the campaign aims to raise awareness among parents and orthodontists about early orthodontic intervention using the Invisalign system - including the Invisalign Palatal Expander and Invisalign First aligners.
-
In July 2025, Invisalign maker Align Technology launched a new clear-aligner product featuring integrated solid occlusal blocks for mandibular advancement. The system is designed for growing patients with Class II skeletal or dental malocclusion. It aims to correct jaw alignment while straightening teeth - offering a single-appliance solution for both jaw positioning and dental alignment.
-
In November 2024, Solventum (formerly 3M Health Care) launched the first 3D-printed aligner attachments, branded 3M Clarity Precision Grip Attachments - compatible exclusively with 3M Clarity Aligners. These attachments are fully cured, preloaded, stain-resistant, and precisely shaped to match the treatment plan.
Clear Aligners Market Report Scope
Report Attribute
Details
Market size value in 2026
USD 10.69 billion
Revenue forecast in 2033
USD 56.81 billion
Growth rate
CAGR 26.95% from 2026 to 2033
Actual data
2021 - 2025
Forecast period
2026 - 2033
Market representation
Revenue in USD million/billion & CAGR from 2026 to 2033
Report coverage
Revenue forecast, company ranking, competitive landscape, growth factors, and trends
Segments covered
Age, material, end-use, distribution channel, region
Regional scope
North America; Europe; Asia Pacific; South America; MEA
Country scope
U.S.; Canada; Mexico; UK; Germany; France; Italy; Spain; Norway; Denmark; Sweden; Brazil; Argentina; China; India; Japan; Australia; South Korea; Thailand; South Africa; Saudi Arabia; UAE; Kuwait
Key companies profiled
Align Technology, Envista (Ormco Corporation), Institut Straumann AG, 3M, Dentsply Sirona, Henry Schein, Inc., Angel Aligner, Modern Me GmbH, Shanghai Smartee Denti-Technology Co., Ltd., Solventum, SCHEU-DENTAL GmbH, Great Lakes Dental Technologies, and DynaFlex.
Customization scope
If you need specific information that is not currently within the scope of the report, we will provide it to you as part of customization
Pricing and purchase options
Avail customized purchase options to meet your exact research needs. Explore purchase options
Global Clear Aligners Market Report Segmentation
This report forecasts revenue growth at global, regional, and country levels and provides an analysis of the latest industry trends in each of the sub-segments from 2021 to 2033. For this study, Grand View Research has segmented the global clear aligners market report based on age, material, end use, distribution channel, and region:
-
Age Outlook (Revenue, 2021 - 2033 (USD Million)
-
Adults
-
Teens
-
-
Material Outlook (Revenue, 2021 - 2033 (USD Million)
-
Polyurethane
-
Plastic Polyethylene Terephthalate Glycol
-
Others
-
-
End Use Outlook (Revenue, 2021 - 2033 (USD Million)
-
Hospitals
-
Stand-Alone Practices
-
Group Practices
-
Others
-
-
Distribution Channel Outlook (Revenue, 2021 - 2033 (USD Million)
-
Online
-
Offline
-
-
Regional Outlook (Revenue, 2021 - 2033 (USD Million)
-
North America
-
U.S.
-
Canada
-
Mexico
-
-
Europe
-
UK
-
Germany
-
France
-
Italy
-
Spain
-
Norway
-
Denmark
-
Sweden
-
-
Asia Pacific
-
India
-
Japan
-
China
-
Australia
-
South Korea
-
Thailand
-
-
Latin America
-
Brazil
-
Argentina
-
-
Middle East & Africa
-
South Africa
-
Saudi Arabia
-
UAE
-
Kuwait
-
-
Frequently Asked Questions About This Report
b. The global clear aligners market size was estimated at USD 8.29 billion in 2025 and is expected to reach USD 10.69 million in 2026.
b. The global clear aligners market is projected to grow at a CAGR of 26.95% from 2026 to 2033 to reach USD 56.81 billion by 2033.
b. Based on age, adults segment held the largest market share in 2025 due to persistent untreated malocclusion and rising aesthetic awareness.
b. The key players in the clear aligners market are Align Technology, Ormco Corporation, 3M, Dentsply Sirona and Angel Aligner among others.
b. The clear aligners market is driven by demand for aesthetic orthodontic solutions, preference for removable appliances, growth of adult orthodontics, digital treatment planning adoption, expansion of dental service organizations, direct-to-consumer awareness, and increasing availability of trained orthodontists and dentists offering aligner-based treatments.
Share this report with your colleague or friend.
Need a Tailored Report?
Customize this report to your needs — add regions, segments, or data points, with 20% free customization.

ISO 9001:2015 & 27001:2022 Certified
We are GDPR and CCPA compliant! Your transaction & personal information is safe and secure. For more details, please read our privacy policy.
Trusted market insights - try a free sample
See how our reports are structured and why industry leaders rely on Grand View Research. Get a free sample or ask us to tailor this report to your needs.


