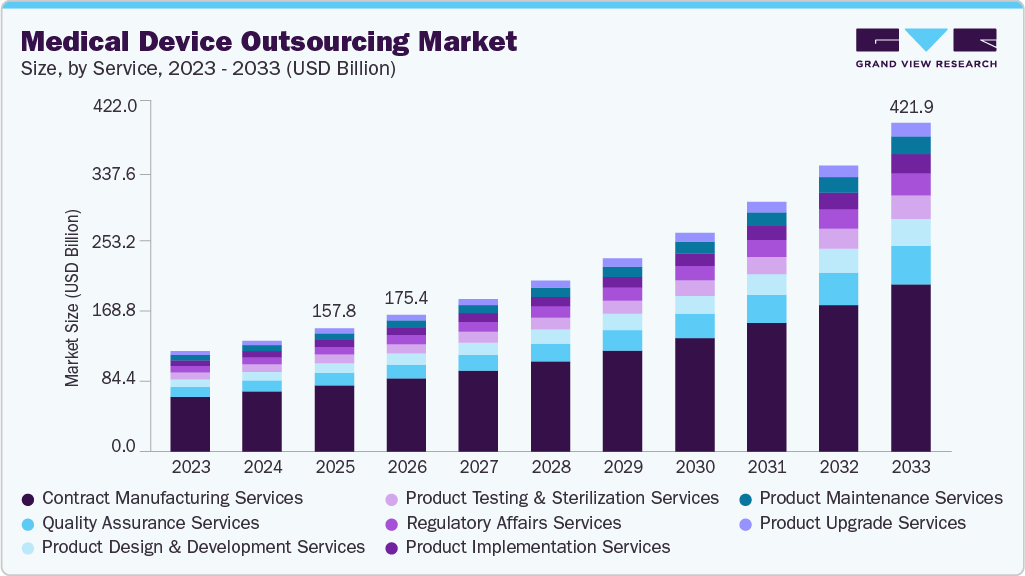
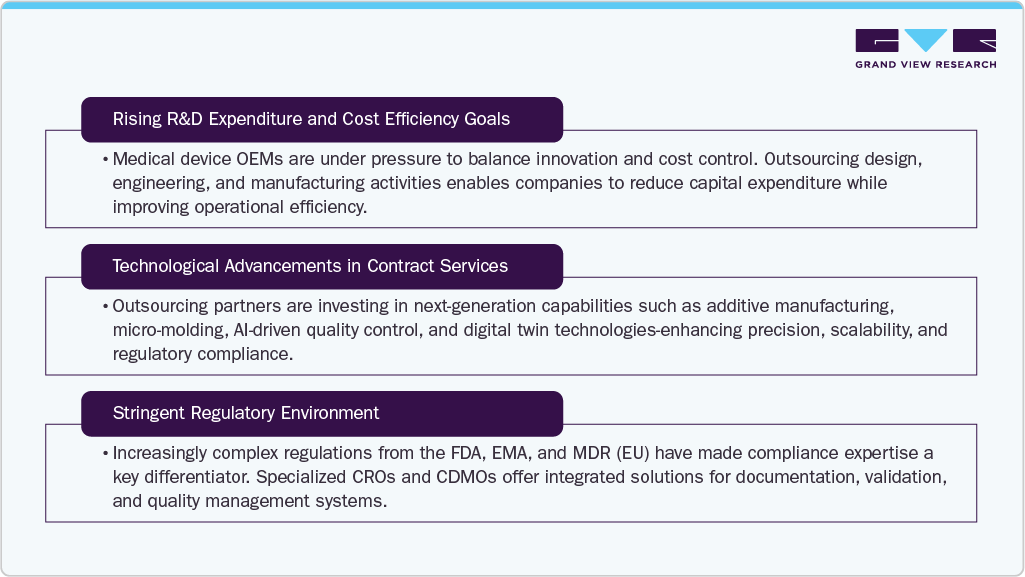
The global medical device outsourcing market size was estimated at USD 128.8 billion in 2023 and is anticipated to grow at a compound annual growth rate (CAGR) of 12.8% from 2024 to 2030. Increasing demand for medical devices combined with the rising price competition and requirement to reduce cost is expected to drive the market during the forecast period. In addition, growing difficulties in product engineering along with the increasing number of new entrants are anticipated to shape the future of the market. The demand for medical devices witnessed a steady rise in recent years. Growing demand for novel technologies and increasing need to make devices patient-friendly are expected to improve pipeline of medical devices during the forecast period. Owing to strict regulations by regulatory agencies such as the FDA and EMA, medical device companies outsource their medical dealing needs to streamline the regulatory process.
Thus, this is expected to have a positive impact on the market growth for medical device outsourcing in a coming years. During COVID-19, the majority of clinical trials were only focused on treating and diagnosing COVID-19. However, during post pandemic, this trend has been changing. As per the Trial trove, as of December 2023, the majority of trials were conducted for oncology and central nervous system diseases.
Moreover, medical device industry has become competitive and categories such as coronary stents, orthopedic devices, and wound care are moving towards maturity. As high-impact scientific innovation in the above categories are difficult to identify, smaller companies such as Draco (Germany) are gaining market share by offering low prices and introducing innovative business models. Industry competition is continuously growing worldwide.
Key companies in the market undertaking various strategic initiatives to strengthen their market presence. For instance, in January 2023, Avantor, Inc. declared an establishment of a multiyear supply & services collaboration with Catalent, Inc. Avantor is set to become Catalent's primary provider of manufacturing materials, clinical and laboratory supplies, as well as services, thereby contributing to an enhancement of their current partnership.
The global medical device outsourcing market is characterized by a high degree of innovation. Rapid advancements in technology, such as the Internet of Things (IoT), artificial intelligence (AI), robotics, and nanotechnology, are influencing the medical device industry.
Several market players, such as Eurofins Scientific SE, Integer Holdings Corporation, Toxikon Corp., and Wuxi AppTec, and North American Science Associates, Inc. are involved in merger and acquisition activities. Through M&A activity, these entities can expand their geographic reach and strengthen their market position.
The impact of Regulations is expected to be significant. Medical devices are subject to strict quality standards and regulations to ensure patient safety and product effectiveness.Various regulatory requirements are put in place to ensure a safety, efficacy, and quality of medical devices.
Major players in the market are executing various strategic initiatives to broaden their activities and solidify their presence in new geographic regions. This expansion allows these key companies to enter markets with distinct needs or opportunities.
The global medical device contract manufacturing market size was estimated at about USD 70 billion in 2023. The segment led the market and accounted for more than 54.4% share of the global revenue in 2023. Based on services, the market is segmented into quality assurance services, regulatory affairs services, product design & development services, product testing & sterilization services, product implementation services, product upgrade services, product maintenance services, and contract manufacturing services.
Increasing focus on decreasing a cost of production is augmenting the growth of this segment. In addition, increasing complexity in manufacturing is contributing to market growth. Manufacturing high-quality and safe devices for patient care is a major concern of medical device manufacturers. Increasing patient pool, product advancements, and investments by market players is expected to positively impact the market. The global medical device manufacturing outsourcing market size is thus projected to grow notably in the near future. In December 2023, TT Electronics— specializing in manufacturing solutions and engineered technologies, received FDA approval for its electronics manufacturing facility in China. This would enable the company to manufacture Class IIa devices on behalf of medical OEM customers across the globe.
However, the quality assurance services segment is projected to attain the fastest CAGR growth of 15.0% during a forecast period. Maintenance of an effective quality management system is an integral part of the production of every medical device. One such quality management system is ISO 13485, which involves the development, implementation, and maintenance of the products intended for use by medical device manufacturers and suppliers. Medical device manufacturers are outsourcing quality management services to medical device consulting companies to ensure compliance and provide high-quality components alongside safe and effective finished medical devices.
Cardiology segment accounted for a maximum share of over 21% in 2023 and is likely to remain dominant throughout a forecast period. Based on the application, the market is segmented into cardiology, diagnostic Imaging, orthopedic, IVD, ophthalmic, general & plastic surgery, drug delivery, dental, endoscopy, diabetes care, and others.
High number of cardiovascular disease deaths is contributing towards a positive growth of this industry as increasing number of medical practitioners and patients have understood the necessity of the early diagnosis and treatment of these disorders. Cardiovascular devices are complex in nature and require technical competence; hence, outsourcing these devices is a wiser option. Moreover, to meet the increasing demand for cardiovascular devices, market players have to leverage on contract manufacturers’ production, warehousing, and distribution capabilities, which ultimately help market players to save cost and sustain in rising competition.
General and plastic surgery device outsourcing is anticipated to exhibit the fastest CAGR growth of 14.3% from 2024 to 2030. Availability of competent outsourcing firms, which comply with a regulatory requirements, and a rising demand for cosmetic surgeries are the factors expected to contribute to a growth of this segment. Awareness and consciousness about physical appearance have significantly increased in recent years, which has increased the demand for cosmetic surgeries, globally.
Surgical devices like fixation devices, extremity splints, and epilators require specialized molding and machining processes, which increases a demand for outsourcing these devices. Introduction of minimally invasive and noninvasive surgeries has led to a rise in a number of surgeries performed in a year. This calls for innovative and procedure-specific devices.
Class II type medical devices accounted for a largest market share of 81.34% in 2023 and a segment is expected to register a fastest CAGR of 14.0% over a forecast period owing to a high cost of medical devices, and almost 43.0% of the medical devices fall under this category. Based on the class type, the medical device outsourcing market is segmented into Class I, Class II & Class III.
Class II includes catheters, syringes, surgical gloves, blood pressure cuffs, pregnancy test kits, contact lenses, and blood transfusion kits. These devices have a higher risk involved than Class I devices as these are to be in continuous contact with patients.
Class I type medical devices are also anticipated to register significant growth during the forecast period. These devices are noninvasive. Currently, 47.0% of the devices fall under this category and 95.0% of the devices in this category are exempt from regulatory procedures due to low-risk levels. Class I devices are the easiest and fastest to purchase from the market due to the low risk to the patient and rarely provide critical to life-sustaining care. The majority of Class I devices are exempt from FDA's premarket notification (510k) and Premarket Approval Requirements (PMA).
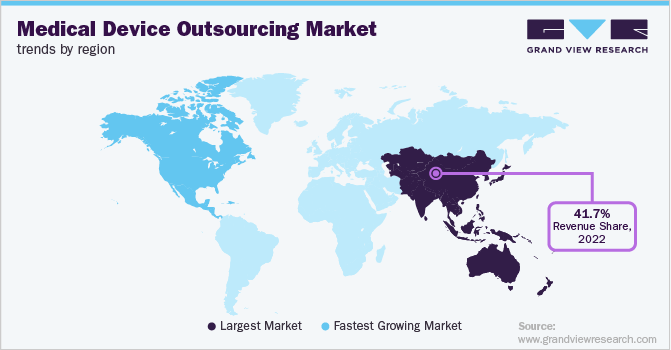
Asia Pacific dominated the global market in 2023 with a largest revenue share of 41.3%. The presence of market players and competitive pricing are the other supporting factors that are anticipated to drive this regional market. Also, an increasing demand for medical devices owing to a growing patient population suffering from chronic and infectious diseases is fueling the market growth in this region. For instance, during the first wave of COVID-19, there was a growing demand for CT scanners in India to detect pneumonia.
Japan is expected to dominate the Asia Pacific medical device outsourcing market owing to a rise in demand for new and cost-effective medical devices. Presence of a stringent regulatory framework and standards for medical device manufacturing is leading to an increase in overall costs. Thus, an increase in the need to maintain the standards and curb healthcare expenditure simultaneously is anticipated to drive the market in this region. Furthermore, high dependence of industry players on economic conditions, which are fluctuating in this region, is expected to propel the demand for consulting services.
In North America, the market for medical device outsourcing is anticipated to witness a significant growth from 2024 to 2030. This region is home to numerous medical device companies, which are outsourcing parts of their regulatory and consulting functions to regulatory service providers, thereby contributing to a growth of the medical device outsourcing market. High cost of R&D is a major challenge, which has encouraged various medical device companies in North America to outsource functions to third-party vendors with high levels of expertise in the domain.
The U.S. held a largest market share in North America in 2023. Large medical device companies are outsourcing parts of their regulatory functions, such as report writing & publishing, clinical trial application services, product design, and product maintenance, to regulatory service providers, thereby contributing to a growth of the medical device outsourcing market in the U.S. These companies are also increasingly inclined toward medical device outsourcing due to a requirement of high maintenance and efficient systems for a management of raw materials, which results in minimizing an overall setup costs.
Many new companies are anticipated to venture into this space due to the increasing demand for medical devices around the globe. This is projected to boost the competition level in the global arena. In addition, collaborations among existing players and niche service offerings to boost quality are likely to fuel the market growth during the forecast period. Established players in the market are expected to broaden their portfolio and provide one-stop solutions to withstand aggressive competition. For instance, in February 2023, Labcorp has revealed that the upcoming entity resulting from the anticipated spin-off of its clinical development business is to be named Fortrea. Following the separation from Labcorp, Fortrea is set to function as an autonomous, publicly traded global Contract Research Organization (CRO), providing extensive services in drug and medical device development.
In May 2023, Emergo collaborated with the Shanghai Center for Medical Testing and Inspection (CMTC) for ongoing usability testing of medical devices in China. This collaboration was expected to ensure usability testing by following the Human Factors Engineering (HFE) guidelines outlined by China’s National Medical Products Administration (NMPA).
In September 2022, North American Science Associates, LLC' (NAMSA) and InspireMD, Inc. announced an outsourcing partnership to accelerate medical device development & commercialization.
Report Attribute |
Details |
Market size value in 2024 |
USD 142.2 billion |
Revenue forecast in 2030 |
USD 292.9 billion |
Growth rate |
CAGR of 12.8% from 2024 to 2030 |
Actual data |
2018 - 2023 |
Forecast period |
2024 - 2030 |
Quantitative units |
Revenue in USD million/billion, and CAGR from 2024 to 2030 |
Report coverage |
Revenue forecast, company ranking, competitive landscape, growth factors, and trends |
Segments covered |
Services, application, class, region |
Regional scope |
North America; Europe; Asia Pacific; Latin America; MEA |
Country scope |
U.S.; Canada; UK; Germany; France; Italy; Spain; Netherlands; Switzerland; Sweden; Belgium; Russia; Denmark; Norway; India; Japan; China; Australia; South Korea; Singapore; Indonesia; Malaysia; Thailand; Taiwan; Philippines; Brazil; Mexico; Argentina; Colombia; Chile; South Africa; Saudi Arabia; UAE; Israel; Egypt, Kuwait |
Key companies profiled |
SGS SA; Laboratory Corporation of America Holdings; Euro fins Scientific; Pace Analytical Services, Inc.; Intertek Group plc; WuXiAppTec; North American Science Associates, LLC; TÜV SÜD; Sterigenics U.S., LLC (GTCR, LLC); Charles River Laboratories; Medical Device Testing Services; RJR Consulting, Inc.; Mandala International.; Freyr; Global Regulatory Partners; PAREXEL International Corporation (EQT Private Equity and Goldman Sachs Asset Management); Emergo (UL LLC); Bioteknica; Accell Clinical Research, LLC; Genpact.; Criterium, Inc.; ; Promedica International; Med pace; ICON plc.; IQVIA Inc.; Integer Holdings Corporation; Tecomet Inc. (Charlesbank Capital Partners, LLC); Jabil Inc.; FLEX LTD.; Celestica Inc.; Sanmina Corporation.; Plexus Corp.; Phillips Medisize (Molex, LLC); Cantel Medical Corp. (STERIS plc); West Pharmaceutical Services, Inc. |
Customization scope |
Free report customization (equivalent up to 8 analysts working days) with purchase. Addition or alteration to country, regional & segment scope. |
Pricing and purchase options |
Avail customized purchase options to meet your exact research needs. Explore purchase options |
This report forecasts revenue growth and provides an analysis of the latest trends in each of the sub-segments from 2018 to 2030. For this study, Grand View Research has segmented the global medical device outsourcing market Report based on service, application, class, and region:
Service Outlook (Revenue, USD Million, 2018 - 2030)
Quality Assurance
Regulatory Affairs Services
Clinical Trials Applications And Product Registrations
Regulatory Writing And Publishing
Legal Representation
Other
Product Design and Development Services
Designing & Engineering
Machining
Molding
Packaging
Product Testing & Sterilization Services
Product Implementation Services
Product Upgrade Services
Product Maintenance Services
Contract Manufacturing
Accessories Manufacturing
Assembly Manufacturing
Component Manufacturing
Device Manufacturing
Application Outlook (Revenue, USD Million, 2018 - 2030)
Cardiology
Class I
Class II
Class III
Diagnostic imaging
Class I
Class II
Class III
Orthopedic
Class I
Class II
Class III
IVD
Class I
Class II
Class III
Ophthalmic
Class I
Class II
Class III
General and Plastic Surgery
Class I
Class II
Class III
Drug Delivery
Class I
Class II
Class III
Dental
Class I
Class II
Class III
Endoscopy
Class I
Class II
Class III
Diabetes Care
Class I
Class II
Class III
Others
Class I
Class II
Class III
Class Outlook (Revenue, USD Million, 2018 - 2030)
Class I
Class II
Class III
Regional Outlook (Revenue, USD Million, 2018- 2030)
North America
U.S.
Canada
Europe
UK
Germany
France
Italy
Spain
Switzerland
Netherlands
Sweden
Belgium
Russia
Denmark
Norway
Asia Pacific
Japan
China
India
Australia
South Korea
Singapore
Malaysia
Thailand
Taiwan
Indonesia
Philippines
Latin America
Brazil
Mexico
Argentina
Colombia
Chile
Middle East and Africa (MEA)
South Africa
Saudi Arabia
UAE
Egypt
Israel
Kuwait
b. The global medical device outsourcing market size was estimated at USD 117.5 billion in 2022 and is expected to reach USD 128.8 billion in 2023.
b. The global medical device outsourcing market is expected to grow at a compound annual growth rate of 12.1% from 2023 to 2030 to reach USD 292.93 billion by 2030.
b. The Asia Pacific dominated the medical device outsourcing market with a share of 41.7% in 2022. This is attributable to increasing R&D in this region, increasing the adoption of new technology in medical devices, increasing availability of skilled human resources, and lower cost of devices.
b. Some of the players operating in the medical device outsourcing market are SGS SA; Toxikon, INC.; Eurofins Scientific; Pace Analytical Services LLC.; Intertek Group PLC; Wuxi Apptec; North American Science Associates, Inc.; Tüv Süd AG; American Preclinical Services; Sterigenics International LLC; Charles River Laboratories International, Inc.
b. Key factors that are driving the medical device outsourcing market growth include changing regulatory landscape, increase in offshoring medical device manufacturing to emerging countries, and rising demand for advanced products.
Table of Contents
Chapter 1 Methodology and Scope
1.1 Market Segmentation and Scope
1.1.1 Regional Scope
1.1.2 Estimates And Forecast Timeline
1.2 Market Definition
1.3 Research Methodology
1.4 Information Procurement
1.4.1 Information Analysis
1.4.2 Market Formulation & Data Visualization
1.4.3 Data Validation & Publishing
1.5 Research Scope And Assumptions
1.5.1 Commodity Flow Analysis
1.5.2 Top Down Market Estimation
1.5.3 Region/Country Based Segment Share Calculation
1.5.4 Multivariate Analysis
1.5.5 Medical Device Outsourcing Market: Cagr Calculation
1.6 List of Secondary Sources
1.7 Objectives
1.7.1 Objective - 1:
1.7.2 Objective - 2:
1.7.3 Objective - 3:
1.7.4 Objective - 4:
1.7.4.1 Data For Primary Interviews In North America
1.7.4.2 Data For Primary Interviews In Europe
1.7.4.3 Data For Primary Interviews In Asia Pacific
1.7.4.4 Data For Primary Interviews In Latin America
1.7.4.5 Data For Primary Interviews In Mea
Chapter 2 Executive Summary
2.1 Market Snapshot
2.2 Segment Snapshot
2.3 Competitive Landscape Snapshot
2.3.1 Business Segment Trends
2.3.2 Service Business Analysis
2.3.3 Application Business Analysis
2.3.4 Class Type Business Analysis
2.3.5 Regional Business Analysis
Chapter 3 Medical Device Outsourcing Market: Variables, Trends, & Scope
3.1 Market Lineage Outlook
3.1.1 Parent Market Outlook
3.1.2 Ancillary Market Outlook
3.2 Market Dynamics
3.2.1 Market Driver Impact Analysis
3.2.1.1 Changing Regulatory Landscape
3.2.1.2 Increase In Off-Shoring Medical Device Manufacturing To The Emerging Economies
3.2.1.3 Rising Demand For The Advanced Products
3.2.1.4 Implementation Of The International Standards By The Contract Manufacturers
3.2.1.5 Rising Price Competition And The Requirement To Reduce Cost
3.2.1.6 Increasing Complexity With Respect To Product Design And Engineering
3.2.2 Market Restraint Analysis
3.2.2.1 Compliance Issues While Outsourcing
3.2.2.2 Changing Scenarios Within Developing Countries
3.2.2.3 Regulatory And Legal Compliance
3.2.2.4 Contractual Obligation
3.2.3 Industry Challenges
3.2.3.1 Managing Relationships
3.3 Medical Device Outsourcing Market: Analysis Tools
3.3.1 Porter’s Five Forces Analysis
3.3.2 Macroeconomic Analysis
3.4 Impact Of Covid-19 On Medical Devices Outsourcing Market
3.5 Impact On Regulations
3.6 Post-Covid-19 Market Scenario
Chapter 4 Medical Device Outsourcing Market: Services Segment Estimates & Trend Analysis
4.1 Medical Device Outsourcing Market By Services Segment: Key Takeaways
4.2 Service Segment Movement Analysis & Market Share, 2023 & 2030
4.3 Medical Device Outsourcing Market Estimates & Forecast, By Service (USD Million)
4.4 Quality Assurance
4.4.1 Quality Assurance Services Market, 2018 - 2030 (USD Million)
4.5 Regulatory Affairs Services
4.5.1 Regulatory Affairs Services Market, 2018 - 2030 (USD Million)
4.5.2 Clinical Trial Application And Product Registration
4.5.2.1 Clinical Trial Application And Product Registration Market, 2018 - 2030 (USD Million)
4.5.3 Regulatory Writing And Publishing
4.5.3.1 Regulatory Writing And Publishing Market, 2018 - 2030 (USD Million)
4.5.4 Legal Representation
4.5.4.1 Legal Representation Market, 2018 - 2030 (USD Million)
4.5.5 Others
4.5.5.1 Others Market, 2018 - 2030 (USD Million)
4.6 Product Design And Development
4.6.1 Product Design And Development Services Market, 2018 - 2030 (USD Million)
4.6.2 Designing And Engineering
4.6.2.1 Designing And Engineering Market, 2018 - 2030 (USD Million)
4.6.3 Machining
4.6.3.1 Machining Market, 2018 - 2030 (USD Million)
4.6.4 Molding
4.6.4.1 Molding Market, 2018 - 2030 (USD Million)
4.6.5 Packaging
4.6.5.1 Packaging Market, 2018 - 2030 (USD Million)
4.7 Product Testing And Sterilization
4.7.1 Product Testing And Sterilization Market, 2018 - 2030 (USD Million)
4.8 Product Implementation
4.8.1 Product Implementation Market, 2018 - 2030 (USD Million)
4.9 Product Upgrade
4.9.1 Product Upgrade Services Market, 2018 - 2030 (USD Million)
4.10 Product Maintenance
4.10.1 Product Maintenance Services Market, 2018 - 2030 (USD Million)
4.11 Contract Manufacturing
4.11.1 Contract Manufacturing Market, 2018 - 2030 (USD Million)
4.11.2 Accessories Manufacturing
4.11.2.1 Accessories Manufacturing Market, 2018 - 2030 (USD Million)
4.11.3 Assembly Manufacturing
4.11.3.1 Assembly Manufacturing Market, 2018 - 2030 (USD Million)
4.11.4 Component Manufacturing
4.11.4.1 Component Manufacturing Market, 2018 - 2030 (USD Million)
4.11.5 Device Manufacturing
4.11.5.1 Device Manufacturing Market, 2018 - 2030 (USD Million)
Chapter 5 Medical Device Outsourcing Market: Application Estimates & Trend Analysis
5.1 Medical Device Outsourcing Market by Application: Key Takeaways
5.2 Application Movement Analysis & Market Share, 2023 & 2030
5.3 Medical Device Outsourcing Market Estimates & Forecast, By Application (USD Million)
5.4 Cardiology
5.4.1 Cardiology Market, 2018 - 2030 (USD Million)
5.5 Diagnostic Imaging
5.5.1 Diagnostic Imaging Market, 2018 - 2030 (USD Million)
5.6 Orthopedic
5.6.1 Orthopedic Market, 2018 - 2030 (USD Million)
5.7 Ivd
5.7.1 Ivd Market, 2018 - 2030 (USD Million)
5.8 Ophthalmic
5.8.1 Ophthalmic Market, 2018 - 2030 (USD Million)
5.9 General & Plastic Surgery
5.9.1 General & Plastic Surgery Market, 2018 - 2030 (USD Million)
5.10 Drug Delivery
5.10.1 Drug Delivery Market, 2018 - 2030 (USD Million)
5.10.2 Prefilled Syringe
5.10.2.1 Prefilled Syringe Market, 2018 - 2030 (USD Million)
5.10.3 Auto-Injectors
5.10.3.1 Auto-Injector Market, 2018 - 2030 (USD Million)
5.10.4 Infusion Pump
5.10.4.1 Infusion Pumps Market, 2018 - 2030 (USD Million)
5.10.5 Others
5.10.5.1 Others Market, 2018 - 2030 (USD Million)
5.11 Dental
5.11.1 Dental Market, 2018 - 2030 (USD Million)
5.12 Endoscopy
5.12.1 Endoscopy Market, 2018 - 2030 (USD Million)
5.13 Diabetes Care
5.13.1 Diabetes Care Market, 2018 - 2030 (USD Million)
5.14 Others
5.14.1 Others Market, 2018 - 2030 (USD Million)
Chapter 6 Medical Device Outsourcing Market: Class Type Estimates & Trend Analysis
6.1 Medical Device Outsourcing Market by Class Type: Key Takeaways
6.2 Class Type Movement Analysis & Market Share, 2023 & 2030
6.3 Medical Device Outsourcing Market Estimates & Forecast, By Class Type (USD Million)
6.4 Class I
6.4.1 CLASS I Market, 2018 - 2030 (USD MILLION)
6.5 Class II
6.5.1 CLASS II Market, 2018 - 2030 (USD MILLION)
6.6 Class III
6.6.1 CLASS III Market, 2018 - 2030 (USD MILLION).
Chapter 7 Medical Device Outsourcing Market: Regional Estimates and Trend Analysis, by Service, Class, and Application
7.1 Medical Device Outsourcing Market: Regional Outlook
7.2 North America
7.2.1 North America Medical Device Outsourcing Market Estimates And Forecasts, 2018 - 2030 (USD Million)
7.2.2 U.S.
7.2.2.1 Key Country Dynamics
7.2.2.2 Competitive Scenario
7.2.2.3 Regulatory Framework
7.2.2.4 U.S. Medical Device Outsourcing Market Estimates And Forecasts, 2018 - 2030 (USD Million)
7.2.3 Canada
7.2.3.1 Key Country Dynamics
7.2.3.2 Competitive Scenario
7.2.3.3 Regulatory Framework
7.2.3.4 Canada Medical Device Outsourcing Market Estimates And Forecasts, 2018 - 2030 (USD Million)
7.3 Europe
7.3.1 Europe Medical Device Outsourcing Market Estimates And Forecasts, 2018 - 2030 (USD Million)
7.3.2 France
7.3.2.1 Key Country Dynamics
7.3.2.2 Competitive Scenario
7.3.2.3 Regulatory Framework
7.3.2.4 Device Classification
7.3.2.5 France Medical Device Outsourcing Market Estimates And Forecasts, 2018 - 2030 (USD Million)
7.3.3 Germany
7.3.3.1 Key Country Dynamics
7.3.3.2 Competitive Scenario
7.3.3.3 Regulatory Framework
7.3.3.4 Germany Medical Device Outsourcing Market Estimates And Forecasts, 2018 - 2030 (USD Million)
7.3.4 Uk
7.3.4.1 Key Country Dynamics
7.3.4.2 Competitive Scenario
7.3.4.3 Regulatory Framework
7.3.4.4 Uk Medical Device Outsourcing Market Estimates And Forecasts, 2018 - 2030 (USD Million)
7.3.5 Italy
7.3.5.1 Key Country Dynamics
7.3.5.2 Competitive Scenario
7.3.5.3 Regulatory Framework
7.3.5.4 Italy Medical Device Outsourcing Market Estimates And Forecasts, 2018 - 2030 (USD Million)
7.3.6 Spain
7.3.6.1 Key Country Dynamics
7.3.6.2 Competitive Scenario
7.3.6.3 Regulatory Framework
7.3.6.4 Spain Medical Device Outsourcing Market Estimates And Forecasts, 2018 - 2030 (USD Million)
7.3.7 Netherlands
7.3.7.1 Key Country Dynamics
7.3.7.2 Competitive Scenario
7.3.7.3 Regulatory Framework
7.3.7.4 Netherlands Medical Device Outsourcing Market Estimates And Forecasts, 2018 - 2030 (USD Million)
7.3.8 Switzerland
7.3.8.1 Key Country Dynamics
7.3.8.2 Competitive Scenario
7.3.8.3 Regulatory Framework
7.3.8.4 Switzerland Medical Device Outsourcing Market Estimates And Forecasts, 2018 - 2030 (USD Million)
7.3.9 Sweden
7.3.9.1 Key Country Dynamics
7.3.9.2 Competitive Scenario
7.3.9.3 Regulatory Framework
7.3.9.4 Sweden Medical Device Outsourcing Market Estimates And Forecasts, 2018 - 2030 (USD Million)
7.3.10 Belgium
7.3.10.1 Key Country Dynamics
7.3.10.2 Competitive Scenario
7.3.10.3 Regulatory Framework
7.3.10.4 Belgium Medical Device Outsourcing Market Estimates And Forecasts, 2018 - 2030 (USD Million)
7.3.11 Russia
7.3.11.1 Key Country Dynamics
7.3.11.2 Competitive Scenario
7.3.11.3 Regulatory Framework
7.3.11.4 Russia Medical Device Outsourcing Market Estimates And Forecasts, 2018 - 2030 (USD Million)
7.3.12 Denmark
7.3.12.1 Key Country Dynamics
7.3.12.2 Competitive Scenario
7.3.12.3 Regulatory Framework
7.3.12.4 Denmark Medical Device Outsourcing Market Estimates And Forecasts, 2018 - 2030 (USD Million)
7.3.13 Norway
7.3.13.1 Key Country Dynamics
7.3.13.2 Competitive Scenario
7.3.13.3 Regulatory Framework
7.3.13.4 Norway Medical Device Outsourcing Market Estimates And Forecasts, 2018 - 2030 (USD Million)
7.4 Asia Pacific
7.4.1 Asia Pacific Medical Device Outsourcing Market Estimates And Forecasts, 2018 - 2030 (USD Million)
7.4.2 Japan
7.4.2.1 Key Country Dynamics
7.4.2.2 Competitive Scenario
7.4.2.3 Regulatory Framework
7.4.2.4 Japan Medical Device Outsourcing Market estimates and forecasts, 2018 - 2030 (USD Million)
7.4.3 China
7.4.3.1 Key Country Dynamics
7.4.3.2 Competitive Scenario
7.4.3.3 Regulatory Framework
7.4.3.4 China Medical Device Outsourcing Market Estimates And Forecasts, 2018 - 2030 (USD Million)
7.4.4 India
7.4.4.1 Key Country Dynamics
7.4.4.2 Competitive Scenario
7.4.4.3 Regulatory Framework
7.4.4.4 India Medical Device Outsourcing Market Estimates And Forecasts, 2018 - 2030 (USD Million)
7.4.5 Australia
7.4.5.1 Key Country Dynamics
7.4.5.2 Competitive Scenario
7.4.5.3 Regulatory Framework
7.4.5.4 Australia Medical Device Outsourcing Market Estimates And Forecasts, 2018 - 2030 (USD Million)
7.4.6 South Korea
7.4.6.1 Key Country Dynamics
7.4.6.2 Competitive Scenario
7.4.6.3 Regulatory Framework
7.4.6.4 South Korea Medical Device Outsourcing Market Estimates And Forecasts, 2018 - 2030 (USD Million)
7.4.7 Singapore
7.4.7.1 Key Country Dynamics
7.4.7.2 Competitive Scenario
7.4.7.3 Regulatory Framework
7.4.7.4 Singapore Medical Device Outsourcing Market Estimates And Forecasts, 2018 - 2030 (USD Million)
7.4.8 Indonesia
7.4.8.1 Key Country Dynamics
7.4.8.2 Competitive Scenario
7.4.8.3 Regulatory Framework
7.4.8.4 Indonesia Medical Device Outsourcing Market Estimates And Forecasts, 2018 - 2030 (USD Million)
7.4.9 Malaysia
7.4.9.1 Key Country Dynamics
7.4.9.2 Competitive Scenario
7.4.9.3 Regulatory Framework
7.4.9.4 Malaysia Medical Device Outsourcing Market Estimates And Forecasts, 2018 - 2030 (USD Million)
7.4.10 Taiwan
7.4.10.1 Key Country Dynamics
7.4.10.2 Competitive Scenario
7.4.10.3 Regulatory Framework
7.4.10.4 Taiwan Medical Device Outsourcing Market Estimates And Forecasts, 2018 - 2030 (USD Million)
7.4.11 Thailand
7.4.11.1 Key Country Dynamics
7.4.11.2 Competitive Scenario
7.4.11.3 Regulatory Framework
7.4.11.4 Thailand Medical Device Outsourcing Market Estimates And Forecasts, 2018 - 2030 (USD Million)
7.4.12 Philippines
7.4.12.1 Key Country Dynamics
7.4.12.2 Competitive Scenario
7.4.12.3 Regulatory Framework
7.4.12.4 Philippines Medical Device Outsourcing Market Estimates And Forecasts, 2018 - 2030 (USD Million)
7.5 Latin America
7.6 Latin America Medical Device Outsourcing Market Estimates And Forecasts, 2018 - 2030 (USD Million)
7.6.1 Brazil
7.6.1.1 Key Country Dynamics
7.6.1.2 Competitive Scenario
7.6.1.3 Regulatory Framework
7.6.1.4 Brazil Medical Device Outsourcing Market Estimates And Forecasts, 2018 - 2030 (USD Million)
7.6.2 Mexico
7.6.2.1 Key Country Dynamics
7.6.2.2 Competitive Scenario
7.6.2.3 Regulatory Framework
7.6.2.4 Mexico Medical Device Outsourcing Market Estimates And Forecasts, 2018 - 2030 (USD Million)
7.6.3 Argentina
7.6.3.1 Key Country Dynamics
7.6.3.2 Competitive Scenario
7.6.3.3 Regulatory Framework
7.6.3.4 Argentina Medical Device Outsourcing Market Estimates And Forecasts, 2018 - 2030 (USD Million)
7.6.4 Colombia
7.6.4.1 Key Country Dynamics
7.6.4.2 Competitive Scenario
7.6.4.3 Regulatory Framework
7.6.4.4 Colombia Medical Device Outsourcing Market estimates and forecasts, 2018 - 2030 (USD Million)
7.6.5 Chile
7.6.5.1 Key Country Dynamics
7.6.5.2 Competitive Scenario
7.6.5.3 Regulatory Framework
7.6.5.4 Chile Medical Device Outsourcing Market estimates and forecasts, 2018 - 2030 (USD Million)
7.7 MEA
7.7.1 MEA Medical Device Outsourcing Market Estimates And Forecasts, 2018 - 2030 (USD Million)
7.7.2 South Africa
7.7.2.1 Key Country Dynamics
7.7.2.2 Competitive Scenario
7.7.2.3 Regulatory Framework
7.7.2.4 South Africa Medical Device Outsourcing Market Estimates And Forecasts, 2018 - 2030 (USD Million)
7.7.3 Saudi Arabia
7.7.3.1 Key Country Dynamics
7.7.3.2 Competitive Scenario
7.7.3.3 Regulatory Framework
7.7.3.4 Saudi Arabia Medical Device Outsourcing Market estimates and forecasts, 2018 - 2030 (USD Million)
7.7.4 UAE
7.7.4.1 Key Country Dynamics
7.7.4.2 Competitive Scenario
7.7.4.3 Regulatory Framework
7.7.4.4 UAE Medical Device Outsourcing Market estimates and forecasts, 2018 - 2030 (USD Million)
7.7.5 Israel
7.7.5.1 Key Country Dynamics
7.7.5.2 Competitive Scenario
7.7.5.3 Regulatory Framework
7.7.5.4 Israel Medical Device Outsourcing Market Estimates And Forecasts, 2018 - 2030 (USD Million)
7.7.6 Egypt
7.7.6.1 Key Country Dynamics
7.7.6.2 Competitive Scenario
7.7.6.3 Regulatory Framework
7.7.6.4 Egypt Medical Device Outsourcing Market Estimates And Forecasts, 2018 - 2030 (USD Million)
7.7.7 Kuwait
7.7.7.1 Key Country Dynamics
7.7.7.2 Competitive Scenario
7.7.7.3 Regulatory Framework
7.7.7.4 Kuwait Medical Device Outsourcing Market estimates and forecasts, 2018 - 2030 (USD Million)
Chapter 8 Competitive Landscape
8.1 Participant Categorization
8.1.1 Innovators
8.1.1.1 Leading Market Players Anticipated To Witness Highest Growth
8.1.2 Market Leaders
8.1.2.1 Medical Device Outsourcing Market Share Analysis, 2021
8.1.3 Strategy Mapping
8.1.3.1 Expansion
8.1.3.2 Acquisition
8.1.3.3 Collaborations
8.1.3.4 Product/Service Launch
8.1.3.5 Partnerships
8.1.3.6 Others
Chapter 9 Competitive Landscape
9.1 Participant’s Overview
9.2 Financial Performance
9.3.Product Benchmarking
9.4 Strategy Initiatives
9.5 Key Companies
9.5.1. SGS SA
9.5.1.1. Overview
9.5.1.2. Financial Performance
9.5.1.3. Product Benchmarking
9.5.1.4. Strategic Initiatives
9.5.2. Laboratory Corporation of America Holdings
9.5.2.1. Overview
9.5.2.2. Financial Performance
9.5.2.3. Product Benchmarking
9.5.2.4. Strategic Initiatives
9.5.3. Euro fins Scientific
9.5.3.1. Overview
9.5.3.2. Financial Performance
9.5.3.3. Product Benchmarking
9.5.3.4. Strategic Initiatives
9.5.4. Pace Analytical Services, Inc.
9.5.4.1. Overview
9.5.4.2. Financial Performance
9.5.4.3. Product Benchmarking
9.5.4.4. Strategic Initiatives
9.5.5. Intertek Group plc
9.5.5.1. Overview
9.5.5.2. Financial Performance
9.5.5.3. Product Benchmarking
9.5.5.4. Strategic Initiatives
9.5.6. WuXiAppTec
9.5.6.1. Overview
9.5.6.2. Financial Performance
9.5.6.3. Product Benchmarking
9.5.6.4. Strategic Initiatives
9.5.7. North American Science Associates, LLC
9.5.7.1. Overview
9.5.7.2. Financial Performance
9.5.7.3. Product Benchmarking
9.5.7.4. Strategic Initiatives
9.5.8. TÜV SÜD
9.5.8.1. Overview
9.5.8.2. Financial Performance
9.5.8.3. Product Benchmarking
9.5.8.4. Strategic Initiatives
9.5.9. Sterigenics U.S., LLC (GTCR, LLC)
9.5.9.1. Overview
9.5.9.2. Financial Performance
9.5.9.3. Product Benchmarking
9.5.9.4. Strategic Initiatives
9.5.10. Charles River Laboratories
9.5.10.1. Overview
9.5.10.2. Financial Performance
9.5.10.3. Product Benchmarking
9.5.10.4. Strategic Initiatives
9.5.11. Medical Device Testing Services (Element Minnetonka)
9.5.11.1. Overview
9.5.11.2. Financial Performance
9.5.11.3. Product Benchmarking
9.5.11.4. Strategic Initiatives
9.5.12. RJR Consulting, Inc.
9.5.12.1. Overview
9.5.12.2. Financial Performance
9.5.12.3. Product Benchmarking
9.5.12.4. Strategic Initiatives
9.5.13. Mandala International
9.5.13.1. Overview
9.5.13.2. Financial Performance
9.5.13.3. Product Benchmarking
9.5.13.4. Strategic Initiatives
9.5.14. Freyr
9.5.14.1. Overview
9.5.14.2. Financial Performance
9.5.14.3. Product Benchmarking
9.5.14.4. Strategic Initiatives
9.5.15. Global Regulatory Partners
9.5.15.1. Overview
9.5.15.2. Financial Performance
9.5.15.3. Product Benchmarking
9.5.15.4. Strategic Initiatives
9.5.16. PAREXEL International Corporation
9.5.16.1. Overview
9.5.16.2. Financial Performance
9.5.16.3. Product Benchmarking
9.5.16.4. Strategic Initiatives
9.5.17. Emergo (UL LLC)
9.5.17.1. Overview
9.5.17.2. Financial Performance
9.5.17.3. Product Benchmarking
9.5.17.4. Strategic Initiatives
9.5.18. Bioteknica
9.5.18.1. Overview
9.5.18.2. Financial Performance
9.5.18.3. Product Benchmarking
9.5.18.4. Strategic Initiatives
9.5.19. Accell Clinical Research, LLC
9.5.19.1. Overview
9.5.19.2. Financial Performance
9.5.19.3. Product Benchmarking
9.5.19.4. Strategic Initiatives
9.5.20. Genpact
9.5.20.1. Overview
9.5.20.2. Financial Performance
9.5.20.3. Product Benchmarking
9.5.20.4. Strategic Initiatives
9.5.21. Criterium, Inc.
9.5.21.1. Overview
9.5.21.2. Financial Performance
9.5.21.3. Product Benchmarking
9.5.21.4. Strategic Initiatives
9.5.22. Promedica International
9.5.22.1. Overview
9.5.22.2. Financial Performance
9.5.22.3. Product Benchmarking
9.5.22.4. Strategic Initiatives
9.5.23. Med pace
9.5.23.1. Overview
9.5.23.2. Financial Performance
9.5.23.3. Product Benchmarking
9.5.23.4. Strategic Initiatives
9.5.24. ICON plc.
9.5.24.1. Overview
9.5.24.2. Financial Performance
9.5.24.3. Product Benchmarking
9.5.24.4. Strategic Initiatives
9.5.25. IQVIA Inc.
9.5.25.1. Overview
9.5.25.2. Financial Performance
9.5.25.3. Product Benchmarking
9.5.25.4. Strategic Initiatives
9.5.26. Integer Holdings Corporation
9.5.26.1. Overview
9.5.26.2. Financial Performance
9.5.26.3. Product Benchmarking
9.5.26.4. Strategic Initiatives
9.5.27. Tecomet Inc.
9.5.27.1. Overview
9.5.27.2. Financial Performance
9.5.27.3. Product Benchmarking
9.5.27.4. Strategic Initiatives
9.5.28. Jabil Inc.
9.5.28.1. Overview
9.5.28.2. Financial Performance
9.5.28.3. Product Benchmarking
9.5.28.4. Strategic Initiatives
9.5.29. FLEX LTD.
9.5.29.1. Overview
9.5.29.2. Financial Performance
9.5.29.3. Product Benchmarking
9.5.29.4. Strategic Initiatives
9.5.30. Celestica Inc.
9.5.30.1. Overview
9.5.30.2. Financial Performance
9.5.30.3. Product Benchmarking
9.5.30.4. Strategic Initiatives
9.5.31. Sanmina Corporation
9.5.31.1. Overview
9.5.31.2. Financial Performance
9.5.31.3. Product Benchmarking
9.5.31.4. Strategic Initiatives
9.5.32. Plexus Corp.
9.5.32.1. Overview
9.5.32.2. Financial Performance
9.5.32.3. Product Benchmarking
9.5.32.4. Strategic Initiatives
9.5.33. Phillips Medisize (Molex, LLC)
9.5.33.1. Overview
9.5.33.2. Financial Performance
9.5.33.3. Product Benchmarking
9.5.33.4. Strategic Initiatives
9.5.34. Cantel Medical Corp. (STERIS plc)
9.5.34.1. Overview
9.5.34.2. Financial Performance
9.5.34.3. Product Benchmarking
9.5.34.4. Strategic Initiatives
9.5.35. West Pharmaceutical Services, Inc.
9.5.35.1. Overview
9.5.35.2. Financial Performance
9.5.35.3. Product Benchmarking
9.5.35.4. Strategic Initiatives
List of Tables
Table 1 List of Secondary Sources
Table 2 List of Abbreviations
Table 3 Global Medical Device Outsourcing Market by Service, 2018 - 2030 (USD Million)
Table 4 Global Medical Device Outsourcing Market by Class Type, 2018 - 2030 (USD Million)
Table 5 Global Medical Device Outsourcing Market by Application, 2018 - 2030 (USD Million)
Table 6 Global Medical Device Outsourcing Market by Region, 2018 - 2030 (USD Million)
Table 7 North America Medical Device Outsourcing Market by Country, 2018 - 2030 (USD Million)
Table 8 North America Medical Device Outsourcing Market by Service, 2018 - 2030 (USD Million)
Table 9 North America Medical Device Outsourcing Market by Class Type, 2018 - 2030 (USD Million)
Table 10 North America Medical Device Outsourcing Market by Application, 2018 - 2030 (USD Million)
Table 11 U.S. Medical Device Outsourcing Market by Service, 2018 - 2030 (USD Million)
Table 12 U.S. Medical Device Outsourcing Market by Class Type, 2018 - 2030 (USD Million)
Table 13 U.S. Medical Device Outsourcing Market by Application, 2018 - 2030 (USD Million)
Table 14 Canada Medical Device Outsourcing Market by Service, 2018 - 2030 (USD Million)
Table 15 Canada Medical Device Outsourcing Market by Class Type, 2018 - 2030 (USD Million)
Table 16 Canada Medical Device Outsourcing Market by Application, 2018 - 2030 (USD Million)
Table 17 Europe Medical Device Outsourcing Market by Country, 2018 - 2030 (USD Million)
Table 18 Europe Medical Device Outsourcing Market by Service, 2018 - 2030 (USD Million)
Table 19 Europe Medical Device Outsourcing Market by Class Type, 2018 - 2030 (USD Million)
Table 20 Europe Medical Device Outsourcing Market by Application, 2018 - 2030 (USD Million)
Table 21 Germany Medical Device Outsourcing Market by Service, 2018 - 2030 (USD Million)
Table 22 Germany Medical Device Outsourcing Market by Class Type, 2018 - 2030 (USD Million)
Table 23 Germany Medical Device Outsourcing Market by Application, 2018 - 2030 (USD Million)
Table 24 UK Medical Device Outsourcing Market by Service, 2018 - 2030 (USD Million)
Table 25 UK Medical Device Outsourcing Market by Class Type, 2018 - 2030 (USD Million)
Table 26 UK Medical Device Outsourcing Market by Application, 2018 - 2030 (USD Million)
Table 27 France Medical Device Outsourcing Market by Service, 2018 - 2030 (USD Million)
Table 28 France Medical Device Outsourcing Market by Class Type, 2018 - 2030 (USD Million)
Table 29 France Medical Device Outsourcing Market by Application, 2018 - 2030 (USD Million)
Table 30 Italy Medical Device Outsourcing Market by Service, 2018 - 2030 (USD Million)
Table 31 Italy Medical Device Outsourcing Market by Class Type, 2018 - 2030 (USD Million)
Table 32 Italy Medical Device Outsourcing Market by Application, 2018 - 2030 (USD Million)
Table 33 Spain Medical Device Outsourcing Market by Service, 2018 - 2030 (USD Million)
Table 34 Spain Medical Device Outsourcing Market by Class Type, 2018 - 2030 (USD Million)
Table 35 Spain Medical Device Outsourcing Market by Application, 2018 - 2030 (USD Million)
Table 36 Belgium Medical Device Outsourcing Market by Service, 2018 - 2030 (USD Million)
Table 37 Belgium Medical Device Outsourcing Market by Class Type, 2018 - 2030 (USD Million)
Table 38 Belgium Medical Device Outsourcing Market by Application, 2018 - 2030 (USD Million)
Table 39 Sweden Medical Device Outsourcing Market by Service, 2018 - 2030 (USD Million)
Table 40 Sweden Medical Device Outsourcing Market by Class Type, 2018 - 2030 (USD Million)
Table 41 Sweden Medical Device Outsourcing Market by Application, 2018 - 2030 (USD Million)
Table 42 Russia Medical Device Outsourcing Market by Service, 2018 - 2030 (USD Million)
Table 43 Russia Medical Device Outsourcing Market by Class Type, 2018 - 2030 (USD Million)
Table 44 Russia Medical Device Outsourcing Market by Application, 2018 - 2030 (USD Million)
Table 45 Netherlands Medical Device Outsourcing Market by Service, 2018 - 2030 (USD Million)
Table 46 Netherlands Medical Device Outsourcing Market by Class Type, 2018 - 2030 (USD Million)
Table 47 Netherlands Medical Device Outsourcing Market by Application, 2018 - 2030 (USD Million)
Table 48 Switzerland Medical Device Outsourcing Market by Service, 2018 - 2030 (USD Million)
Table 49 Switzerland Medical Device Outsourcing Market by Class Type, 2018 - 2030 (USD Million)
Table 50 Switzerland Medical Device Outsourcing Market by Application, 2018 - 2030 (USD Million)
Table 51 Denmark Medical Device Outsourcing Market by Service, 2018 - 2030 (USD Million)
Table 52 Denmark Medical Device Outsourcing Market by Class Type, 2018 - 2030 (USD Million)
Table 53 Denmark Medical Device Outsourcing Market by Application, 2018 - 2030 (USD Million)
Table 54 Norway Medical Device Outsourcing Market by Service, 2018 - 2030 (USD Million)
Table 55 Norway Medical Device Outsourcing Market by Class Type, 2018 - 2030 (USD Million)
Table 56 Norway Medical Device Outsourcing Market by Application, 2018 - 2030 (USD Million)
Table 57 Asia Pacific Medical Device Outsourcing Market by Country, 2018 - 2030 (USD Million)
Table 58 Asia Pacific Medical Device Outsourcing Market by Service, 2018 - 2030 (USD Million)
Table 59 Asia Pacific Medical Device Outsourcing Market by Class Type, 2018 - 2030 (USD Million)
Table 60 Asia Pacific Medical Device Outsourcing Market by Application, 2018 - 2030 (USD Million)
Table 61 China Medical Device Outsourcing Market by Service, 2018 - 2030 (USD Million)
Table 62 China Medical Device Outsourcing Market by Class Type, 2018 - 2030 (USD Million)
Table 63 China Medical Device Outsourcing Market by Application, 2018 - 2030 (USD Million)
Table 64 Japan Medical Device Outsourcing Market by Service, 2018 - 2030 (USD Million)
Table 65 Japan Medical Device Outsourcing Market by Class Type, 2018 - 2030 (USD Million)
Table 66 Japan Medical Device Outsourcing Market by Application, 2018 - 2030 (USD Million)
Table 67 India Medical Device Outsourcing Market by Service, 2018 - 2030 (USD Million)
Table 68 India Medical Device Outsourcing Market by Class Type, 2018 - 2030 (USD Million)
Table 69 India Medical Device Outsourcing Market by Application, 2018 - 2030 (USD Million)
Table 70 South Korea Medical Device Outsourcing Market by Service, 2018 - 2030 (USD Million)
Table 71 South Korea Medical Device Outsourcing Market by Class Type, 2018 - 2030 (USD Million)
Table 72 South Korea Medical Device Outsourcing Market by Application, 2018 - 2030 (USD Million)
Table 73 Australia Medical Device Outsourcing Market by Service, 2018 - 2030 (USD Million)
Table 74 Australia Medical Device Outsourcing Market by Class Type, 2018 - 2030 (USD Million)
Table 75 Australia Medical Device Outsourcing Market by Application, 2018 - 2030 (USD Million)
Table 76 Thailand Medical Device Outsourcing Market by Service, 2018 - 2030 (USD Million)
Table 77 Thailand Medical Device Outsourcing Market by Class Type, 2018 - 2030 (USD Million)
Table 78 Thailand Medical Device Outsourcing Market by Application, 2018 - 2030 (USD Million)
Table 79 Indonesia Medical Device Outsourcing Market by Service, 2018 - 2030 (USD Million)
Table 80 Indonesia Medical Device Outsourcing Market by Class Type, 2018 - 2030 (USD Million)
Table 81 Indonesia Medical Device Outsourcing Market by Application, 2018 - 2030 (USD Million)
Table 82 Malaysia Medical Device Outsourcing Market by Service, 2018 - 2030 (USD Million)
Table 83 Malaysia Medical Device Outsourcing Market by Class Type, 2018 - 2030 (USD Million)
Table 84 Malaysia Medical Device Outsourcing Market by Application, 2018 - 2030 (USD Million)
Table 85 Singapore Medical Device Outsourcing Market by Service, 2018 - 2030 (USD Million)
Table 86 Singapore Medical Device Outsourcing Market by Class Type, 2018 - 2030 (USD Million)
Table 87 Singapore Medical Device Outsourcing Market by Application, 2018 - 2030 (USD Million)
Table 88 Taiwan Medical Device Outsourcing Market by Service, 2018 - 2030 (USD Million)
Table 89 Taiwan Medical Device Outsourcing Market by Class Type, 2018 - 2030 (USD Million)
Table 90 Taiwan Medical Device Outsourcing Market by Application, 2018 - 2030 (USD Million)
Table 91 Singapore Medical Device Outsourcing Market by Service, 2018 - 2030 (USD Million)
Table 92 Singapore Medical Device Outsourcing Market by Class Type, 2018 - 2030 (USD Million)
Table 93 Singapore Medical Device Outsourcing Market by Application, 2018 - 2030 (USD Million)
Table 94 Philippines Medical Device Outsourcing Market by Service, 2018 - 2030 (USD Million)
Table 95 Philippines Medical Device Outsourcing Market by Class Type, 2018 - 2030 (USD Million)
Table 96 Philippines Medical Device Outsourcing Market by Application, 2018 - 2030 (USD Million)
Table 97 Latin America Medical Device Outsourcing Market by Country, 2018 - 2030 (USD Million)
Table 98 Latin America Medical Device Outsourcing Market by Service, 2018 - 2030 (USD Million)
Table 99 Latin America Medical Device Outsourcing Market by Class Type, 2018 - 2030 (USD Million)
Table 100 Latin America Medical Device Outsourcing Market by Application, 2018 - 2030 (USD Million)
Table 101 Brazil Medical Device Outsourcing Market by Service, 2018 - 2030 (USD Million)
Table 102 Brazil Medical Device Outsourcing Market by Class Type, 2018 - 2030 (USD Million)
Table 103 Brazil Medical Device Outsourcing Market by Application, 2018 - 2030 (USD Million)
Table 104 Mexico Medical Device Outsourcing Market by Service, 2018 - 2030 (USD Million)
Table 105 Mexico Medical Device Outsourcing Market by Class Type, 2018 - 2030 (USD Million)
Table 106 Mexico Medical Device Outsourcing Market by Application, 2018 - 2030 (USD Million)
Table 107 Argentina Medical Device Outsourcing Market by Service, 2018 - 2030 (USD Million)
Table 108 Argentina Medical Device Outsourcing Market by Class Type, 2018 - 2030 (USD Million)
Table 109 Argentina Medical Device Outsourcing Market by Application, 2018 - 2030 (USD Million)
Table 110 Colombia Medical Device Outsourcing Market by Service, 2018 - 2030 (USD Million)
Table 111 Colombia Medical Device Outsourcing Market by Class Type, 2018 - 2030 (USD Million)
Table 112 Colombia Medical Device Outsourcing Market by Application, 2018 - 2030 (USD Million)
Table 113 Chile Medical Device Outsourcing Market by Service, 2018 - 2030 (USD Million)
Table 114 Chile Medical Device Outsourcing Market by Class Type, 2018 - 2030 (USD Million)
Table 115 Chile Medical Device Outsourcing Market by Application, 2018 - 2030 (USD Million)
Table 116 Middle East & Africa Medical Device Outsourcing Market by Country, 2018 - 2030 (USD Million)
Table 117 Middle East & Africa Medical Device Outsourcing Market by Service, 2018 - 2030 (USD Million)
Table 118 Middle East & Africa Medical Device Outsourcing Market by Class Type, 2018 - 2030 (USD Million)
Table 119 Middle East & Africa Medical Device Outsourcing Market by Application, 2018 - 2030 (USD Million)
Table 120 South Africa Medical Device Outsourcing Market by Service, 2018 - 2030 (USD Million)
Table 121 South Africa Medical Device Outsourcing Market by Class Type, 2018 - 2030 (USD Million)
Table 122 South Africa Medical Device Outsourcing Market by Application, 2018 - 2030 (USD Million)
Table 123 Saudi Arabia Medical Device Outsourcing Market by Service, 2018 - 2030 (USD Million)
Table 124 Saudi Arabia Medical Device Outsourcing Market by Class Type, 2018 - 2030 (USD Million)
Table 125 Saudi Arabia Medical Device Outsourcing Market by Application, 2018 - 2030 (USD Million)
Table 126 UAE Medical Device Outsourcing Market by Service, 2018 - 2030 (USD Million)
Table 127 UAE Medical Device Outsourcing Market by Class Type, 2018 - 2030 (USD Million)
Table 128 UAE Medical Device Outsourcing Market by Application, 2018 - 2030 (USD Million)
Table 129 Egypt Medical Device Outsourcing Market by Service, 2018 - 2030 (USD Million)
Table 130 Egypt Medical Device Outsourcing Market by Class Type, 2018 - 2030 (USD Million)
Table 131 Egypt Medical Device Outsourcing Market by Application, 2018 - 2030 (USD Million)
Table 132 Israel Medical Device Outsourcing Market by Service, 2018 - 2030 (USD Million)
Table 133 Israel Medical Device Outsourcing Market by Class Type, 2018 - 2030 (USD Million)
Table 134 Israel Medical Device Outsourcing Market by Application, 2018 - 2030 (USD Million)
Table 135 Kuwait Medical Device Outsourcing Market by Service, 2018 - 2030 (USD Million)
Table 136 Kuwait Medical Device Outsourcing Market by Class Type, 2018 - 2030 (USD Million)
Table 137 Kuwait Medical Device Outsourcing Market by Application, 2018 - 2030 (USD Million)
List of Figures
Fig. 1 Information Procurement
Fig. 2 Primary Research Pattern
Fig. 3 Market Research Approaches
Fig. 4 Value Chain - Based Sizing & Forecasting
Fig. 5 Market Formulation & Validation
Fig. 6 Medical Device Outsourcing Market , Market Segmentation
Fig. 7 Market Driver Relevance Analysis (Current & Future Impact)
Fig. 8 Market Restraint Relevance Analysis (Current & Future Impact)
Fig. 9 Market Challenge Relevance Analysis (Current & Future Impact)
Fig. 10 Penetration & Growth Prospect Mapping
Fig. 11 SWOT Analysis, By Factor (Political & Legal, Economic and Technological)
Fig. 12 Porter’s Five Forces Analysis
Fig. 13 Market Penetration Vs Growth Prospect Mapping, 2021
Fig. 14 Regional Marketplace: Key Takeaways
Fig. 15 Global Medical Device Outsourcing Market for Small Molecule, 2018 - 2030 (USD Million)
Fig. 16 Global Medical Device Outsourcing Market for Large Molecule, 2018 - 2030 (USD Million)
Fig. 17 Global Medical Device Outsourcing Market for LC - MS Studies, 2018 - 2030 (USD Million)
Fig. 18 Global Medical Device Outsourcing Market for Immunoassays, 2018 - 2030 (USD Million)
Fig. 19 Global Medical Device Outsourcing Market for PK, 2018 - 2030 (USD Million)
Fig. 20 Global Medical Device Outsourcing Market for ADA, 2018 - 2030 (USD Million)
Fig. 21 Global Medical Device Outsourcing Market for Others, 2018 - 2030 (USD Million)
Fig. 22 Global Medical Device Outsourcing Market for ADME, 2018 - 2030 (USD Million)
Fig. 23 Global Medical Device Outsourcing Market for In - Vivo, 2018 - 2030 (USD Million)
Fig. 24 Global Medical Device Outsourcing Market for In - Vitro, 2018 - 2030 (USD Million)
Fig. 25 Global Medical Device Outsourcing Market for PK, 2018 - 2030 (USD Million)
Fig. 26 Global Medical Device Outsourcing Market for PD, 2018 - 2030 (USD Million)
Fig. 27 Global Medical Device Outsourcing Market for Bioavailability, 2018 - 2030 (USD Million)
Fig. 28 Global Medical Device Outsourcing Market for Bioequivalence, 2018 - 2030 (USD Million)
Fig. 29 Global Medical Device Outsourcing Market for Others, 2018 - 2030 (USD Million)
Fig. 30 Global Medical Device Outsourcing Market for Sample Preparation, 2018 - 2030 (USD Million)
Fig. 31 Global Medical Device Outsourcing Market for Protein Precipitation, 2018 - 2030 (USD Million)
Fig. 32 Global Medical Device Outsourcing Market for Liquid - Liquid Extraction, 2018 - 2030 (USD Million)
Fig. 33 Global Medical Device Outsourcing Market for Solid Phase Extraction, 2018 - 2030 (USD Million)
Fig. 34 Global Medical Device Outsourcing Market for Sample Analysis, 2018 - 2030 (USD Million)
Fig. 35 Global Medical Device Outsourcing Market for Hyphenated technique, 2018 - 2030 (USD Million)
Fig. 36 Global Medical Device Outsourcing Market for Chromatographic technique2018 - 2030 (USD Million)
Fig. 37 Global Medical Device Outsourcing Market for Electrophoresis2018 - 2030 (USD Million)
Fig. 38 Global Medical Device Outsourcing Market for Ligand Binding Assay2018 - 2030 (USD Million)
Fig. 39 Global Medical Device Outsourcing Market for Mass Spectrometry2018 - 2030 (USD Million)
Fig. 40 Global Medical Device Outsourcing Market for Nuclear Magnetic Resonance2018 - 2030 (USD Million)
Fig. 41 Global Medical Device Outsourcing Market for Other Processes2018 - 2030 (USD Million)
Fig. 42 Regional Outlook, 2021 & 2030
Fig. 43 North America Medical Device Outsourcing Market 2018 - 2030 (USD Million)
Fig. 44 U.S. Medical Device Outsourcing Market 2018 - 2030 (USD Million)
Fig. 45 Canada Medical Device Outsourcing Market 2018 - 2030 (USD Million)
Fig. 46 Europe Medical Device Outsourcing Market 2018 - 2030 (USD Million)
Fig. 47 France Medical Device Outsourcing Market 2018 - 2030 (USD Million)
Fig. 48 Germany Medical Device Outsourcing Market 2018 - 2030 (USD Million)
Fig. 49 UK Medical Device Outsourcing Market 2018 - 2030 (USD Million)
Fig. 50 Italy Medical Device Outsourcing Market 2018 - 2030 (USD Million)
Fig. 51 Spain Medical Device Outsourcing Market 2018 - 2030 (USD Million)
Fig. 52 Netherlands Medical Device Outsourcing Market 2018 - 2030 (USD Million)
Fig. 53 Switzerland Medical Device Outsourcing Market 2018 - 2030 (USD Million)
Fig. 54 Sweden Medical Device Outsourcing Market 2018 - 2030 (USD Million)
Fig. 55 Belgium Medical Device Outsourcing Market 2018 - 2030 (USD Million)
Fig. 56 Russia Medical Device Outsourcing Market 2018 - 2030 (USD Million)
Fig. 57 Denmark Medical Device Outsourcing Market 2018 - 2030 (USD Million)
Fig. 58 Norway Medical Device Outsourcing Market 2018 - 2030 (USD Million)
Fig. 59 Asia Pacific Medical Device Outsourcing Market 2018 - 2030 (USD Million)
Fig. 60 Japan Medical Device Outsourcing Market 2018 - 2030 (USD Million)
Fig. 61 China Medical Device Outsourcing Market 2018 - 2030 (USD Million)
Fig. 62 India Medical Device Outsourcing Market 2018 - 2030 (USD Million)
Fig. 63 Indonesia Medical Device Outsourcing Market 2018 - 2030 (USD Million)
Fig. 64 Malaysia Medical Device Outsourcing Market 2018 - 2030 (USD Million)
Fig. 65 Singapore Medical Device Outsourcing Market 2018 - 2030 (USD Million)
Fig. 66 Korea Medical Device Outsourcing Market 2018 - 2030 (USD Million)
Fig. 67 Thailand Medical Device Outsourcing Market 2018 - 2030 (USD Million)
Fig. 68 Taiwan Medical Device Outsourcing Market 2018 - 2030 (USD Million)
Fig. 69 Australia Medical Device Outsourcing Market 2018 - 2030 (USD Million)
Fig. 70 Philippines Medical Device Outsourcing Market 2018 - 2030 (USD Million)
Fig. 71 Latin America Medical Device Outsourcing Market 2018 - 2030 (USD Million)
Fig. 72 Brazil Medical Device Outsourcing Market 2018 - 2030 (USD Million)
Fig. 73 Mexico Medical Device Outsourcing Market 2018 - 2030 (USD Million)
Fig. 74 Argentina Medical Device Outsourcing Market 2018 - 2030 (USD Million)
Fig. 75 Colombia Medical Device Outsourcing Market 2018 - 2030 (USD Million)
Fig. 76 Chile Medical Device Outsourcing Market 2018 - 2030 (USD Million)
Fig. 77 Middle East and Africa Medical Device Outsourcing Market 2018 - 2030 (USD Million)
Fig. 78 South Africa Medical Device Outsourcing Market 2018 - 2030 (USD Million)
Fig. 79 Saudi Arabia Medical Device Outsourcing Market 2018 - 2030 (USD Million)
Fig. 80 UAE Medical Device Outsourcing Market 2018 - 2030 (USD Million)
Fig. 81 Israel Medical Device Outsourcing Market 2018 - 2030 (USD Million)
Fig. 82 Egypt Medical Device Outsourcing Market 2018 - 2030 (USD Million)
Market Segmentation
Growing demand for advanced products in the healthcare industry and rapid adoption of small & portable products are anticipated to fuel market growth. Medical products such as drug delivery systems, diversity of life assist devices, therapeutic devices, and patient monitors are all becoming smaller in size, while features & performance are improving. Furthermore, the wearable along with implantable devices that monitor, treat, administer, & track patient conditions are highly required in complex and large instruments. These products are portable, wearable, or implantable, designers look for rugged designs, long-life rechargeable batteries, simple user interfaces, and low-power components along with low costs. Growing need to improve function ability and huge adoption of smaller devices in medical sector to boost market growth in the coming years.
The medical device industry is currently facing issues and challenges. High prices, growing competition coupled with a high degree of industry maturity, and profitability pressure have a great impact on the medical device outsourcing market. Furthermore, the industry has become more competitive and categories such as orthopedic devices, coronary stents, and wound care are moving towards maturity. In addition, the U.S. had faced strong competition from other regional companies such as Bermuda, Netherlands, Germany, and Japan, and emerging economies such as Taiwan, Brazil, Korea, and China have become challenging global competitors. Such vast competition in the market is expected to attract more consumers over the forecast period.
The market is expected to witness a downfall in some countries such as China do not have the same cost advantages as before. Furthermore, decreased labor cost advantage of China as compared to developed countries is increasing the wages by 15.0%-20.0%. These factors are creating challenges in the market growth.
This section will provide insights into the contents included in this medical device outsourcing market report and help gain clarity on the structure of the report to assist readers in navigating smoothly.
Industry overview
Industry trends
Market drivers and restraints
Market size
Growth prospects
Porter’s analysis
PESTEL analysis
Key market opportunities prioritized
Competitive landscape
Company overview
Financial performance
Product benchmarking
Latest strategic developments
Market size, estimates, and forecast from 2018 to 2030
Market estimates and forecast for product segments up to 2030
Regional market size and forecast for product segments up to 2030
Market estimates and forecast for application segments up to 2030
Regional market size and forecast for application segments up to 2030
Company financial performance
A three-pronged approach was followed for deducing the medical device outsourcing market estimates and forecasts. The process has three steps: information procurement, analysis, and validation. The whole process is cyclical, and steps repeat until the estimates are validated. The three steps are explained in detail below:
Information procurement: Information procurement is one of the most extensive and important stages in our research process, and quality data is critical for accurate analysis. We followed a multi-channel data collection process for medical device outsourcing market to gather the most reliable and current information possible.
Analysis: We mine the data collected to establish baselines for forecasting, identify trends and opportunities, gain insight into consumer demographics and drivers, and so much more. We utilized different methods of medical device outsourcing market data depending on the type of information we’re trying to uncover in our research.
Market Research Efforts: Bottom-up Approach for estimating and forecasting demand size and opportunity, top-down Approach for new product forecasting and penetration, and combined approach of both Bottom-up and Top-down for full coverage analysis.
Value-Chain-Based Sizing & Forecasting: Supply-side estimates for understanding potential revenue through competitive benchmarking, forecasting, and penetration modeling.
Demand-side estimates for identifying parent and ancillary markets, segment modeling, and heuristic forecasting.
Qualitative Functional Deployment (QFD) Modelling for market share assessment.
Market formulation and validation: We mine the data collected to establish baselines for forecasting, identify trends and opportunities, gain insight into consumer demographics and drivers, and so much more. We utilize different methods of data analysis depending on the type of information we’re trying to uncover in our research.
Market Formulation: This step involves the finalization of market numbers. This step on an internal level is designed to manage outputs from the Data Analysis step.
Data Normalization: The final market estimates and forecasts are then aligned and sent to industry experts, in-panel quality control managers for validation.
This step also entails the finalization of the report scope and data representation pattern.
Validation: The process entails multiple levels of validation. All these steps run in parallel, and the study is forwarded for publishing only if all three levels render validated results.
The medical device outsourcing market was categorized into four segments, namely service (Quality Assurance, Regulatory Affairs Services, Product Design and Development Services, Product Testing & Sterilization Services, Product Implementation Services, Product Upgrade Services, Product Maintenance Services, Contract Manufacturing), application (Cardiology, Diagnostic imaging, Orthopedic, IVD, Ophthalmic,General and plastic surgery, Drug delivery, Dental, Endoscopy, Diabetes care), class (Class I, Class II, Class III), and regional (North America, Europe, Asia Pacific, Latin America, Middle East and Africa).
The medical device outsourcing market was segmented into services, application, class, and region. The demand at a segment level was deduced using a funnel method. Concepts like the TAM, SAM, SOM, etc., were put into practice to understand the demand. We at GVR deploy three methods to deduce market estimates and determine forecasts. These methods are explained below:
Demand estimation of each product across countries/regions summed up to from the total market.
Variable analysis for demand forecast.
Demand estimation via analyzing paid database, and company financials either via annual reports or paid database.
Primary interviews for data revalidation and insight collection.
Used extensively for new product forecasting or analyzing penetration levels.
Tool used invoice product flow and penetration models Use of regression multi-variant analysis for forecasting Involves extensive use of paid and public databases.
Primary interviews and vendor-based primary research for variable impact analysis.
The medical device outsourcing market was analyzed at a regional level. The globe was divided into North America, Europe, Asia Pacific, Latin America, and Middle East & Africa, keeping in focus variables like consumption patterns, export-import regulations, consumer expectations, etc. These regions were further divided into thirty-three countries, namely, the U.S.; Canada; the UK; Germany; France; Italy; Spain; Netherlands; Switzerland; Sweden; Belgium; Russia; India; Japan; China; Australia; South Korea; Singapore; Indonesia; Malaysia; Thailand; Taiwan; Philippines; Brazil; Mexico; Argentina; Colombia; Chile; South Africa; Saudi Arabia; UAE; Israel; and Egypt.
All three above-mentioned market research methodologies were applied to arrive at regional-level conclusions. The regions were then summed up to form the global market.
The medical device outsourcing market was analyzed via companies operating in the sector. Analyzing these companies and cross-referencing them to the demand equation helped us validate our assumptions and conclusions. Key market players analyzed include:
TÜV SÜD - TÜV SÜD operates through four segments: industry, mobility, certification, and others. Its key services include auditing & system certification, global market access, inspection, knowledge services, product certification, testing, and training.
Mandala International – Founded in 2007, situated in France. The company’s regulatory services include product registration, preaudit inspection, licensing, and pharmacovigilance. The company also provides other services in business development and business creation.
RJR Consulting - RJR Consulting provides consulting services in pharmaceuticals, medical devices, biologics, combination products, food & dietary supplements, cosmetics & consumer products, and chemicals & plastics.
Medical Devices Testing Services – Established in 1990 and situated in U.S. The firm offers various analytical testing services for medical devices companies; services include consulting, mechanical testing, characterization, inspection, compliance with standards, and maintenance of instruments & fixtures.
WuXi AppTec, Inc - Wuxi AppTec, Inc is a pharmaceutical services include safety pharmacology, pharmacokinetics, bioanalysis, drug metabolism, and medicinal & analytical chemistry. It also offers biocompatibility testing, preclinical services, toxicology testing, package & validation testing, genetic toxicology, and material characterization services.
Intertek Group plc – Established in 1988 and situated in U.K. The company operates through three segments: product, trade, and resources. In the product segment, the company offers laboratory testing, quality & performance testing, supplier auditing, vendor compliance, sustainability analysis, and inspection & certification services. In the trade and resources segments, it offers technical services, analytical testing services, calibration, and asset integrity services.
Pace Analytical Services, Inc - Pace Analytical Services, Inc offers chemistry services, such as method development, validation, verification, and method transfer services, including raw material testing, extractable & leachable testing, quality testing, residual solvents testing, environment monitoring, impurities testing, and microbiology laboratory testing. It also provides other services, such as scientific staffing, instrument sale & services, and consulting.
Eurofins Scientific SE – Eurofins Scientific SE was established in 1987 in Luxembourg. The company provides agro-testing, consumer product testing, environment testing, medical device testing, and chemical registration & authorization services.
West Pharmaceutical Services, Inc. - Established 1923 and situated in U.S. The company caters to the needs of biotechnology, medical devices, pharmaceuticals, and generic companies. It also offers contract manufacturing services. The company manufactures stoppers & seals for blood collection, drug packaging, injection systems, and syringe components.
SGS SA – SGS SA offers inspection and product testing services for agriculture, food & life, minerals, oil, gas & chemicals, consumer retail, certification & business enhancement, industrial, environment, health & safety, transportation, and governments & institutions.
Supply Side Estimates
Company revenue estimation via referring to annual reports, investor presentations, and Hoover’s.
Segment revenue determination via variable analysis and penetration modeling.
Competitive benchmarking to identify market leaders and their collective revenue shares.
Forecasting via analyzing commercialization rates, pipelines, market initiatives, distribution networks, etc.
Demand side estimates
Identifying parent markets and ancillary markets
Segment penetration analysis to obtain pertinent
revenue/volume
Heuristic forecasting with the help of subject matter experts
Forecasting via variable analysis
Understanding market dynamics (in terms of drivers, restraints, & opportunities) in the countries.
Understanding trends & variables in the individual countries & their impact on growth and using analytical tools to provide high-level insights into the market dynamics and the associated growth pattern.
Understanding market estimates and forecasts (with the base year as 2022, historic information from 2018 to 2021, and forecast from 2023 to 2030). Regional estimates & forecasts for each category are available and are summed up to form the global market estimates.
The report provides market value for the base year 2022 and a yearly forecast till 2030 in terms of revenue/volume or both. The market for each of the segment outlooks has been provided on region & country basis for the above-mentioned forecast period.
The key industry dynamics, major technological trends, and application markets are evaluated to understand their impact on the demand for the forecast period. The growth rates were estimated using correlation, regression, and time-series analysis.
We have used the bottom-up approach for market sizing, analyzing key regional markets, dynamics, & trends for various products and end-users. The total market has been estimated by integrating the country markets.
All market estimates and forecasts have been validated through primary interviews with the key industry participants.
Inflation has not been accounted for to estimate and forecast the market.
Numbers may not add up due to rounding off.
Europe consists of EU-8, Central & Eastern Europe, along with the Commonwealth of Independent States (CIS).
Asia Pacific includes South Asia, East Asia, Southeast Asia, and Oceania (Australia & New Zealand).
Latin America includes Central American countries and the South American continent
Middle East includes Western Asia (as assigned by the UN Statistics Division) and the African continent.
GVR strives to procure the latest and unique information for reports directly from industry experts, which gives it a competitive edge. Quality is of utmost importance to us, therefore every year we focus on increasing our experts’ panel. Primary interviews are one of the critical steps in identifying recent market trends and scenarios. This process enables us to justify and validate our market estimates and forecasts to our clients. With more than 8,000 reports in our database, we have connected with some key opinion leaders across various domains, including healthcare, technology, consumer goods, and the chemical sector. Our process starts with identifying the right platform for a particular type of report, i.e., emails, LinkedIn, seminars, or telephonic conversation, as every report is unique and requires a differentiated approach.
We send out questionnaires to different experts from various regions/ countries, which is dependent on the following factors:
Report/Market scope: If the market study is global, we send questionnaires to industry experts across various regions, including North America, Europe, Asia Pacific, Latin America, and MEA.
Market Penetration: If the market is driven by technological advancements, population density, disease prevalence, or other factors, we identify experts and send out questionnaires based on region or country dominance.
The time to start receiving responses from industry experts varies based on how niche or well-penetrated the market is. Our reports include a detailed chapter on the KoL opinion section, which helps our clients understand the perspective of experts already in the market space.
NEED A CUSTOM REPORT?
We can customize every report - free of charge - including purchasing stand-alone sections or country-level reports, as well as offer affordable discounts for start-ups & universities. Contact us now
We are GDPR and CCPA compliant! Your transaction & personal information is safe and secure. For more details, please read our privacy policy.
"The quality of research they have done for us has been excellent."