- Home
- »
- Pharmaceuticals
- »
-
Pharmacy Market Size, Share And Trends Report, 2026-2033GVR Report cover
![Pharmacy Market (2026 - 2033)Report]()
Pharmacy Market (2026 - 2033)
Size, Share & Trends Analysis Report By Product Type (Prescription, OTC), By Pharmacy Type (Hospital Pharmacy, Retail Pharmacy (Chain, Independent, Others), ePharmacy, Others), By Region, And Segment Forecasts
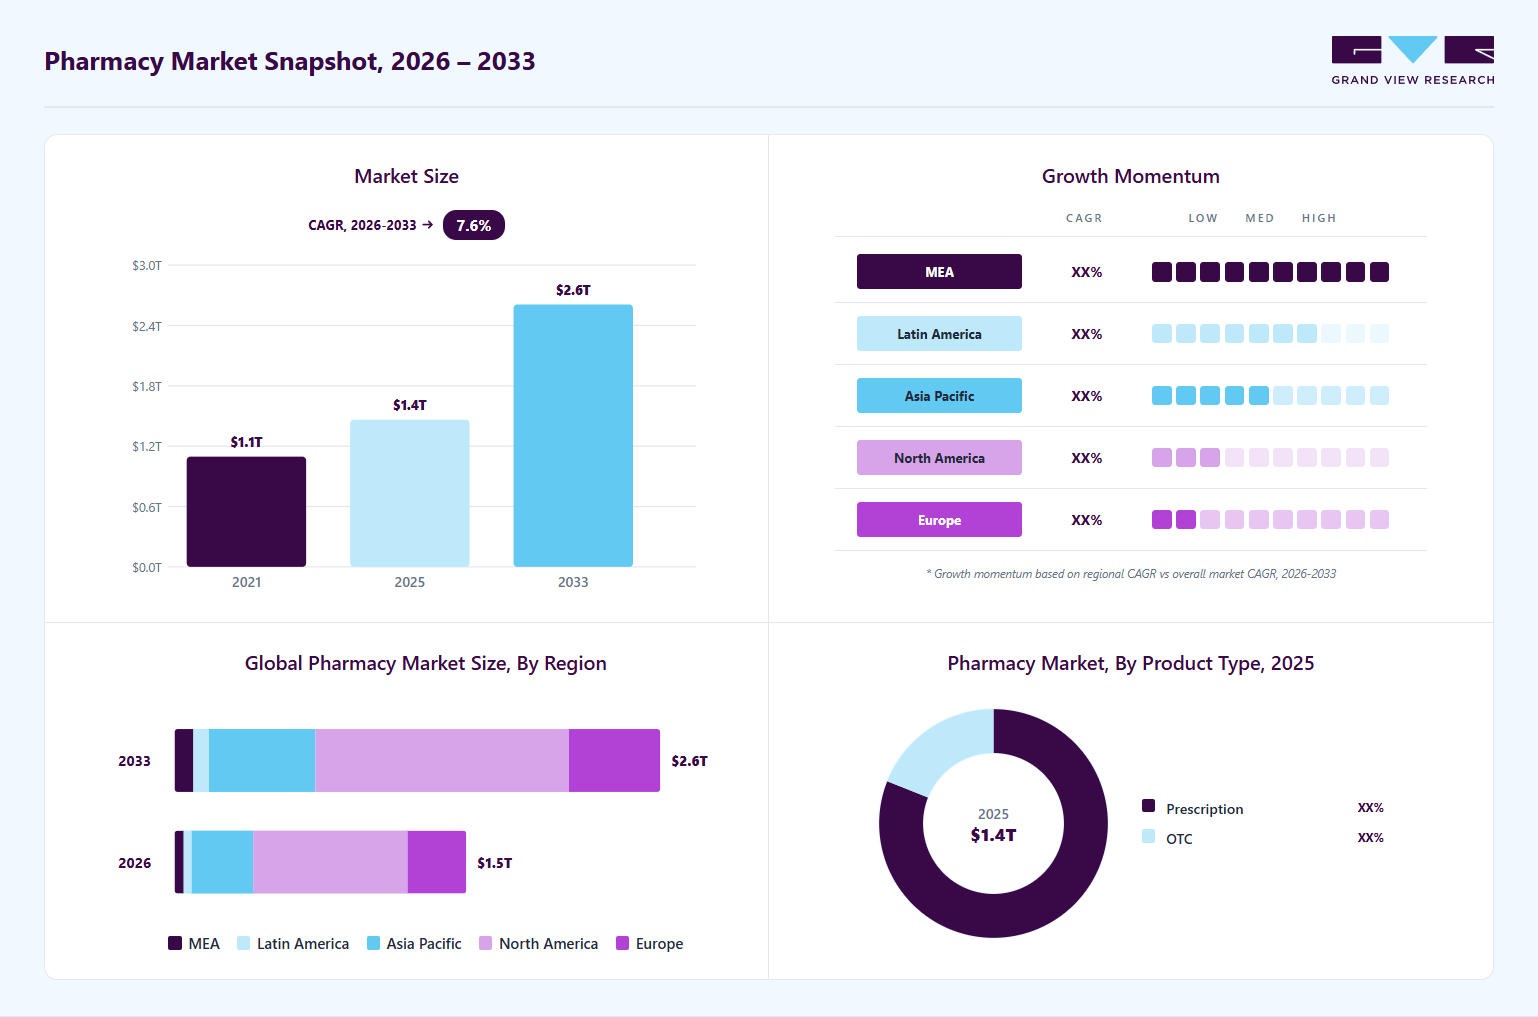
Market Size, 2025
$1.4TMarket Estimate, 2026
$1.5TMarket Forecast, 2033
$2.6TCAGR, 2026–2033
7.6%Pharmacy Market Summary
The global pharmacy market size was valued at USD 1.4 trillion in 2025 and is projected to grow from USD 1.5 trillion in 2026 to USD 2.6 trillion by 2033, growing at a CAGR of 7.6% from 2026 to 2033. The market in North America dominated with a revenue share of 53.1% in 2025. The growing demand for specialty drugs worldwide and increasing prescription drug expenditure in developed countries are also expected to generate novel opportunities.
Key Market Trends & Insights
- By product type: Prescription segment led the market with the largest revenue share of 81.0% in 2025.
- By pharmacy type: Retail pharmacy segment held the largest market share of 54.4% in 2025.
Regional Highlights
- Largest regional market: North America (53.1% revenue share, 2025)
- Fastest-growing regional market: Middle East & Africa (highest CAGR, 2026-2033)
- By country: The U.S. held the largest market share in 2025.
Market Size & Forecast
- Market size in 2025: USD 1.4 Trillion
- Estimated market size in 2026: USD 1.5 Trillion
- Projected market size by 2033: USD 2.6 Trillion
- CAGR (2026-2033): 7.6%
In addition, the increasing occurrence of chronic illnesses such as cancer, diabetes, traumatic brain injuries, and cardiovascular diseases, mainly due to sedentary lifestyles, is fueling further growth. The growing demand for prescription medications is contributing to the industry's growth. As the demand for prescription drugs increases, pharmacies experience a surge in business due to the need to dispense these medications. According to the National Health Service, the current cost of an NHS prescription in England for 2024-2025 is USD 12.65 per item, an increase of USD 0.51 from the previous year. Prescription charges are usually reviewed annually. The cost has increased steadily in recent years, from USD 8.80 in 2015 - 2016 to USD 10.47 in 2024 - 2025.")
Moreover, pharmacies are adopting digitalization programs to cater to the growing demand from consumers and provide improved accessibility to patients. The development of comprehensive suites and software solutions by key market participants in the healthcare IT market is expected to facilitate the growth of the pharmacy market over the forecast period. For instance, in December 2024, Cencora, Inc., a healthcare solutions provider, launched Accelerate Pharmacy Solutions, primarily designed to assist hospitals and health systems in optimizing operations and enhancing financial performance. This solution was developed to simplify supply chain management, deliver cutting-edge technology, and enable users with improved capabilities.
Significant growth in the prevalence of chronic diseases worldwide, rising incident rates of accidents and injuries in countries with lower income levels, and increasing demand for effective therapies are expected to support growth trends in this market. Cancer Facts & Figures 2025, published by the American Cancer Society, estimated that nearly 2,041,910 new cancer cases are likely to occur across the U.S. in 2025. In addition, 1 in 8 adults, nearly 853 million individuals, are expected to be diagnosed with diabetes by 2050. Rapid growth in the aging population, continuous increase in road accidents and unintentional injury incidents, rising demand for portable medical devices, and the emergence of various alliances and associations that work for pharmacy industry participants across countries are likely to facilitate growth.
Market Dynamics
The pharmacy market is experiencing steady growth driven by the increasing demand for prescription medications, over the counter (OTC) products, preventive healthcare services, and chronic disease management solutions. Pharmacies play a critical role in the healthcare ecosystem by providing medication dispensing, patient counseling, vaccination services, health screenings, and digital pharmacy solutions. The rising prevalence of chronic conditions such as diabetes, cardiovascular diseases, respiratory disorders, and cancer, coupled with an aging population and expanding healthcare access, continues to fuel market demand. In addition, the growth of e-pharmacies, advancements in digital health technologies, and increasing consumer preference for convenient and accessible healthcare services are expected to support the continued expansion of the pharmacy market.
The market is expected to witness significant growth due to the increasing demand for specialty drugs. With advancements in medical technology and an aging population, more individuals require specialized medication, leading to an increase in demand for these drugs. Therefore, pharmacies are expanding their offerings to include a wider range of specialty drugs, which is driving growth in the industry. Moreover, specialty medicines are the largest opportunity for pharmacies in the U.S. as they enable health systems to improve patient outcomes. The high cost of these drugs impacts overall economies of scale in the market. According to National Library of Medicine report published in May 2023, specialty drugs accounted for more than 40% of overall retail drug spending and around 70% of the non-retail drug spending in 2021 in the U.S.
Case Study: Specialty Drug Launches Driving the U.S. Pharmacy Market
The U.S. specialty pharmaceutical market is increasingly influenced by new high-value therapies, including biosimilars and advanced treatments such as cell and gene therapies. Recent launches highlighted in AscellaHealth’s Q4 2024 Specialty and Rare Pipeline Digest demonstrate how innovation, pricing strategy, and targeted treatment can reshape market dynamics.
Key Developments:
- Attruby (acoramidis) by BridgeBio offers a lower-priced alternative to Pfizer’s Vyndaqel/Vyndamax for ATTR-CM, expanding access and increasing competitive pricing pressure.
- Itovebi (inavolisib) from Genentech addresses endocrine-resistant, PIK3CA-mutated breast cancer and shows superior efficacy, creating new clinical adoption opportunities.
- Crenessity (crinecerfont) by Neurocrine Biosciences improves disease management in congenital adrenal hyperplasia by reducing steroid dependency, highlighting patient-centric therapeutic value.
Market Impact:
These launches show how therapies with clear clinical benefit, targeted indications, and strategic pricing drive specialty pharmacy growth. They enhance provider uptake, improve patient access, and guide formulary and stocking decisions across the pharmacy and payer landscape.
Conclusion:
Specialty drug innovation supported by real-time pipeline intelligence continues to be a major driver of market expansion, shaping treatment standards and competitive positioning.
Product recalls have a significant impact on the market. When a product is recalled, it can lead to a loss of consumer trust & confidence in the brand and the pharmacy that sold the product. This can result in decreased sales for the pharmacy and a negative impact on its reputation. In addition, pharmacies may incur costs associated with the recall process, such as product disposal and refunds. According to the U.S. FDA, in 2023, 6,121 products were recalled by the U.S. FDA, including 1,138 drugs. The impact can be even more if the recalled product is popular or if the recall is widespread, affecting multiple brands or types of products. For instance, in August 2023, one lot of Digoxin Tablets USP, 0.25 mg, and one lot of Digoxin Tablets USP, 0.125 mg, were voluntarily recalled by Marlex Pharmaceuticals due to the label mix-up. As a result, pharmacies must be vigilant in monitoring product safety and take swift action to remove any potentially harmful products from their shelves.
One significant opportunity in the market lies in the rapidly expanding aging population. With the U.S. Census projecting that by 2030 all baby boomers will be over the age of 65, demand for chronic disease medications, specialty pharmaceuticals, and home healthcare products is expected to increase substantially. Older adults typically require long-term treatment for conditions such as diabetes, cardiovascular diseases, arthritis, and respiratory disorders, creating sustained demand for pharmacy services. Pharmacies can capitalize on this trend by offering medication therapy management, adherence programs, vaccination services, and senior-friendly home delivery solutions. For example, in February 2026, Amazon Pharmacy announced plans to expand same-day prescription delivery to nearly 4,500 U.S. cities and towns by the end of 2026, adding around 2,000 new communities. The strategy is aimed at improving medication access amid pharmacy closures, staffing shortages, and transportation barriers, while supporting patients managing both acute and chronic conditions through doorstep delivery, 24/7 pharmacist access, automatic refills, and PillPack medication packaging.
Market Concentration & Characteristics
The market growth stage is medium, and the pace of growth is accelerating. The presence of multiple businesses in the unorganized retail pharmacy sector, the inclination among specialty and multispecialty hospitals toward providing in-house pharmacy services, and expansions initiated by key global players have developed a fragmented market scenario. Degree of innovation is high in this market as numerous healthcare IT solution providers deliver software solutions equipped with modern technologies such as Internet of Things (IoT), connected devices and AI.
Mergers and acquisitions are moderately common in the global pharmacy industry. Various industry participants equipped with key competencies in specific areas such as infusion, geriatric pharmacy, critical care, and psychiatry are often acquired by global companies to add novel business segments. For instance, in October 2024, Elevance Health, Carelon's parent organization, acquired Kroger Specialty Pharmacy. The acquisition was part of Elevance's broader strategy to strengthen its specialty pharmacy services capabilities.

The impact of regulation is high in the global pharmacy market. Regulatory authorities from various countries, such as the FDA, Health Canada's Pharmaceutical Drugs Directorate (PDD), European Medicines Agency (EMA), and Central Drugs Standard Control Organization (CDSCO), regulate the pharmacy industry. The authorities closely monitor this market regarding the required capabilities to operate retail pharmacies and the validity of products offered through pharmacies. Threat of service substitutes is low for pharmacy market. End use concentration is at moderate level.
Analyst Perspective
The pharmacy market is being driven by the growing prevalence of chronic diseases, increasing demand for prescription medications, and the expanding role of pharmacies in preventive healthcare and patient management. The rise of specialty pharmaceuticals, vaccination services, medication therapy management, and digital pharmacy platforms is further transforming the industry and expanding access to healthcare services.
The key competitive advantage lies with pharmacy providers that successfully integrate medication dispensing with digital health solutions, home delivery, patient engagement programs, and value-added healthcare services. By creating a seamless and personalized healthcare experience rather than focusing solely on prescription fulfillment, pharmacies can improve patient loyalty, enhance medication adherence, and strengthen their long-term market position.
Product Type Insights
Based on product type, the prescription segment led the market with the largest revenue share of 81.0% in 2025. The increasing demand for prescription drugs linked with the treatment of chronic diseases such as diabetes, cardiovascular diseases, respiratory diseases, and blood disorders is driving the growth of the prescription segment. Advancements in diagnostic technologies have led to early-stage detection for numerous patients, enabling timely interventions. Availability of modern imaging technologies, point-of-care testing solutions, and easy accessibility of healthcare services is expected to facilitate the growth of this segment over the forecast period.
The OTC (over-the-counter) segment is expected to experience the fastest CAGR over the forecast period. Cost savings drive the high growth, while factors such as increased information availability regarding treatment of minor ailments, rising expenditure on preventive healthcare, an expanding product range, consumer awareness, and education also contribute to growing adoption. Growing market penetration accomplished by the key market participants in the organized retail pharmacy industry is likely to support the growth of this market in the forecast period.
Pharmacy Type Insights
Based on pharmacy type, the retail pharmacy segment led the market with the largest revenue share of 54.4% in 2025. Growth of this segment is mainly driven by the factors such as increasing presence of chain pharmacies and independent pharmacies, availability of medications in supermarkets & large retailer stores across countries such as the UK & the U.S. Large chains such as Boots, Walgreens, CVS Health, Lloyd, Shoppers Drug Mart, and Well Pharmacy have a significant presence in countries such as Canada, the U.S., Australia, the UK, and Russia. This concentration of major retailers is promoting the growth of the segment.

ePharmacy is anticipated to experience the fastest CAGR from 2025 to 2030. This segment is primarily influenced by the rising ubiquity of smartphones and connected services, increasing utilization of technology-powered devices, convenience offered by ePharmacy services, and growing adoption in urban areas. In recent years, a large number of companies have entered this segment of the pharmacy industry to address patients' shifting preferences. The focus of key market participants on improving patient engagement through improved services and the use of modern technology-driven tools is expected to generate lucrative opportunities, for instance, in October 2024. Amazon Pharmacy announced it plans to open 20 more pharmacies in various cities across the U.S. by 2025, to expand the service area of its same-day delivery services.
Regional Insights
North America dominated the pharmacy market with the largest revenue share of 53.1% in 2025. This market is mainly driven by factors such as the presence of multiple major players, the growing adoption experienced by retail pharmacy and e-pharmacy, and the significant increase in demand for effective therapies linked to chronic diseases such as cancer, diabetes, and cardiovascular diseases. The U.S. is home to multiple pharmaceutical and medical device companies, which support the further growth of this regional industry.

U.S. Pharmacy Market Trends
The pharmacy market in the U.S. held the largest share in the North America region in 2025. Strong regulatory control, increasing expenditure on preventive healthcare, rising prevalence of chronic diseases across the U.S., and multiple organizations' focus on enhancing market share through the delivery of additional services are some of the key growth-driving factors for this market. In recent years, the increasing incidence rate of cardiovascular diseases, traumatic brain injuries, and other complicated health conditions has been growing in the U.S., which directly influences the demand experienced by the pharmacy industry.
Europe Pharmacy Market Trends
Europe pharmacy market was identified as one of the key regions of global pharmacy market in 2025. The growth of this market is mainly driven by factors such as the increasing prevalence of diseases such as diabetes, rare blood disorders, cancer, and cardiovascular diseases. Europe is home to various companies developing, manufacturing, marketing, and distributing medicines and medical devices. This factor also influences the growth of this regional market.
Middle East And Africa Pharmacy Market Trends
Middle East and Africa pharmacy market is expected to experience fastest CAGR of 11.2% from 2026 to 2033. The growing focus of governments on the availability of high-quality healthcare services and systems in the region, the growth experienced by the medical tourism industry, and increasing healthcare expenditures are some of the major factors that facilitate further growth. Collaborations and partnerships among key market participants and the entry of various global players in the region also contribute to the growth.
Saudi Arabia pharmacy market accounted for the largest revenue share of the regional industry in 2025. The growth of this market is primarily driven by the growing investments by key market players in the country, rising healthcare expenditures, and a significant increase in new entrants. For instance, in September 2024, Aster DM Healthcare, a key healthcare service provider in the region, announced its entry into the Saudi Arabia market through a joint venture with Al Hokair Holding Group and plans to open more than 240 pharmacies.
Key Pharmacy Company Insights
Some of the key companies in the global pharmacy market are CVS Health, Walmart Inc., The Kroger Co, Amazon and others. Major players have been adopting strategies such as launch of new services, service area expansions, and collaborations.
-
CVS Health is a healthcare solutions company that operates in the pharmacy market through CVS Pharmacy. It provides its services through a vast network of stores located across the U.S. in multiple states. Its pharmacy services include mail-order pharmacy, neighborhood pharmacy, prescription delivery, prescription savings, and specialty pharmacy.
-
Walmart Inc. is a global retail organization offering many products and services through its stores and a strong international network. It provides same-day pharmacy delivery services across 49 states in the U.S. It leverages its supply network capabilities through integrating grocery, pharmacy, and general merchandise product lines under a single online order.
Key Pharmacy Companies:
The following are the leading companies in the pharmacy market. These companies collectively hold the largest market share and dictate industry trends.
- Boots Walgreens
- Walmart Inc.
- The Kroger Co.
- Rite Aid Corp.
- MCKESSON CORPORATION
- Well Pharmacy
- Humana
- Matsumotokiyoshi Co., Ltd.
- Apollo Pharmacy
- MedPlusMart.com
- Amazon
Competitive Benchmarking
Category
Operating Strategies
Competitive Edge
Weakness
Established Players (e.g., CVS Health, Walgreens Boots Alliance, Cencora, McKesson Corporation)
Expand pharmacy networks through acquisitions, strategic partnerships, and omnichannel healthcare models. Invest in e-pharmacy platforms, specialty pharmacy services, digital prescription management, home delivery, vaccination programs, and integrated healthcare solutions. Strengthen relationships with healthcare providers, insurers, and pharmaceutical manufacturers.
Strong brand recognition, extensive retail and distribution networks, broad product portfolios, significant purchasing power, and advanced digital infrastructure. Ability to leverage economies of scale, negotiate favorable supplier agreements, and provide comprehensive healthcare services across multiple markets.
High operating and labor costs, complex regulatory compliance requirements, and exposure to reimbursement pressures. Large organizational structures can slow decision-making and limit agility in responding to rapidly changing consumer preferences and emerging market trends.
Emerging Players (e.g., Capsule, PharmEasy, Truepill, regional e-pharmacies and independent pharmacy networks)
Focus on digital-first pharmacy models, personalized patient engagement, prescription delivery services, telepharmacy integration, medication adherence programs, and niche therapeutic areas. Utilize technology-driven platforms, mobile applications, and direct-to-consumer strategies to improve convenience and accessibility.
Greater flexibility in adopting innovative technologies, stronger focus on customer experience, and ability to serve underserved or specialized patient segments. Agile business models enable rapid adaptation to changing healthcare and consumer trends.
Limited financial resources, smaller customer bases, and lower brand recognition compared to established players. Dependence on external funding, challenges in scaling operations, and increasing competition from large pharmacy chains and healthcare ecosystems may restrict growth potential.
Recent Developments
-
In January 2025, Walmart Inc. announced availability of same-day pharmacy delivery service in 49 states of the U.S. Through this strategic advancement, the company has integrated pharmacy, grocery and general merchandise services.
-
In September 2024, CVS Health launched hormonal contraceptive prescribing services through its CVS Pharmacy in Massachusetts. This addition to its service portfolio was part of its commitment to address the changing dynamics of healthcare services and accessibility to birth control methods.
-
In January 2024, Kroger extended its partnership with Centene Corporation's pharmacy network—this extension aimed to provide patients with increased opportunities to save on essential prescriptions. The agreement ensured continued Kroger Family of Pharmacies access for approximately 700,000 Centene members in 2024.
-
In April 2023, Rite Aid Corp launched three new Rite Aid Pharmacies in Craigsville, Greenville, and Scottsville, Virginia. This initiative was part of a pilot program to enhance access to services in “pharmacy deserts” and underserved communities.
Pharmacy Market Report Scope
Report Attribute
Details
Market size in 2025
USD 1.4 trillion
Estimated market size in 2026
USD 1.5 trillion
Projected market size by 2033
USD 2.6 trillion
Growth rate
CAGR of 7.6% from 2026 to 2033
Historical data
2021 - 2025
Forecast period
2026 - 2033
Quantitative units
Revenue in USD million/billion and CAGR from 2026 to 2033
Report coverage
Revenue forecast, company ranking, competitive landscape, growth factors, and trends
Segments covered
Product type, pharmacy type, region
Regional scope
North America; Europe; Asia Pacific; Latin America; MEA
Country scope
U.S.; Canada; Mexico; Germany; UK; France; Italy; Spain; Norway; Denmark; Sweden; China; Japan; India; South Korea; Australia; Thailand; Brazil; Argentina; Saudi Arabia; South Africa; UAE; Kuwait
Key companies profiled
CVS Health, Boots Walgreens, Cigna, Walmart, Kroger, Rite Aid Corp., Lloyd Pharmacy, Well Pharmacy, Humana Pharmacy Solutions Matsumoto Kiyoshi, Apollo Pharmacy, MedPlusMart.com
Customization scope
Free report customization (equivalent up to 8 analysts' working days) with purchasse. Addition or alteration to country, regional & segment scope.
Pricing and purchase options
Avail customized purchase options to meet your exact research needs. Explore purchase options
Global Pharmacy Market Report Segmentation
This report forecasts revenue growth at global, regional and country level and provides an analysis of the latest industry trends in each of the sub-segments from 2021 to 2033. For this study, Grand View Research has segmented the global pharmacy market report based on product type, pharmacy type, and region

-
Product Type Outlook (Revenue, USD Million, 2021 - 2033)
-
Prescription
-
OTC
-
-
Pharmacy Type Outlook (Revenue, USD Million, 2021 - 2033)
-
Hospital Pharmacy
-
Retail Pharmacy
-
Chain
-
Independent
-
Others
-
-
ePharmacy
-
Others
-
-
Regional Outlook (Revenue, USD Million, 2021 - 2033)
-
North America
-
U.S.
-
Canada
-
Mexico
-
-
Europe
-
UK
-
Germany
-
France
-
Spain
-
Italy
-
Denmark
-
Sweden
-
Norway
-
-
Asia Pacific
-
China
-
Japan
-
India
-
Australia
-
South Korea
-
Thailand
-
-
Latin America
-
Brazil
-
Argentina
-
-
Middle East & Africa
-
South Africa
-
Saudi Arabia
-
UAE
-
Kuwait
-
-
Research Methodology
Segment Definition
Segment - Product Type
Revenue capture definition
Prescription
A medical prescription is an order issued by a qualified healthcare professional to a pharmacist for a treatment to be provided to their patient
OTC
It refers to medications that can be purchased without a prescription from a licensed healthcare professional. These drugs are typically considered safe and effective for self-medication when used as directed on the label and in accordance with the guidance of a healthcare professional. Consumers can directly purchase OTC drugs from pharmacies, drugstores, supermarkets, and other retail outlets without the need for a prescription
Segment - Pharmacy Type
Revenue capture definition
Hospital Pharmacy
It is a branch of pharmacy that focuses on providing pharmacy services and support within a hospital or medical center. These include centers, such as hospitals, drug-dependency facilities, poison control centers, drug information centers, and residential care facilities.
Retail Pharmacy
It is licensed by the state government and dispenses medications to the public at retail prices. These pharmacies are usually located throughout the community for easy access by the public. Retail pharmacies offer a wide range of prescriptions and Over the Counter (OTC) medications for treating common illnesses.
Chain Pharmacy
Chain pharmacies are retail pharmacy outlets operated by large regional or national organizations with multiple locations, offering prescription dispensing, OTC products, health services, and standardized customer experiences across their networks.
Independent Pharmacy
Independent pharmacies are privately owned retail pharmacies that operate individually or in small groups, often providing personalized patient care, customized medication services, and strong community-based healthcare support.
Others
This category inc, and other non-traditional pharmacy formats tludes supermarket pharmacies, mass merchandiser pharmacies, clinic-based pharmacies, specialty retail pharmacieshat provide medication dispensing and healthcare-related services.
ePharmacy
ePharmacy is an online platform that deals with the preparation and sales of prescription & nonprescription pharmaceuticals, such as traditional brick-and-mortar pharmacies. The only difference is that e-pharmacies operate on the internet, providing customers with the convenience of ordering medications from the comfort of their homes.
Others
Other pharmacies include academia pharmacies, defense pharmacies, clinical pharmacies, long-term care pharmacies, and others
Estimation Model
Model Details
This chapter outlines the approach used to estimate and forecast the global pharmacy market, covering both prescription (Rx) revenue and over the counter (OTC) revenue across retail, chain, independent, specialty, hospital-affiliated, and online pharmacies. The methodology employs a bottom-up approach, relying on prescription dispensing volumes, OTC product sales, average realized prices, and pharmacy channel performance, supported by extensive primary and secondary research. Forecasts are developed for the period 2026 to 2033, with 2025 as the base year.
Market Definition
The pharmacy market includes all revenues generated through the dispensing and sale of prescription medications, specialty pharmaceuticals, and over-the-counter healthcare products by retail, chain, independent, specialty, hospital-affiliated, and online pharmacy operators worldwide.
Three Pillars of Market Estimation
-
Secondary Market Research
-
Data Sources:
-
Government & Public Health Databases: World Health Organization (WHO), Organization for Economic Co-operation and Development (OECD), World Bank, national health ministries, Medicare and public reimbursement databases.
-
Company Disclosures: Annual reports, investor presentations, SEC filings, and financial statements from leading pharmacy chains, distributors, and healthcare retailers globally.
-
Pharmacy Associations & Industry Bodies: International Pharmaceutical Federation (FIP), National Association of Chain Drug Stores (NACDS), European Public Health Alliance (EPHA), Pharmaceutical Group of the European Union (PGEU), and regional pharmacy associations.
-
Healthcare Expenditure Databases: National healthcare spending reports, pharmaceutical expenditure databases, reimbursement statistics, and drug utilization reports.
-
Industry Publications & Trade Journals: Reports covering prescription trends, generic drug penetration, specialty pharmacy growth, OTC consumption patterns, and e-pharmacy adoption.
-
Academic & Clinical Literature: Peer-reviewed studies evaluating medication adherence, chronic disease prevalence, pharmacy utilization trends, and consumer self-medication behavior.
-
-
Analysis Focus:
-
Historical Market Data: Analysis of pharmacy revenues, prescription volumes, and OTC sales trends from 2021-2025.
-
Disease Burden Assessment: Evaluation of chronic disease prevalence including diabetes, cardiovascular diseases, cancer, respiratory disorders, and obesity to validate long-term pharmaceutical demand.
-
Pricing & Reimbursement Analysis: Assessment of average prescription reimbursement rates, drug pricing trends, generic substitution rates, specialty drug expenditures, and OTC pricing benchmarks across regions.
-
Channel Performance Assessment: Analysis of retail, chain, independent, specialty, hospital-affiliated, and online pharmacy performance by geography.
-
-
-
-
Primary Market Intelligence
-
This includes recurring primary research conducted with key industry stakeholders to validate assumptions, understand market dynamics, and capture region-specific developments affecting pharmacy operations and pharmaceutical demand.
-
-
In-Depth Interviews (IDIs)
-
Respondents:
-
Executives from global and regional pharmacy chains
-
Independent pharmacy owners and operators
-
Hospital pharmacy administrators
-
Specialty pharmacy executives
-
Pharmaceutical distributors and wholesalers
-
Pharmacy Benefit Managers (PBMs) and reimbursement specialists
-
Healthcare payers and insurance representatives
-
Pharmacists and healthcare professionals
-
-
-
Online Survey Program
-
Survey Topics:
-
Monthly prescription dispensing volumes by pharmacy type
-
OTC purchasing behavior across major therapeutic categories
-
Consumer preferences regarding retail, chain, independent, specialty, and online pharmacies
-
Adoption of home delivery, digital prescriptions, and telepharmacy services
-
Generic drug acceptance and medication adherence patterns
-
Pricing sensitivity, reimbursement coverage, and out-of-pocket spending trends
-
Customer satisfaction, loyalty drivers, and pharmacy switching behavior
-
Utilization of value-added pharmacy services including vaccinations, health screenings, medication therapy management, and chronic disease support programs
-
-
-
Bottom-Up Market Estimation Model
-
Prescription Revenue Estimation
-
Step 1: Estimate annual prescription dispensing volume by country and pharmacy channel.
-
Step 2: Determine average realized revenue per prescription after accounting for reimbursement adjustments, discounts, and generic substitution rates.
-
Step 3: Calculate prescription revenue by multiplying prescription volume by average realized revenue per prescription.
-
Step 4: Aggregate country-level estimates to regional and global levels.
-
-
OTC Revenue Estimation
-
Step 1: Estimate annual OTC unit sales by therapeutic category and geography.
-
Step 2: Determine average selling price for OTC products across pharmacy channels.
-
Step 3: Calculate OTC revenue by multiplying unit sales by average selling price.
-
Step 4: Aggregate country-level estimates to regional and global market values.
Market Triangulation and Validation
The final market size was derived through triangulation of:
-
Prescription Volume-Based Revenue Model
-
OTC Product Sales Revenue Model
-
Pharmacy Facility and Channel Revenue Benchmarking
-
Primary Research Validation with Industry Participants
Country-level estimates were consolidated into regional markets including North America, Europe, Asia Pacific, Latin America, and the Middle East & Africa. Final market figures were validated against healthcare expenditure data, pharmaceutical consumption statistics, reimbursement trends, and pharmacy operator revenues to ensure consistency and accuracy.
The resulting estimates form the basis for historical market analysis (2021-2025) and forecast projections (2026-2033) for the global pharmacy market.
Delivered Customizations
This report has been delivered with the following In-depth customizations
Client Request
Customization Delivered
VALUE ADDS
Prescription Volume Analysis by Drug Category
Developed a comprehensive volume assessment of prescription and OTC medications segmented by cardiovascular drugs, diabetes therapies, oncology products, respiratory medications, antibiotics, specialty pharmaceuticals, and wellness products. The study evaluates prescription volumes, refill frequency, patient demographics, payer mix, and regional demand patterns.
Enables stakeholders to identify high-volume therapeutic categories, optimize inventory planning, improve procurement strategies, and prioritize investments in high-growth drug segments.
Home Delivery & Last-Mile Fulfillment Analysis
Assessed home delivery adoption, fulfillment models, logistics networks, customer preferences, and delivery performance across pharmacy channels.
Supports optimization of delivery operations, customer convenience, and patient retention strategies.
Vaccination & Preventive Care Services Assessment
Examined pharmacy-based vaccination programs, health screenings, wellness consultations, and preventive healthcare services across key markets.
Helps stakeholders expand healthcare service offerings, increase foot traffic, and diversify revenue streams.
Frequently Asked Questions About This Report
Middle East & Africa is the fastest-growing region over the forecast period.
Some key players operating in the pharmacy market include CVS Health; Boots Walgreens; Cigna; Walmart; Kroger; Rite Aid Corp.; Lloyd Pharmacy; Well Pharmacy; Humana Pharmacy Solutions; Matsumoto Kiyoshi, Apollo Pharmacy, MedPlusMart.com.
Key factors that are driving the pharmacy market growth include increasing demand for specialty drugs, growing adoption of pharmacy, and increasing adoption of digitalization by retail pharmacies.
The prescription segment led the market with the largest revenue share of 81.0% in 2025.
The retail pharmacy segment led the market with the largest revenue share of 54.4% in 2025.
The global pharmacy market size was valued at USD 1.4 trillion in 2025 and is estimated to reach USD 1.5 trillion in 2026.
The global pharmacy market is expected to grow at a CAGR of 7.6% from 2026 to 2033, reaching USD 2.6 trillion.
North America dominated the pharmacy market and accounted for the largest revenue share of 53.1% in 2025. This growth can be attributed to factors such as the aging population, increasing demand for prescription medications, and the rise in the adoption of e-pharmacy services.
About the Author(s)
Pharmaceuticals Research Team
Healthcare · PharmaceuticalsThis report was authored by the pharmaceuticals research team at Grand View Research - comprising two research analysts, one senior research analyst, and one industry expert - with specialized expertise in the pharmaceuticals segment of the healthcare industry. All findings are based on proprietary healthcare databases, executive interviews, and regulatory analysis, subject to internal peer review prior to publication.
Last Updated:
Speak to Analyst


Need a Tailored Report?
Customize this report to your needs — add regions, segments, or data points, with 20% free customization.
Or view our licence options:

ISO 9001:2015 & 27001:2022 Certified
We are GDPR and CCPA compliant! Your transaction & personal information is safe and secure. For more details, please read our privacy policy.


