GVR Report cover U.S. Home Textile Market Size, Share & Trends Report

U.S. Home Textile Market Size, Share & Trends Analysis Report By Product (Bedroom Linen, Bathroom Linen, Carpets & Floor Coverings), By Material (Polyester, Cotton, Silk, Wool), By Distribution Channel, And Segment Forecasts, 2024 - 2030

  • Report ID: GVR-4-68040-204-0
  • Number of Pages: 80
  • Format: Electronic (PDF)

U.S. Home Textile Market Size & Trends

The U.S. home textile market size was estimated at USD 19.14 billion in 2023 and is projected to grow at a compound annual growth rate (CAGR) of 4.7% from 2024 to 2030. Home textiles, an extended yet significant part of home design, are now perceived as statements about an owner’s personality, tastes, and preferences. In addition, the product manufacturers have been experimenting and inventing a lot in terms of styles, patterns, designs, quality standards, and applications as well to lure a fresh pool of customers. The changing customer preferences in terms of consumption patterns and increased demand for specific sections such as natural fabrics or organically grown fabrics are also assisting the overall market growth.
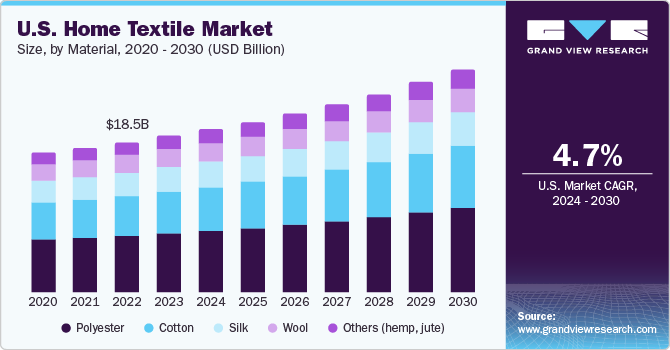
U.S. Home Textile market size and growth rate, 2024 - 2030

Different factors have been contributing to increasing demand in the U.S. Home textile market. For instance, post-pandemic upsurge, steady mortgage rates, and increased job recoveries are most likely to develop rising demand in the housing industry in the U.S. In addition, a growing number of refurbishment and renovation works done by residents across the U.S. has been driving the market towards greater growth.

Well-equipped manufacturers have now started offering an entire set up of home textiles including products required for bedrooms, bathrooms, floor coverings, kitchens, curtains, and more. This adds an advantage for customers as they move from unorganized, different styles and patterns to similar designs, colors, quality of the fabric, and taste. This enables customers to turn their homes into a unique, nostalgic, and sophisticated experience that is not only filled with warmth but also is backed with luxurious, premium, and preferred home textiles.

Market Concentration & Characteristics

The market is growing at an accelerating pace and the growth stage is identified as medium. The U.S. home textiles industry is primarily characterized by a high degree of innovation as customer preferences have been shifting from synthetic to organic or natural fabrics in the recent past. A growing number of customers prefer environment-friendly and sustainably developed products and that has influenced the R&D activity. In addition, the market is influenced by regulations developed by authorities. This includes regulations regarding imports, quality of the fabric used in manufacturing, production practices, and more.
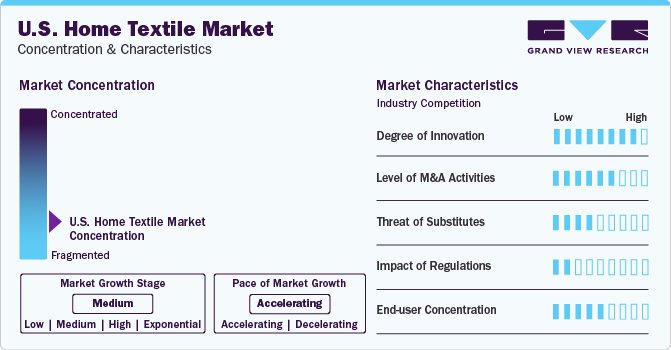
U.S. Home Textile Market Concentration & Characteristics

Often, acquisitions are undertaken with the intent to quickly increase and broaden the product portfolio and to acquire enhanced technical know-how regarding process and product development. However, mergers & acquisitions activities in this market are not limited to similar lines of business. Companies also tend to acquire complementary businesses to develop a competitive advantage over other market participants. For instance, the Hollander Sleep and Décor, acquired the SureFit, one of the key companies offering ready-made slipcovers and accessories. This led Hollander to a competitive position where now it has expanded it portfolio beyond its core competence of utility bedding and has added products such as slipcovers, home decor products, and shower curtains as well.

Regulations are mainly enforced to set up a standard for the home textile industry. When it comes to products as personal as bedroom and bathroom linens, the government authorities make sure that a certain amount of quality and product integrity shall be achieved and maintained by the producers. In terms of substitutes, the only alternatives that have been attracting a great number of customers were sustainable fabrics, which are been offered now by many key players as part of their product portfolio. This has reduced the threat of substitutes to the lowest level.

Product Insights

The bedroom linen market in the U.S. accounted for 45.14% in 2023. Creating light and bright bedrooms with airy linens is what customers have preferred. In the recent past, bedroom design has become an integral part of home design and this has contributed to increasing sales of bedroom linen in the country. However, geographical areas and customer preferences regarding the use of products are also linked.
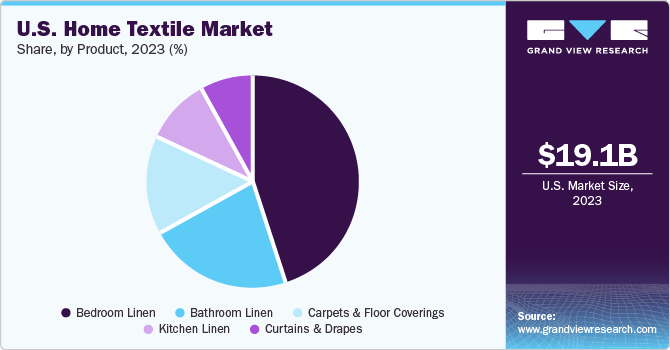
U.S. Home Textile market share and size, 2023

For instance, an article published by Sleep Junkie in April 2021 regarding how America sleeps and what they put in their beds states that more than one-third of Americans have given up top or flat sheets due to weather conditions and have adopted the use of only bottom or attached sheets. In addition, the innovation regarding product development has led to the popularity of bedroom lines as the most valuable home textile. For instance, the market was introduced to newly developed bedroom linen that offers extra comfort for those users who are diagnosed with neuropathy.

However, the bathroom linen market in the U.S. is expected to grow at a CAGR of 5.1%. Except for shower curtains, this includes products such as towels, floor coverings, carpets, bath mats, facecloths, washcloths, and more.

Material Insights

Polyester home textiles market held the U.S. market share of 37.7% in the year 2023. As compared to other materials used in the development of home textiles, polyester-based products have been gaining popularity mainly owing to their lower prices. Expensive prices associated with other material-based products have influenced customer behavior trends and led to a scenario where instead of purchasing high-quality and expensive home textiles made out of non-synthetic materials, buyers have been opting for inexpensive versions made out of synthetic materials, primarily blended fabrics made out of a mix of cotton, polyester, rayon, nylon, and others.

In terms of growth trends, the cotton home textile market is expected to propel at the highest pace and grow a CAGR of 5.7% from 2024 to 2030. Increasing awareness about the disadvantages associated with the usage of synthetic fabric in bedding, organic, and natural fabrics has been gaining the attention of customers in the recent past. When marked by the associated advantages, people often buy these fabrics made out of materials such as cotton, silk, satin, linen, Tencel, bamboo viscose, etc. The eco-friendly and chemical-free are the most traded characteristics of these materials. In addition, manufacturers mark cotton as sustainably sourced and responsibly produced material, which attracts a set of customers who pay attention to such details while purchasing their home textiles.

Distribution Channel Insights

The U.S. home textiles are majorly sold through the offline channels such as supermarkets/hypermarkets, specialty stores, and online channels as well. The sales of home textiles through offline channels accounted for the revenue share of 66.63% in 2023. One of the main reasons attributed to this is post-pandemic purchases undertaken by customers in brick-and-mortar stores across the country for experiential shopping. After stringent lockdowns and restrictions, the local supermarkets, brand stores, and shopping centers have slowly gained increasing customer attention. In addition, offers and cheaper prices provided by highly penetrated offline channels have lured a greater number of customers.

However, the online sales of home textiles in the U.S. is projected to grow at a CAGR of 6% from 2024 to 2030. Most often, these online stores are owned and run by third-party sellers who tend to understand the requirements of buyers, buying patterns, history of recent purchases, and preferences better than producers.

Key U.S. Home Textile Company Insights

The U.S. Home textiles industry is comprised of established players as well as new entrants. These companies are primarily opting for strategies such as new product launches, collaborations, diversification of product range, and using enhanced sales techniques to attain and hold higher market share. Some of the key companies operating in the market include Welspun Group, New Sega Home Textiles, Ralph Lauren Corporation, Milliken, Mohawk Industries, Rugs USA, and others.

  • In August 2023, one of the leading e-retailers in the U.S. acquired the Annie Selke Cos., which includes the Annie Selke. The company is known for providing rugs, bedding materials, and other home goods through brand labels such as Annie Selke, Pine Cone Hill, and Dash & Albert brands.

  • In May 2023, The Textile Business at Milliken announced interactive booth space debuting at Techtextil North America. The booth space is designed precisely as an interactive experience, customers are encouraged to touch, feel, move, and explore the space based on their areas of interest and everything that catches their eye.

Key U.S. Home Textile Companies:

  • Welspun Group
  • New Sega Home Textiles
  • Ralph Lauren Corporation
  • Milliken
  • Mohawk Industries
  • Rugs USA
  • Westpoint
  • Shaw Industries Group, Inc.
  • Home Textile America Inc.
  • EVERTRU Fabrics

Recent Developments

  • In May 2023, Mohawk Industries, one of the leading companies operating in flooring production, has earned a place in America’s Climate Leaders announced by USA Today. The company was the only participant from the home textiles industry to be recognized as one of the industry players to significantly reduce the carbon footprint.

  • In July 2023, Shaw Industries Group, Inc. has been provided with license to the Works with WELL mark for its EcoWorx carpet tile which are the products made available from Patcraft, Philadelphia Commercial and Shaw Contract globally. This enables the purchasers and products specifiers to identify these products as contributors to WELL Certification requirements.

U.S. Home Textile Market Report Scope

Report Attribute

Details

Market size value in 2024

USD 19.91 billion

Revenue forecast in 2030

USD 26.69 billion

Growth rate

CAGR of 4.7% from 2024 to 2030

Actual data

2018 - 2023

Forecasts

2024 - 2030

Quantitative units

Revenue in USD Billion and CAGR from 2024 to 2030

Report Coverage

Revenue forecast; company ranking; competitive landscape; growth factors; and trends

Segments Covered

Products, material, distributions channel

Key companies profiled

Welspun Group; New Sega Home Textiles; Ralph Lauren Corporation; Milliken; Mohawk Industries; Rugs USA; Westpoint; Shaw Industries Group, Inc.; Home Textile America Inc.; EVERTRU Fabrics

Customization scope

Free report customization (equivalent up to 8 analysts working days) with purchase. Addition or alteration to country, regional & segment scope.

Pricing and purchase options

Avail customized purchase options to meet your exact research needs. Explore purchase options 


U.S. Home Textile Market Report Segmentation

This report forecasts revenue growth at the regional level and offers a scrutiny of the most recent industry trends in each of the sub-segments from 2018 to 2030. For this study, Grand View Research has segmented the U.S. home textile market report based on product, material, and distribution channel:

  • Product Outlook (Revenue; USD Billion; 2018 - 2030)

    • Bedroom Linen

    • Bathroom Linen

    • Carpets and Floor Coverings

    • Kitchen Linen

    • Curtains and Drapes

  • Material Outlook (Revenue; USD Billion; 2018 - 2030)

    • Polyester

    • Cotton

    • Silk

    • Wool

    • Others (hemp, jute)

  • Distribution Channel Outlook (Revenue; USD Billion; 2018 - 2030)

    • Offline

      • Supermarkets

      • Specialty Stores

      • Others

    • Online

Frequently Asked Questions About This Report

Table of Contents

Chapter 1. Methodology and Scope
                   1.1. Market Segmentation& Scope
                   1.2. Market Definition
                   1.3. Information Procurement
                       1.3.1. Purchased Database
                       1.3.2. GVR’s Internal Database
                       1.3.3. Secondary Sources & Third-Party Perspectives
                       1.3.4. Primary Research
                   1.4. Information Analysis
                       1.4.1. Data Analysis Models
                   1.5. Market Formulation & Data Visualization
                   1.6. Data Validation & Publishing
Chapter 2. Executive Summary
                   2.1. Market Snapshot
                   2.2. Segment Snapshot
                   2.3. Competitive Landscape Snapshot
Chapter 3. U.S. Home Textile Market Variables; Trends & Scope
                   3.1. Market Lineage Outlook
                   3.2. Industry Value Chain Analysis
                       3.2.1. Sales/Retail Channel Analysis
                       3.2.2. Profit Margin Analysis
                   3.3. Market Dynamics
                       3.3.1. Market Driver Analysis
                       3.3.2. Market Restraint Analysis
                       3.3.3. Industry Challenges
                       3.3.4. Industry Opportunities
                   3.4. Industry Analysis Tools
                       3.4.1. Porter’s Five Forces Analysis
                   3.5. Market Entry Strategies
Chapter 4. Consumer Behavior Analysis
                   4.1. Demographic Analysis
                   4.2. Consumer Trends & Preferences
                   4.3. Factors Influencing Buying Decisions
                   4.4. Consumer Product Adoption Trends
                   4.5. Observations & Recommendations
Chapter 5. U.S. Home Textile Market: Product Estimates & Trend Analysis
                   5.1. Product Movement Analysis & Market Share; 2023 & 2030
                   5.2. U.S. Home Textile Market Estimates & Forecast; By Product; 2018 to 2030 (USD Billion)
                       5.2.1. Bedroom Linen
                           5.2.1.1. Market Estimates & Forecast, 2018 to 2030 (USD Billion)
                       5.2.2. Bathroom Linen
                           5.2.2.1. Market Estimates & Forecast, 2018 to 2030 (USD Billion)
                       5.2.3. Carpets and Floor Coverings
                           5.2.3.1. Market Estimates & Forecast, 2018 to 2030 (USD Billion)
                       5.2.4. Kitchen Linen
                           5.2.4.1. Market Estimates & Forecast, 2018 to 2030 (USD Billion)
                       5.2.5. Curtains and Drapes
                           5.2.5.1. Market Estimates & Forecast, 2018 to 2030 (USD Billion)
Chapter 6. U.S. Home Textile Market: Material Estimates & Trend Analysis
                   6.1. Material Movement Analysis & Market Share; 2023 & 2030
                   6.2. U.S. Home Textile Market Estimates & Forecast; By Material; 2018 to 2030 (USD Billion)
                       6.2.1. Polyester
                           6.2.1.1. Market Estimates & Forecast, 2018 to 2030 (USD Billion)
                       6.2.2. Cotton
                           6.2.2.1. Market Estimates & Forecast, 2018 to 2030 (USD Billion)
                       6.2.3. Silk
                           6.2.3.1. Market Estimates & Forecast, 2018 to 2030 (USD Billion)
                       6.2.4. Wool
                           6.2.4.1. Market Estimates & Forecast, 2018 to 2030 (USD Billion)
                       6.2.5. Others (hemp, jute)
                           6.2.5.1. Market Estimates & Forecast, 2018 to 2030 (USD Billion)
Chapter 7. U.S. Home Textile Market: Distribution Channel Estimates & Trend Analysis
                   7.1.Online
                       7.1.1. Market Estimates & Forecast, 2018 to 2030 (USD Billion)
                       7.1.2. Supermarket/Hypermarket
                           7.1.2.1. Market Estimates & Forecast, 2018 to 2030 (USD Billion)
                       7.1.3. Specialty Stores
                           7.1.3.1 Market Estimates & Forecast, 2018 to 2030 (USD Billion)
                       7.1.4. Others
                           7.1.4.1. Market Estimates & Forecast, 2018 to 2030 (USD Billion)
                   7.2. Offline
                       7.2.1. Market Estimates & Forecast, 2018 to 2030 (USD Billion)
Chapter 8. U.S. Home Textile Market - Competitive Landscape
                   8.1. Recent Developments & Impact Analysis by Key Market Participants
                   8.2. Company Categorization
                   8.3. Company Overview
                   8.4. Financial Performance
                   8.5. Product Benchmarking
                   8.6. Company Market Share Analysis; 2023 (%)
                   8.7. Company Heat Map Analysis
                   8.8. Strategy Mapping
                   8.9. Company Profiles
                       8.9.1. Welspun
                           8.9.1.1. Company Overview
                           8.9.1.2. Financial Performance
                           8.9.1.3. Product Benchmarking
                           8.9.1.4. Strategic Initiatives
                       8.9.2. New Sega Home Textile
                           8.9.2.1. Company Overview
                           8.9.2.2. Financial Performance
                           8.9.2.3. Product Benchmarking
                           8.9.2.4. Strategic Initiatives
                       8.9.3. Ralph Lauren Corporation
                           8.9.3.1. Company Overview
                           8.9.3.2. Financial Performance
                           8.9.3.3. Product Benchmarking
                           8.9.3.4. Strategic Initiatives
                       8.9.4. Milliken
                           8.9.4.1. Company Overview
                           8.9.4.2. Financial Performance
                           8.9.4.3. Product Benchmarking
                           8.9.4.4. Strategic Initiatives
                       8.9.5. Mohawk Industries
                           8.9.5.1. Company Overview
                           8.9.5.2. Financial Performance
                           8.9.5.3. Product Benchmarking
                           8.9.5.4. Strategic Initiatives
                       8.9.6. Rugs USA
                           8.9.6.1. Company Overview
                           8.9.6.2. Financial Performance
                           8.9.6.3. Product Benchmarking
                           8.9.6.4. Strategic Initiatives
                       8.9.7. Westpoint
                           8.9.7.1. Company Overview
                           8.9.7.2. Financial Performance
                           8.9.7.3. Product Benchmarking
                           8.9.7.4. Strategic Initiatives
                       8.9.8. Shaw Industries Group Inc.
                           8.9.8.1. Company Overview
                           8.9.8.2. Financial Performance
                           8.9.8.3. Product Benchmarking
                           8.9.8.4. Strategic Initiatives
                       8.9.9. Home Textile America Inc.
                           8.9.9.1. Company Overview
                           8.9.9.2. Financial Performance
                           8.9.9.3. Product Benchmarking
                           8.9.9.4. Strategic Initiatives
                       8.9.10. EVERTRU Fabrics
                           8.9.10.1. Company Overview
                           8.9.10.2. Financial Performance
                           8.9.10.3. Product Benchmarking
                           8.9.10.4. Strategic Initiatives


List of Tables

1. U.S. Home Textile Market: Market Driver Analysis
2. U.S. Home Textile Market: Market Restraint Analysis
3. U.S. home textile market estimates & forecasts, by product, 2018 - 2030 (USD Billion)
4. Bedroom linen market estimates & forecasts, 2018 - 2030 (USD Billion)
5. Bathroom linen market t estimates & forecasts, 2018 - 2030 (USD Billion)
6. Carpets and floor coverings market estimates & forecasts, 2018 - 2030 (USD Billion)
7. Kitchen linen market estimates & forecasts, 2018 - 2030 (USD Billion)
8. Curtains and drapes textile market estimates & forecasts, 2018 - 2030 (USD Billion)
9. U.S. home textile market estimates & forecasts, by material, 2018 - 2030 (USD Billion)
10. Polyester-based home textile market estimates & forecasts, 2018 - 2030 (USD Billion)
11. Cotton-based home textile market estimates & forecasts, 2018 - 2030 (USD Billion)
12. Silk-based home textile market estimates & forecasts, 2018 - 2030 (USD Billion)
13. Wool-based home textile market estimates & forecasts, 2018 - 2030 (USD Billion)
14. Other home textile material market estimates & forecasts, 2018 - 2030 (USD Billion)
15. U.S. home textile market estimates & forecasts, by distribution channel, 2018 - 2030 (USD Billion)
16. U.S. home textile market estimates & forecasts, through offline distribution channel, 2018 - 2030 (USD Billion)
17. U.S. home textile market estimates & forecasts, through supermarket/hypermarket, 2018 - 2030 (USD Billion)
18. U.S. home textile market estimates & forecasts, through specialty store, 2018 - 2030 (USD Billion)
19. U.S. home textile market estimates & forecasts, through other offline stores, 2018 - 2030 (USD Billion)
20. U.S. home textile market estimates & forecasts, through online distribution channel, 2018 - 2030 (USD Billion)
21. Recent developments & impact analysis, by key market participants
22. Company market share, 2023 (Value % share)


List of Figures

1. U.S. Home Textile Market segmentation
2. Information procurement
3. Primary research pattern
4. Primary research approaches
5. Primary research process
6. Market Snapshot
7. Product segment snapshot
8. Material segment snapshot
9. Distribution Channel snapshot
10. Competitive Landscape Snapshot
11. U.S. Home Textile Market value; 2023 (USD Billion)
12. U.S. Home Textile - Industry value chain analysis
13. U.S. Home Textile dynamics
14. U.S. Home Textile: Porter’s analysis
15. U.S. home textile market estimates & forecasts, by product, 2018 - 2030 (USD Billion)
16. Bedroom linen market estimates & forecasts, 2018 - 2030 (USD Billion)
17. Bathroom linen market t estimates & forecasts, 2018 - 2030 (USD Billion)
18. Carpets and floor coverings market estimates & forecasts, 2018 - 2030 (USD Billion)
19. Kitchen linen market estimates & forecasts, 2018 - 2030 (USD Billion)
20. Curtains and drapes textile market estimates & forecasts, 2018 - 2030 (USD Billion)
21. U.S. home textile market estimates & forecasts, by material, 2018 - 2030 (USD Billion)
22. Polyester-based home textile market estimates & forecasts, 2018 - 2030 (USD Billion)
23. Cotton-based home textile market estimates & forecasts, 2018 - 2030 (USD Billion)
24. Silk-based home textile market estimates & forecasts, 2018 - 2030 (USD Billion)
25. Wool-based home textile market estimates & forecasts, 2018 - 2030 (USD Billion)
26. Other home textile material market estimates & forecasts, 2018 - 2030 (USD Billion)
27. U.S. home textile market estimates & forecasts, by distribution channel, 2018 - 2030 (USD Billion)
28. U.S. home textile market estimates & forecasts, through offline distribution channel, 2018 - 2030 (USD Billion)
29. U.S. home textile market estimates & forecasts, through supermarket/hypermarket, 2018 - 2030 (USD Billion)
30. U.S. home textile market estimates & forecasts, through specialty store, 2018 - 2030 (USD Billion)
31. U.S. home textile market estimates & forecasts, through other offline stores, 2018 - 2030 (USD Billion)
32. U.S. home textile market estimates & forecasts, through online distribution channel, 2018 - 2030 (USD Billion)
33. Key company categorization
34. Company market share analysis; 2023
35. Strategic Framework

What questions do you have? Get quick response from our industry experts. Request a Free Consultation

Market Segmentation

  • Product Outlook (Revenue; USD Billion; 2018 - 2030)
    • Bedroom Linen
    • Bathroom Linen
    • Carpets and Floor Coverings
    • Kitchen Linen
    • Curtains and Drapes
  • End-user Outlook (Revenue; USD Billion; 2018 - 2030)
    • Polyester
    • Cotton
    • Silk
    • Wool
    • Others (hemp, jute)
  • Distribution Channel Outlook (Revenue; USD Billion; 2018 - 2030)
    • Offline
      • Supermarkets
      • Specialty Stores
      • Others
    • Online

Report content

Qualitative Analysis

  • Industry overview
  • Industry trends
  • Market drivers and restraints
  • Market size
  • Growth prospects
  • Porter’s analysis
  • PESTEL analysis
  • Key market opportunities prioritized
  • Competitive landscape
    • Company overview
    • Financial performance
    • Product benchmarking
    • Latest strategic developments

Quantitative Analysis

  • Market size, estimates, and forecast from 2018 to 2030
  • Market estimates and forecast for product segments up to 2030
  • Regional market size and forecast for product segments up to 2030
  • Market estimates and forecast for application segments up to 2030
  • Regional market size and forecast for application segments up to 2030
  • Company financial performance
What questions do you have? Get quick response from our industry experts. Request a Free Consultation

Research Methodology

Grand View Research employs a comprehensive and iterative research methodology focused on minimizing deviance to provide the most accurate estimates and forecasts possible. The company utilizes a combination of bottom-up and top-down approaches for segmenting and estimating quantitative aspects of the market. In Addition, a recurring theme prevalent across all our research reports is data triangulation which looks market from three different perspectives. Critical elements of the methodology employed for all our studies include:

Preliminary data mining

Raw market data is obtained and collated on a broad front. Data is continuously filtered to ensure that only validated and authenticated sources are considered. In addition, data is also mined from a host of reports in our repository, as well as a number of reputed paid databases. For a comprehensive understanding of the market, it is essential to understand the complete value chain, and to facilitate this; we collect data from raw material suppliers, distributors as well as buyers.

Technical issues and trends are obtained from surveys, technical symposia, and trade journals. Technical data is also gathered from an intellectual property perspective, focusing on white space and freedom of movement. Industry dynamics with respect to drivers, restraints, and pricing trends are also gathered. As a result, the material developed contains a wide range of original data that is then further cross-validated and authenticated with published sources.

Statistical model

Our market estimates and forecasts are derived through simulation models. A unique model is created customized for each study. Gathered information for market dynamics, technology landscape, application development, and pricing trends are fed into the model and analyzed simultaneously. These factors are studied on a comparative basis, and their impact over the forecast period is quantified with the help of correlation, regression, and time series analysis. Market forecasting is performed via a combination of economic tools, technological analysis, industry experience, and domain expertise.

Econometric models are generally used for short-term forecasting, while technological market models are used for long-term forecasting. These are based on an amalgamation of the technology landscape, regulatory frameworks, economic outlook, and business principles. A bottom-up approach to market estimation is preferred, with key regional markets analyzed as separate entities and integration of data to obtain global estimates. This is critical for a deep understanding of the industry as well as ensuring minimal errors. Some of the parameters considered for forecasting include:

    • Market drivers and restraints, along with their current and expected impact
    • Raw material scenario and supply v/s price trends
    • Regulatory scenario and expected developments
    • Current capacity and expected capacity additions up to 2030

We assign weights to these parameters and quantify their market impact using weighted average analysis, to derive an expected market growth rate.

Primary validation

This is the final step in estimating and forecasting for our reports. Exhaustive primary interviews are conducted, on face to face as well as over the phone to validate our findings and assumptions used to obtain them. Interviewees are approached from leading companies across the value chain including suppliers, technology providers, domain experts, and buyers to ensure a holistic and unbiased picture of the market. These interviews are conducted across the globe, with language barriers overcome with the aid of local staff and interpreters. Primary interviews not only help in data validation but also provide critical insights into the market, current business scenario, and future expectations and enhance the quality of our reports. All our estimates and forecast are verified through exhaustive primary research with Key Industry Participants (KIPs) which typically include:

    • Market-leading companies
    • Raw material suppliers
    • Product distributors
    • Buyers

The key objectives of primary research are as follows:

    • To validate our data in terms of accuracy and acceptability
    • To gain an insight into the current market and future expectations

Data Collection Matrix

Perspective

Primary research

Secondary research

Supply-side

  • Manufacturers
  • Technology distributors and wholesalers
  • Company reports and publications
  • Government publications
  • Independent investigations
  • Economic and demographic data

Demand-side

  • End-user surveys
  • Consumer surveys
  • Mystery shopping
  • Case studies
  • Reference customers


Industry Analysis Matrix

Qualitative analysis

Quantitative analysis

  • Industry landscape and trends
  • Market dynamics and key issues
  • Technology landscape
  • Market opportunities
  • Porter’s analysis and PESTEL analysis
  • Competitive landscape and component benchmarking
  • Policy and regulatory scenario
  • Market revenue estimates and forecast up to 2030
  • Market revenue estimates and forecasts up to 2030, by technology
  • Market revenue estimates and forecasts up to 2030, by application
  • Market revenue estimates and forecasts up to 2030, by type
  • Market revenue estimates and forecasts up to 2030, by component
  • Regional market revenue forecasts, by technology
  • Regional market revenue forecasts, by application
  • Regional market revenue forecasts, by type
  • Regional market revenue forecasts, by component


What questions do you have? Get quick response from our industry experts. Request a Free Consultation
gvr icn

GET A FREE SAMPLE

gvr icn

This FREE sample includes data points, ranging from trend analyses to estimates and forecasts. See for yourself.

gvr icn

NEED A CUSTOM REPORT?

We can customize every report - free of charge - including purchasing stand-alone sections or country-level reports, as well as offer affordable discounts for start-ups & universities. Contact us now

Certified Icon

We are GDPR and CCPA compliant! Your transaction & personal information is safe and secure. For more details, please read our privacy policy.