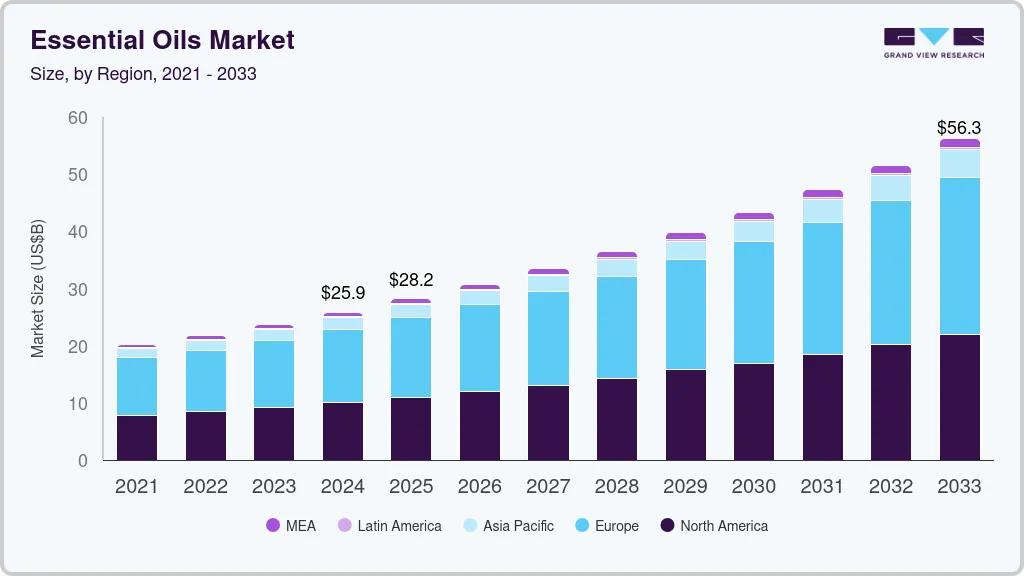
The global essential oils market size was valued at USD 23.74 billion in 2023 and is expected to grow at a compound annual growth rate (CAGR) of 7.6% from 2024 to 2030. This is attributable to increasing demand from major end-use industries such as food & beverage, personal care & cosmetics, and aromatherapy. Increasing consumption of beer and other alcoholic beverages is expected to enhance the expansion of flavors market.
Essential oils contain complex, volatile chemical compounds, which are known for their antifungal, antibacterial, anti-inflammatory, and antiviral properties. Unlike most of the conventional medicines and drugs, these oils have no major side effects. Such factors are projected to be the major driving factor for market growth. Conventional medicines and drugs are also using pleasant smelling aroma compounds to create appealing products, mainly for chemicals that emit undesirable odors. Essential oils are also steadily replacing most chemicals, drugs, and medicines owing to associated health benefits and decreased the risk of side effects.
Rising demand for convenience and ready-to-eat meals, health, and wellness foods, as well as technological advancements are expected to boost food flavors market growth. Rapid industrialization and increasing consumer disposable incomes in emerging economies such as China and India are also projected to foster the global food flavors market over the forecast period.
Essential oils such as rose, sandalwood, Melissa, and German chamomile, which are widely utilized in aromatherapy application, are expensive owing to the difficult extraction process involved. The high price of key essential oils used in aromatherapy is an important factor behind the slow growth of aromatherapy industry in developing countries such as India, Malaysia, etc. compared to developed countries such as the UK, France, and the U.S. among others. However, growth in GDP and the presence of various untapped market opportunities in Asia Pacific are the major factors attracting aromatherapy industry players to establish and expand their business in emerging economies such as India, China, and Indonesia.
Numerous forests have been chopped down to derive very small amounts of oil. Several arable lands have also been converted into monoculture farming lands to cultivate a single plant or crop to derive a particular oil. Production of these crops and plants is undertaken by large multinational firms that disregard the environment and endanger numerous ecosystems. It is thus becoming increasingly difficult to cultivate enough plants to produce one pound of oil.
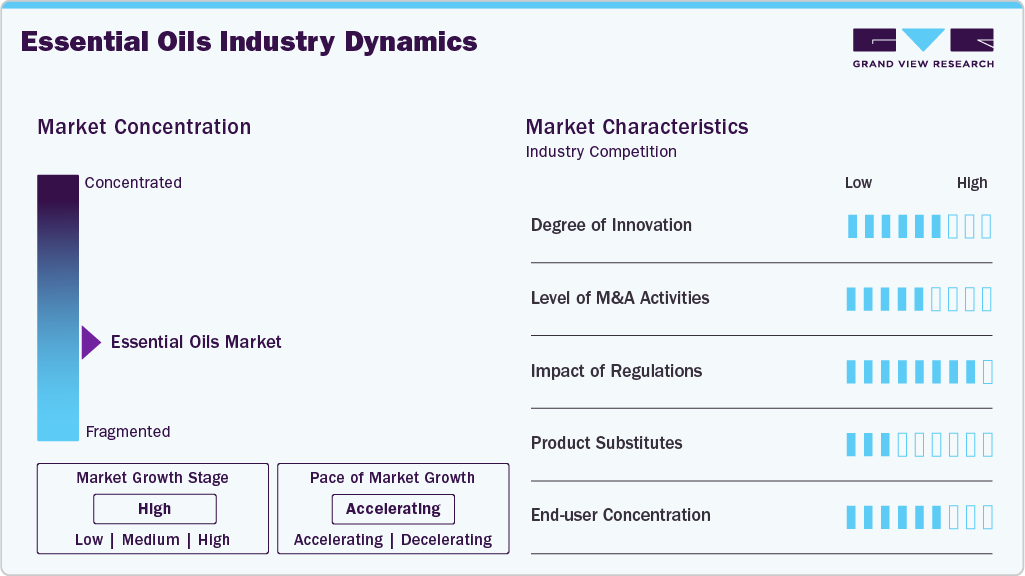
Market growth stage is high and is growing at an accelerating pace. The essential oils market is characterized by a high degree of innovation owing to technological development in the manufacturing process within the various stages of the value chain. There is also an inclination towards the adoption of green chemistry, as well as biotechnology for the purpose of product development.
The essential oils market is also characterized by a high level of merger and acquisition (M&A) activity by the leading players to strengthen their position, as well as expand their regional presence. The past paced growth of key end-use industries has been the driving force for leading market players to adopt this strategy to consolidate their market position.
The market is also subject to increasing regulatory scrutiny. International organizations such as the United Nations (UN) and the European Union (EU) have laid down specific regulations and guidelines for the production, harvesting and processing of flowers and aromatic crops.
Product substitutes are limited in the essential oils market. The rising demand for chemical-free cosmetics has resulted in the usage of essential oils as a substitute for conventional chemicals. However, competition may arise owing to the introduction of new technology or innovative ingredients. Biotech and chemical synthesis are likely to replace conventional distillation technologies.
End-user concentration is a significant factor in the essential oils market. The growing demand for flavors & fragrances used in foods & beverages and for natural personal care products that are created using various aroma compounds and essential oils are expected to foster market growth.
Orange dominated the market with the highest revenue share of 23% in 2023. Its high share is attributable to its ability to enhance the quality of skin, nails, and hair, thus boosting their popularity among young women. Major end-use industries are progressively using orange essential oil for developing sensory appeal and improving the product value. It is believed to promote elasticity, firm and tone up the skin. It is also known to treat stretch marks, dermatitis, and acne. Moreover, the growing working women’s population along with their rising disposable income are expected to be the major drivers for this industry.
Peppermint oil is also considered one of the most versatile essential oils as it can be used internally, topically, and aromatically. The major ingredients present in this oil are menthone and menthol. Healthcare applications of peppermint oil include the treatment of cold, headaches, cold, muscle pain and sinus.
Davana oil is extensively utilized for producing natural perfumes and flavoring agents. Antiviral, stimulant, nervine, and antiseptic properties of the oil make it suitable for use in various medical applications. Davanone, a sesquiterpene ketone, is the main molecule responsible for insect deterrent benefits as well as aromatic benefits of the essential oil. India is the leading producer and exporter of davana essential oil globally, while Germany, France, Australia, Singapore, and the U.S. are the major importers of the same.
Distillation method dominated the market with the highest revenue share in 2023. The growth is attributed to rising utilization of distilled essential oils in aromatic compounds. As distillation is the cost-effective and economical method of extraction as compared to others, it has been preferred for essential oils production. Steam distillation is popular due to low investment requirements, as the process can be carried out to close to the production plant location.
The other methods of extraction are CO2 extraction, and cold press extraction, among others. The loss of volatile chemicals, low yield, hazardous solvent residues, and lengthy extraction durations are a few drawbacks of these methods of extraction.
Flowers dominated the market with the highest revenue share in 2023. The growth is attributed to a surge in demand for organic and natural products that are appealing to end consumers. Some of the common essential oils extracted through flower are chamomile oil, jasmine, lavender, neroli, and rose geranium oils, among others.
Steam distillation extracts essential oils from herbs, flowers, and spices, which are further widely used in food & beverage, pharmaceutical, and perfumery end-use applications. In the process of steam distillation, the vegetable extracts are mixed in water, and bought to boil by hydro distillation. The oleoresins are thus the richest sources of essential oils, as they contribute to the health benefits, fragrance, and flavor of the end product.
Direct selling accounted for over 45% of total sales in 2023.However, other sales channels, on account of increasing awareness of essential oil among people, have given rise to more retail sales, primarily through convenience stores. However, key players have adopted multi-level marketing strategies to expand their business and increase sales.
A majority of importers, and wholesalers have launched websites for online sales, in addition to existing over-the-counter sales. The distribution channels for selling the products is likely to become complex as some sellers focus purely on online sales, to improve their geographic presence worldwide.
Companies offer compensation plans and attractive discountd ro their distributirs ro improve their sales. For instance, doTerra has managed to achieve 5 million global customers of which 70% are wholesale customers. These platforms help increase the reach of their products, spread awareness and eventually boost the sales.
Spa & relaxation dominated the global essential oils market with the highest revenue share of 46.7% in 2023. Its high share is attributable to the changing lifestyle of consumers around the world. Antimicrobial properties of these oils are used to preserve food & beverage products for a longer duration. Growing focus of food & beverage manufacturers on increasing product shelf life without compromising the quality emerged as another major driving factor for the growth of this application segment. Increasing demand for natural, safe, and minimally processed food products across the globe emerged as the major factor driving the application scope of essential oil in food & beverage applications.
The pleasant odor of essential oils makes them ideal for use in personal care products such as cosmetics, toiletries, and fragrances including perfumes, body sprays, and air fresheners. For perfume applications, essential oils are categorized as base notes, middle notes, and top notes according to their volatility. Moreover, the increasing consumer disposable incomes and growing awareness regarding the need to maintain a healthy lifestyle are expected to contribute to the demand for fragrances produced using essential oils.
These fragrances provide stimulation in aromatherapy and other relaxation techniques. Essential oils such as chamomile, cedarwood, peppermint, rose, eucalyptus, sandalwood, tea tree, lavender, jasmine, rosemary, and lemon are claimed to reduce stress and stimulate the mind. Moreover, lavender oil helps cure migraine problems, while rosemary oil helps increase concentration levels.
Personal care emerged as an important segment within spa & relaxation in the global essential oil market as they are used in stress relieving therapies. They are used in beautifying the hair and skin, makeup, and color cosmetics. Further, these oils are also used for cleaning the teeth, gums, and mouth, and in soaps, shampoos, and baby products.
Rising awareness about using natural and organic products is boosting the natural ingredient segment among personal care products, which is positively impacting the essential oil industry. They are also widely used in perfumes, body sprays, and air fresheners.
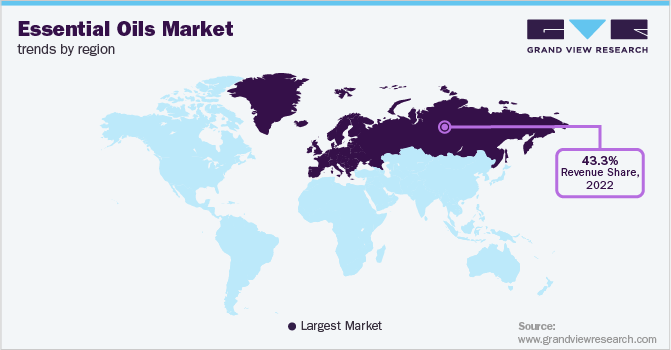
Europe dominated the global market with the highest revenue share of 49.4% in 2023. This is attributed to huge population along with various untapped markets which are likely to attract key player’s attention to expand and establish their operation and distribution facility in this region. In Europe, the presence of organizations such as the European Federation of Essential Oils (EFEO) has benefitted the industry growth. EFEO was formed to promote and safeguard the interests of stakeholders across the market value chain. The organization is in discussions with the European Commission as well, along with the EU Parliament to amend or introduce legislation concerning essential oils. Such trends have benefitted the market growth in the region. Easy feedstock availability and presence of various industry players are the major factors behind the dominating market share of Europe in this market. Early developed economy along with the higher standard of living are several factors which are contributing towards the development of key end-user industries.
Asia Pacific countries such as India, China and Indonesia are pioneers in the industry, and have emerged as the largest exporters of some of the most precious oils and extracts in the world such as champaca extract, jasmine extract, davana oil, frankincense oil, sandalwood oil, spice oils, etc. The suitable weather conditions for agriculture, low cost labor, and ample availability of raw materials, are some of the factors acting as the driving forces for the growth of production in this region. Essential oils market in India is expected to observe growth on account of rising consumer awareness associated with advantages of using natural products.
Rising awareness regarding the importance of a healthy lifestyle and increasing acceptance of natural products are projected to boost the market growth in North America over the coming years. Factors such as high per capita income, tax benefits, and government subsidies are attracting global companies to start and expand their operation in this region. Growing inclination toward preventive healthcare in the region is a major contributing factor to this scenario.
Essential market in Uganda is expected to offer new sales avenues for market participants. The country is characterized by presence of grasses and plants such as cinnamon ginger, eucalyptus, neem tree and lemons nato, from which the essential oils can be extracted. As per Uganda Investment Authority (UIA), these are ample of opportunities in this industry, which are expected to create new jobs over the coming years.
Some of the key players operating in the market include Givaudan, International Flavors & Fragrances Inc., and ROBERTET GROUP.
Givaudan develops, formulates, and distributes flavor and fragrance solutions worldwide. The company caters its services through two major divisions, namely flavors and fragrances. The company has a global presence across 181 locations with 77 production sites, and 69 creation centers.
International Flavors & Fragrances Inc. manufactures and supplies a wide range of ingredients and compounds globally. The company operates through three business segments, namely Taste, Scent, and Frutarom. The taste segment includes savory solutions, flavor compounds, nutrition & specialty ingredients and inclusions.
ROBERTET GROUP develops and distributes specialty ingredients for the flavor, fragrance, cosmetics, food & beverage, and healthcare industries. In addition, the company also develops in-house flavors and fragrances and supplies them to end-use industries for formulating consumer products. The company operates through 4 business divisions, namely natural raw material, flavor, fragrance, and active ingredients. The raw materials division produces a wide range of ingredients such as essential oils, aroma chemicals, fractions, isolates, oleoresins, and floral extracts for aromatherapy, fragrance, flavor, health, and beauty applications.
VedaOils and BMV Fragrances Pvt. Ltd are some of the emerging participants in the essential oils market.
VedaOils is a manufacturer and distributor of essential oils, carrier oils, and raw ingredients worldwide. It caters its products to the fragrances, cosmetics, personal care, and aromatherapy industries worldwide.
BMV Fragrances Pvt. Ltd. manufactures and distributes essential oils and resins worldwide. The company caters its products to the flavors, fragrance, and aromatherapy industries.
The following are the leading companies in the essential oils market. These companies collectively hold the largest market share and dictate industry trends. Financials, strategy maps & products of these essential oils companies are analyzed to map the supply network.
Report Attribute |
Details |
Market size value in 2024 |
USD 25.86 billion |
Revenue forecast in 2030 |
USD 40.12 billion |
Growth rate |
CAGR of 7.9% from 2024 to 2030 |
Base year for estimation |
2022 |
Historical data |
2018 - 2020 |
Forecast period |
2024 - 2030 |
Quantitative units |
Revenue in USD Thousand, Volume in Tons and CAGR from 2024 to 2030 |
Report coverage |
Revenue forecast, company ranking, competitive landscape, growth factors, and trends |
Segments covered |
Product, application, sales channel, method of extraction, source, region |
Regional scope |
North America, Europe, Asia Pacific, Central America, South America, Middle East & Africa |
Country scope |
U.S., Canada, Mexico, Germany, UK, France, Italy Spain, China, India, Japan, Taiwan, South Korea, Thailand, Singapore, Australia, Brazil, Argentina |
Key companies profiled |
Takasago International Corporation, Symrise, MANE, Flavex Naturextrakte GmbH, Firmenich SA, Synthite Industries Ltd., ROBERTET GROUP, International Flavors & Fragrances Inc., Givaudan, Falcon, Norex Flavours Private Limited, BMV Fragrances Pvt. Ltd., VedaOils, MOKSHA LIFESTYLE PRODUCTS, Ultra International, VidyaHerbs |
Customization scope |
Free report customization (equivalent up to 8 analyst’s working days) with purchase. Addition or alteration to country, regional & segment scope. |
Pricing and purchase options |
Avail customized purchase options to meet your exact research needs. Explore purchase options |
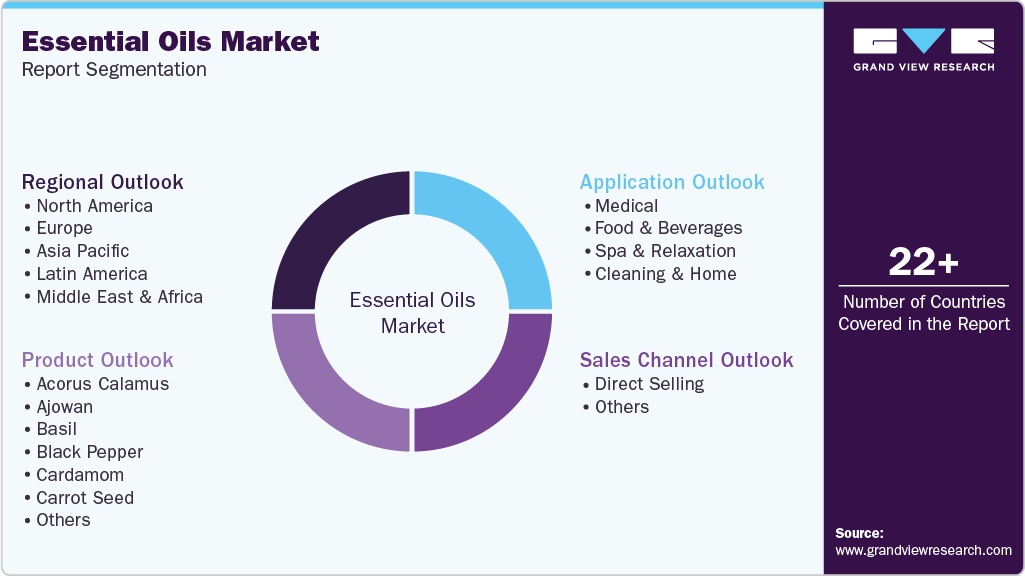
This report forecasts revenue growth at global, regional, and country levels and provides an analysis on the latest industry trends in each of the sub-segments from 2018 to 2030. For the purpose of this study, Grand View Research has segmented the global essential oils market report on the basis of product, application, sales channel, source, method of extraction, and region:
Product Outlook (Volume, Tons; Revenue, USD Thousands, 2018 - 2030)
Acorus Calamus
Ajowan
Basil
Black Pepper
Cardamom
Carrot Seed
Cassia
Cedarwood
Celery
Cinnamon
Citronella
Ciz-3 Hexanol
Clove
Cornmint
Cumin Seed
Curry Leaf
Cypress
Cypriol
Davana
Dill Seed
De-Mentholised Peppermint
Eucalyptus
Fennel
Frankincense
Garlic
Ginger
Holy Basil
Juniper Berry
Lavender
Lemon
Lemongrass
Lime
Mace
Mustard
Neem
Nutmeg
Orange
Palmarosa
Patchouli
Pepper Mint
Rosemary
Spearmint
Tangerine
Tea Tree
Turmeric
Vetiver
Ylang Ylang
Others
Application Outlook (Volume, Tons; Revenue, USD Thousands, 2018 - 2030)
Medical
Pharmaceutical
Nutraceuticals
Food & Beverages
Bakery
Confectionery
Dairy
RTE Meals
Beverages
Meat, Poultry & Seafood
Snacks & Nutritional Bars
Spa & Relaxation
Aromatherapy
Massage Oil
Personal Care
Cosmetics
Hair Care
Skin Care
Sun Care
Makeup And Color Cosmetics
Toiletries
Soaps
Shampoos
Men's Grooming
Oral Care
Baby Care
Fragrances
Perfumes
Body Sprays
Air Fresheners
Cleaning & Home
Kitchen Cleaners
Floor Cleaners
Bathroom Cleaners
Fabric Care
Distillation
Cold Press Extraction
Carbon Dioxide Extraction
Others
Source Outlook (Volume, Tons; Revenue, USD Thousands, 2018 - 2030)
Fruits & Vegetables
Flowers
Herbs & Spices
Sales Channel Outlook (Volume, Tons; Revenue, USD Thousands, 2018 - 2030)
Direct Selling
Others
Regional Outlook (Volume, Tons; Revenue, USD Thousands, 2018 - 2030)
North America
U.S.
Canada
Mexico
Europe
Germany
France
U.K.
Spain
Italy
Asia Pacific
China
India
Japan
Taiwan
South Korea
Singapore
Australia
Middle East & Africa
Central America
South America
Brazil
Argentina
b. The global essential oils market size was estimated at USD 21.79 billion in 2022 and is expected to reach USD 23.74 billion in 2023.
b. The global essential oils market is expected to grow at a compound annual growth rate of 7.9% from 2023 to 2030 to reach USD 40.12 billion by 2030.
b. Europe dominated the essential oils market with a share of 48.8% in 2022. This is attributable to easy feedstock availability and the presence of major industry players in the region.
b. Some key players operating in the essential oils market include DoTerra; Young Living Essential Oils; Essential Oils of New Zealand; The Lebermuth Company; NOW Foods; India Essential Oils; Flavex Naturextrakte GmbH; Ungerer and Company, Inc.; and West India Spices Inc.
b. Key factors that are driving the essential oils market growth include rising awareness regarding the health benefits of naturally sourced oils along with an increasing number of people showing an inclination towards aromatherapy.
Table of Contents
Chapter 1 Essential Oils Market: Methodology and Scope
1.1 Research methodology
1.2 Research scope & assumptions
1.3 List of data sources
Chapter 2 Essential Oils Market: Executive Summary
2.1 Industry snapshot
Chapter 3 Essential Oils Market: Industry Outlook
3.1 Market segmentation
3.2 Market size and growth prospects, 2018 - 2030
3.3 Essential oils value chain analysis
3.3.1 Manufacturing Trends
3.4 Regulatory framework
3.5 Essential Oils Market Dynamics
3.5.1 Market Driver Analysis
3.5.2 Market Restraint Analysis
3.6 Key Opportunities Prioritized
3.7 Industry analysis - Porter’s
3.8 Essential oils Macro-Economic analysis
Chapter 4 Essential Oils Market: Product Estimates & Trend Analysis
4.1 Essential Oils market share, by product, 2018 to 2030
4.2 Global essential oils market estimates & forecasts, by product, 2018 - 2030 (Tons) (USD Thousands)
4.2.1 Acorus Calamus Oil
4.2.1.1 Acorus calamus oil market estimates and forecasts, by application, 2018 - 2030 (Tons) (USD Thousands)
4.2.2 Ajowan Oil
4.2.2.1 Ajowan oil market estimates and forecasts, by application,2018 - 2030 (Tons) (USD Thousands)
4.2.3 Basil Oil
4.2.3.1 Basil oil market estimates and forecasts, by application,2018 - 2030 (Tons) (USD Thousands)
4.2.4 Black Pepper Oil
4.2.4.1 Black Pepper oil market estimates and forecasts, by application,2018 - 2030 (Tons) (USD Thousands)
4.2.5 Cardamom Oil
4.2.5.1 Cardamom oil market estimates and forecasts, by application,2018 - 2030 (Tons) (USD Thousands)
4.2.6 Carrot Seed Oil
4.2.6.1 Carrot Seed oil market estimates and forecasts, by application,2018 - 2030 (Tons) (USD Thousands)
4.2.7 Cassia Oil
4.2.7.1 Cassia oil market estimates and forecasts, by application,2018 - 2030 (Tons) (USD Thousands)
4.2.8 Cedarwood Oil
4.2.8.1 Cedarwood oil market estimates and forecasts, by application,2018 - 2030 (Tons) (USD Thousands)
4.2.9 Celery Oil
4.2.9.1 Celery oil market estimates and forecasts, by application,2018 - 2030 (Tons) (USD Thousands)
4.2.10 Cinnamon Oil
4.2.10.1 Cinnamon oil market estimates and forecasts, by application,2018 - 2030 (Tons) (USD Thousands)
4.2.11 Citronella Oil
4.2.11.1 Citronella oil market estimates and forecasts, by application,2018 - 2030 (Tons) (USD Thousands)
4.2.12 Ciz-3 Hexanol Oil
4.2.12.1 Ciz-3 Hexanol oil market estimates and forecasts, by application,2018 - 2030 (Tons) (USD Thousands)
4.2.13 Clove Oil
4.2.13.1 Clove oil market estimates and forecasts, by application,2018 - 2030 (Tons) (USD Thousands)
4.2.14 Cornmint Oil
4.2.14.1 Cornmint oil market estimates and forecasts, by application,2018 - 2030 (Tons) (USD Thousands)
4.2.15 Cumin Seed Oil
4.2.15.1 Cumin Seed oil market estimates and forecasts, by application,2018 - 2030 (Tons) (USD Thousands)
4.2.16 Curry Leaf Oil
4.2.16.1 Curry Leaf oil market estimates and forecasts, by application,2018 - 2030 (Tons) (USD Thousands)
4.2.17 Cypress Oil
4.2.17.1 Cypress oil market estimates and forecasts, by application,2018 - 2030 (Tons) (USD Thousands)
4.2.18 Cypriol Oil
4.2.18.1 Cypriol oil market estimates and forecasts, by application,2018 - 2030 (Tons) (USD Thousands)
4.2.19 Davana Oil
4.2.19.1 Davana oil market estimates and forecasts, by application,2018 - 2030 (Tons) (USD Thousands)
4.2.20 Dill Seed Oil
4.2.20.1 Dill Seed oil market estimates and forecasts, by application,2018 - 2030 (Tons) (USD Thousands)
4.2.21 De-Mentholised Peppermint oil
4.2.21.1 De-Mentholised Peppermint oil market estimates and forecasts, by application,2018 - 2030 (Tons) (USD Thousands)
4.2.22 Eucalyptus oil
4.2.22.1 Eucalyptus oil market estimates and forecasts, by application,2018 - 2030 (Tons) (USD Thousands)
4.2.23 Fennel Oil
4.2.23.1 Fennel oil market estimates and forecasts, by application,2018 - 2030 (Tons) (USD Thousands)
4.2.24 Frankincense Oil
4.2.24.1 Frankincense oil market estimates and forecasts, by application, 2018 - 2030 (Tons) (USD Thousands)
4.2.25 Garlic Oil
4.2.25.1 Garlic oil market estimates and forecasts, by application,2018 - 2030 (Tons) (USD Thousands)
4.2.26 Ginger Oil
4.2.26.1 Ginger oil market estimates and forecasts, by application,2018 - 2030 (Tons) (USD Thousands)
4.2.27 Holy basil Oil
4.2.27.1 Holy basil oil market estimates and forecasts, by application,2018 - 2030 (Tons) (USD Thousands)
4.2.28 Juniper berry Oil
4.2.28.1 Juniper berry oil market estimates and forecasts, by application,2018 - 2030 (Tons) (USD Thousands)
4.2.29 Lavender Oil
4.2.29.1 Lavender oil market estimates and forecasts, by application,2018 - 2030 (Tons) (USD Thousands)
4.2.30 Lemon Oil
4.2.30.1 Lemon oil market estimates and forecasts, by application,2018 - 2030 (Tons) (USD Thousands)
4.2.31 Lemongrass Oil
4.2.31.1 Lemongrass oil market estimates and forecasts, by application,2018 - 2030 (Tons) (USD Thousands)
4.2.32 Lime Oil
4.2.32.1 Lime oil market estimates and forecasts, by application,2018 - 2030 (Tons) (USD Thousands)
4.2.33 Mace Oil
4.2.33.1 Mace oil market estimates and forecasts, by application,2018 - 2030 (Tons) (USD Thousands)
4.2.34 Mustard Oil
4.2.34.1 Mustard oil market estimates and forecasts, by application,2018 - 2030 (Tons) (USD Thousands)
4.2.35 Neem Oil
4.2.35.1 Neem oil market estimates and forecasts, by application,2018 - 2030 (Tons) (USD Thousands)
4.2.36 Nutmeg Oil
4.2.36.1 Nutmeg oil market estimates and forecasts, by application,2018 - 2030 (Tons) (USD Thousands)
4.2.37 Orange Oil
4.2.37.1 Orange oil market estimates and forecasts, by application,2018 - 2030 (Tons) (USD Thousands)
4.2.38 Palmarosa Oil
4.2.38.1 Palmarosa oil market estimates and forecasts, by application, 2018 - 2030 (Tons) (USD Thousands)
4.2.39 Patchouli Oil
4.2.39.1 Patchouli oil market estimates and forecasts, by application,2018 - 2030 (Tons) (USD Thousands)
4.2.40 Peppermint Oil
4.2.40.1 Peppermint oil market estimates and forecasts, by application,2018 - 2030 (Tons) (USD Thousands)
4.2.41 Rosemary Oil
4.2.41.1 Rosemary oil market estimates and forecasts, by application,2018 - 2030 (Tons) (USD Thousands)
4.2.42 Spearmint Oil
4.2.42.1 Spearmint oil market estimates and forecasts, by application, 2018 - 2030 (Tons) (USD Thousands)
4.2.43 Tangerine Oil
4.2.43.1 Tangerine oil market estimates and forecasts, by application,2018 - 2030 (Tons) (USD Thousands)
4.2.44 Tea Tree Oil
4.2.44.1 Tea Tree oil market estimates and forecasts, by application,2018 - 2030 (Tons) (USD Thousands)
4.2.45 Turmeric Oil
4.2.45.1 Turmeric oil market estimates and forecasts, by application, 2018 - 2030 (Tons) (USD Thousands)
4.2.46 Vetiver Oil
4.2.46.1 Vetiver oil market estimates and forecasts, by application,2018 - 2030 (Tons) (USD Thousands)
4.2.47 Ylang Ylang Oil
4.2.47.1 Ylang Ylang oil market estimates and forecasts, by application,2018 - 2030 (Tons) (USD Thousands)
4.2.48 Other Oil
4.2.48.1 Other oil market estimates and forecasts, by application,2018 - 2030 (Tons) (USD Thousands)
Chapter 5 Essential Oils Market: Application Estimates & Trend Analysis
5.1 Essential Oils market share, by application, 2018 to 2030
5.2 Global essential oils market estimates & forecasts, by application, 2018 - 2030 (Tons) (USD Thousands)
5.2.1 Medical
5.2.1.1 Essential oils market estimates and forecasts by medical application, 2018 - 2030 (Tons) (USD Thousands)
5.2.2 Food & Beverages
5.2.2.1 Essential oils market estimates and forecasts by food & beverages application, 2018 - 2030 (Tons) (USD Thousands)
5.2.3 Spa & Relaxation
5.2.3.1 Essential oils market estimates and forecasts by spa & relaxation application, 2018 - 2030 (Tons) (USD Thousands)
5.2.3.2 Personal Care
5.2.3.2.1 Essential oils market estimates and forecasts in personal care, 2018 - 2030 (Tons) (USD Thousands)
5.2.3.2.1.1 Essential oils market estimates and forecasts in cosmetics, 2018 - 2030 (Tons) (USD Thousands)
5.2.3.2.1.2 Essential oils market estimates and forecasts in toiletries, 2018 - 2030 (Tons) (USD Thousands)
5.2.3.2.1.3 Essential oils market estimates and forecasts in fragrances, 2018 - 2030 (Tons) (USD Thousands)
5.2.4 Cleaning & Home
5.2.4.1 Essential oils market estimates and forecasts by cleaning & home application, 2018 - 2030 (Tons) (USD Thousands)
Chapter 6 Essential Oils Market: Method of Extraction Estimates & Trend Analysis
6.1 Essential Oils market share, by method of extraction, 2018 to 2030
6.2 Global essential oils market estimates & forecasts, by method of extraction, 2018 - 2030 (Tons) (USD Thousands)
6.2.1 Distillation
6.2.1.1 Essential oils market estimates and forecasts by distillation, 2018 - 2030 (Tons) (USD Thousands)
6.3 Cold Press Extraction
6.3.1.1 Essential oils market estimates and forecasts by cold press extraction, 2018 - 2030 (Tons) (USD Thousands)
6.4 Carbon Dioxide Extraction
6.4.1.1 Essential oils market estimates and forecasts by carbon dioxide extraction, 2018 - 2030 (Tons) (USD Thousands)
6.5 Others
6.5.1.1 Essential oils market estimates and forecasts by others, 2018 - 2030 (Tons) (USD Thousands)
Chapter 7 Essential Oils Market: Source Estimates & Trend Analysis
7.1 Essential Oils market share, by source 2017 to 2030
7.2 Global essential oils market estimates & forecasts, by source, 2017-2030 (Tons) (USD Thousands)
7.2.1 Fruits & Vegetables
7.2.1.1 Essential oils market estimates and forecasts by fruits & vegetables, 2018 - 2030 (Tons) (USD Thousands)
7.3 Flowers
7.3.1 Essential oils market estimates and forecasts by flowers, 2018 - 2030 (Tons) (USD Thousands)
7.4 Herbs & Spices
7.4.1 Essential oils market estimates and forecasts by herbs & spices, 2018 - 2030 (Tons) (USD Thousands)
7.5 Others
7.5.1 Essential oils market estimates and forecasts by others, 2018 - 2030 (Tons) (USD Thousands)
Chapter 8 Essential Oils Market: Sales Channel Estimates & Trend Analysis
8.1 Essential Oils market share, by sales channel, 2018 to 2030
8.2 Global essential oils market estimates & forecasts, by sales channel, 2018 - 2030 (Tons) (USD Thousands)
8.2.1 Direct Selling
8.2.1.1 Essential oils market estimates and forecasts by direct selling, 2018 - 2030 (Tons) (USD Thousands)
8.3 Other Sales Channels
8.3.1 Essential oils market estimates and forecasts by other sales channels, 2018 - 2030 (Tons) (USD Thousands)
Chapter 9 Essential Oils Regional Estimates & Trend Analysis
9.1 Essential oils market share, by region, 2018 to 2030
9.2 Global essential oils market estimates and forecasts, by region, 2091 - 2028 (Tons) (USD Thousands)
9.3 North America
9.3.1 North America essential oils market estimates and forecasts, by product 2018 - 2030 (Tons)(USD Thousands)
9.3.2 North America essential oils market estimates and forecasts, by application 2018 - 2030 (Tons)(USD Thousands)
9.3.3 North America essential oils market estimates and forecasts, by method of extraction 2018 - 2030 (Tons)(USD Thousands)
9.3.4 North America essential oils market estimates and forecasts, by source 2018 - 2030 (Tons)(USD Thousands)
9.3.5 North America essential oils market estimates and forecasts, product by application 2018 - 2030 (Tons)(USD Thousands)
9.3.6 U.S.
9.3.6.1 U.S. essential oils market estimates and forecasts, by product 2018 - 2030 (Tons)(USD Thousands)
9.3.6.2 U.S. essential oils market estimates and forecasts, by application 2018 - 2030 (Tons)(USD Thousands)
9.3.6.3 U.S. essential oils market estimates and forecasts, product by application 2018 - 2030 (Tons)(USD Thousands)
9.3.6.4 U.S. essential oils market estimates and forecasts, by source 2018 - 2030 (Tons)(USD Thousands)
9.3.6.5 U.S. essential oils market estimates and forecasts, method of extraction 2018 - 2030 (Tons)(USD Thousands)
9.3.7 Canada
9.3.7.1 Canada essential oils market estimates and forecasts, by product 2018 - 2030 (Tons)(USD Thousands)
9.3.7.2 Canada essential oils market estimates and forecasts, by application 2018 - 2030 (Tons)(USD Thousands)
9.3.7.3 Canada essential oils market estimates and forecasts, product by application 2018 - 2030 (Tons)(USD Thousands)
9.3.7.4 Canada essential oils market estimates and forecasts, by source 2018 - 2030 (Tons)(USD Thousands)
9.3.7.5 Canada essential oils market estimates and forecasts, method of extraction 2018 - 2030 (Tons)(USD Thousands)
9.3.8 Mexico
9.3.8.1 Mexico essential oils market estimates and forecasts, by product 2018 - 2030 (Tons)(USD Thousands)
9.3.8.2 Mexico essential oils market estimates and forecasts, by application 2018 - 2030 (Tons)(USD Thousands)
9.3.8.3 Mexico essential oils market estimates and forecasts, product by application 2018 - 2030 (Tons)(USD Thousands)
9.3.8.4 Mexico essential oils market estimates and forecasts, by source 2018 - 2030 (Tons)(USD Thousands)
9.3.8.5 Mexico essential oils market estimates and forecasts, method of extraction 2018 - 2030 (Tons)(USD Thousands)
9.4 Europe
9.4.1 Europe essential oils market estimates and forecasts, by product 2018 - 2030 (Tons)(USD Thousands)
9.4.2 Europe essential oils market estimates and forecasts, by application 2018 - 2030 (Tons)(USD Thousands)
9.4.3 Europe essential oils market estimates and forecasts, product by application 2018 - 2030 (Tons)(USD Thousands)
9.4.4 Europe essential oils market estimates and forecasts, by method of extraction 2018 - 2030 (Tons)(USD Thousands)
9.4.5 Europe essential oils market estimates and forecasts, by source 2018 - 2030 (Tons)(USD Thousands)
9.4.6 Germany
9.4.6.1 Germany essential oils market estimates and forecasts, by product 2018 - 2030 (Tons)(USD Thousands)
9.4.6.2 Germany essential oils market estimates and forecasts, by application 2018 - 2030 (Tons)(USD Thousands)
9.4.6.3 Germany essential oils market estimates and forecasts, product by application 2018 - 2030 (Tons)(USD Thousands)
9.4.6.4 Germany essential oils market estimates and forecasts, by source 2018 - 2030 (Tons)(USD Thousands)
9.4.6.4 Germany essential oils market estimates and forecasts, method of extraction 2018 - 2030 (Tons)(USD Thousands)
9.4.7 France
9.4.7.1 France essential oils market estimates and forecasts, by product 2018 - 2030 (Tons)(USD Thousands)
9.4.7.2 France essential oils market estimates and forecasts, by application 2018 - 2030 (Tons)(USD Thousands)
9.4.7.3 France essential oils market estimates and forecasts, product by application 2018 - 2030 (Tons)(USD Thousands)
9.4.7.4 France essential oils market estimates and forecasts, by source 2018 - 2030 (Tons)(USD Thousands)
9.4.7.5 France essential oils market estimates and forecasts, method of extraction 2018 - 2030 (Tons)(USD Thousands)
9.4.8 UK
9.4.8.1 UK essential oils market estimates and forecasts, by product 2018 - 2030 (Tons)(USD Thousands)
9.4.8.2 UK essential oils market estimates and forecasts, by application 2018 - 2030 (Tons)(USD Thousands)
9.4.8.3 UK essential oils market estimates and forecasts, product by application 2018 - 2030 (Tons)(USD Thousands)
9.4.8.4 UK essential oils market estimates and forecasts, by source 2018 - 2030 (Tons)(USD Thousands)
9.4.8.5 UK essential oils market estimates and forecasts, method of extraction 2018 - 2030 (Tons)(USD Thousands)
9.4.9 Spain
9.4.9.1 Spain essential oils market estimates and forecasts, by product 2018 - 2030 (Tons)(USD Thousands)
9.4.9.2 Spain essential oils market estimates and forecasts, by application 2018 - 2030 (Tons)(USD Thousands)
9.4.9.3 Spain essential oils market estimates and forecasts, product by application 2018 - 2030 (Tons)(USD Thousands)
9.4.9.4 Spain essential oils market estimates and forecasts, by source 2018 - 2030 (Tons)(USD Thousands)
9.4.9.5 Spain essential oils market estimates and forecasts, method of extraction 2018 - 2030 (Tons)(USD Thousands)
9.4.10 Italy
9.4.10.1 Italy essential oils market estimates and forecasts, by product 2018 - 2030 (Tons)(USD Thousands)
9.4.10.2 Italy essential oils market estimates and forecasts, by application 2018 - 2030 (Tons)(USD Thousands)
9.4.10.3 Italy essential oils market estimates and forecasts, product by application 2018 - 2030 (Tons)(USD Thousands)
9.4.10.4 Italy essential oils market estimates and forecasts, by source 2018 - 2030 (Tons)(USD Thousands)
9.4.10.5 Italy essential oils market estimates and forecasts, method of extraction 2018 - 2030 (Tons)(USD Thousands)
9.5 Asia Pacific
9.5.1 Asia Pacific essential oils market estimates and forecasts, by product 2018 - 2030 (Tons)(USD Thousands)
9.5.2 Asia Pacific essential oils market estimates and forecasts, by application 2018 - 2030 (Tons)(USD Thousands)
9.5.3 Asia Pacific essential oils market estimates and forecasts, product by application 2018 - 2030 (Tons)(USD Thousands)
9.5.4 Asia Pacific essential oils market estimates and forecasts, by method of extraction 2018 - 2030 (Tons)(USD Thousands)
9.5.5 Asia Pacific essential oils market estimates and forecasts, by source 2018 - 2030 (Tons)(USD Thousands)
9.5.6 China
9.5.6.1 China essential oils market estimates and forecasts, by product 2018 - 2030 (Tons)(USD Thousands)
9.5.6.2 China essential oils market estimates and forecasts, by application 2018 - 2030 (Tons)(USD Thousands)
9.5.6.3 China essential oils market estimates and forecasts, product by application 2018 - 2030 (Tons)(USD Thousands)
9.5.6.4 China essential oils market estimates and forecasts, by source 2018 - 2030 (Tons)(USD Thousands)
9.5.6.5 China essential oils market estimates and forecasts, method of extraction 2018 - 2030 (Tons)(USD Thousands)
9.5.7 India
9.5.7.1 India essential oils market estimates and forecasts, by product 2018 - 2030 (Tons)(USD Thousands)
9.5.7.2 India essential oils market estimates and forecasts, by application 2018 - 2030 (Tons)(USD Thousands)
9.5.7.3 India essential oils market estimates and forecasts, product by application 2018 - 2030 (Tons)(USD Thousands)
9.5.7.4 India essential oils market estimates and forecasts, by source 2018 - 2030 (Tons)(USD Thousands)
9.5.7.5 India essential oils market estimates and forecasts, method of extraction 2018 - 2030 (Tons)(USD Thousands)
9.5.8 Japan
9.5.8.1 Japan essential oils market estimates and forecasts, by product 2018 - 2030 (Tons)(USD Thousands)
9.5.8.2 Japan essential oils market estimates and forecasts, by application 2018 - 2030 (Tons)(USD Thousands)
9.5.8.3 Japan essential oils market estimates and forecasts, product by application 2018 - 2030 (Tons)(USD Thousands)
9.5.8.4 Japan essential oils market estimates and forecasts, by source 2018 - 2030 (Tons)(USD Thousands)
9.5.8.5 Japan essential oils market estimates and forecasts, method of extraction 2018 - 2030 (Tons)(USD Thousands)
9.5.9 Taiwan
9.5.9.1 Taiwan essential oils market estimates and forecasts, by product 2018 - 2030 (Tons)(USD Thousands)
9.5.9.2 Taiwan essential oils market estimates and forecasts, by application 2018 - 2030 (Tons)(USD Thousands)
9.5.9.3 Taiwan essential oils market estimates and forecasts, product by application 2018 - 2030 (Tons)(USD Thousands)
9.5.9.4 Taiwan essential oils market estimates and forecasts, by source 2018 - 2030 (Tons)(USD Thousands)
9.5.9.5 Taiwan essential oils market estimates and forecasts, method of extraction 2018 - 2030 (Tons)(USD Thousands)
9.5.10 South Korea
9.5.10.1 South Korea essential oils market estimates and forecasts, by product 2018 - 2030 (Tons)(USD Thousands)
9.5.10.2 South Korea essential oils market estimates and forecasts, by application 2018 - 2030 (Tons)(USD Thousands)
9.5.10.3 South Korea essential oils market estimates and forecasts, product by application 2018 - 2030 (Tons)(USD Thousands)
9.5.10.4 South Korea essential oils market estimates and forecasts, by source 2018 - 2030 (Tons)(USD Thousands)
9.5.10.5 South Korea essential oils market estimates and forecasts, method of extraction 2018 - 2030 (Tons)(USD Thousands)
9.5.11 Singapore
9.5.11.1 Singapore essential oils market estimates and forecasts, by product 2018 - 2030 (Tons)(USD Thousands)
9.5.11.2 Singapore essential oils market estimates and forecasts, by application 2018 - 2030 (Tons)(USD Thousands)
9.5.11.3 Singapore essential oils market estimates and forecasts, product by application 2018 - 2030 (Tons)(USD Thousands)
9.5.11.4 Singapore essential oils market estimates and forecasts, by source 2018 - 2030 (Tons)(USD Thousands)
9.5.11.5 Singapore essential oils market estimates and forecasts, method of extraction 2018 - 2030 (Tons)(USD Thousands)
9.5.12 Australia
9.5.12.1 Australia essential oils market estimates and forecasts, by product 2018 - 2030 (Tons)(USD Thousands)
9.5.12.2 Australia essential oils market estimates and forecasts, by application 2018 - 2030 (Tons)(USD Thousands)
9.5.12.3 Australia essential oils market estimates and forecasts, product by application 2018 - 2030 (Tons)(USD Thousands)
9.5.12.4 Australia essential oils market estimates and forecasts, by source 2018 - 2030 (Tons)(USD Thousands)
9.5.12.5 Australia essential oils market estimates and forecasts, method of extraction 2018 - 2030 (Tons)(USD Thousands)
9.6 Middle East & Africa
9.6.1 Middle East & Africa essential oils market estimates and forecasts, by product 2018 - 2030 (Tons)(USD Thousands)
9.6.2 Middle East & Africa essential oils market estimates and forecasts, by application 2018 - 2030 (Tons)(USD Thousands)
9.6.3 Middle East & Africa essential oils market estimates and forecasts, product by application 2018 - 2030 (Tons)(USD Thousands)
9.6.4 Middle East & Africa essential oils market estimates and forecasts, by method of extraction 2018 - 2030 (Tons)(USD Thousands)
9.6.5 Middle East & Africa essential oils market estimates and forecasts, by source 2018 - 2030 (Tons)(USD Thousands)
9.7 Central America
9.7.1 Central America essential oils market estimates and forecasts, by product 2018 - 2030 (Tons)(USD Thousands)
9.7.2 Central America essential oils market estimates and forecasts, by application 2018 - 2030 (Tons)(USD Thousands)
9.7.3 Central America essential oils market estimates and forecasts, product by application 2018 - 2030 (Tons)(USD Thousands)
9.7.4 Central & America essential oils market estimates and forecasts, by method of extraction 2018 - 2030 (Tons)(USD Thousands)
9.7.5 Central & America essential oils market estimates and forecasts, by source 2018 - 2030 (Tons)(USD Thousands)
9.8 South America
9.8.1 South America essential oils market estimates and forecasts, by product 2018 - 2030 (Tons)(USD Thousands)
9.8.2 South America essential oils market estimates and forecasts, by application 2018 - 2030 (Tons)(USD Thousands)
9.8.3 South America essential oils market estimates and forecasts, product by application 2018 - 2030 (Tons)(USD Thousands)
9.8.4 South America essential oils market estimates and forecasts, by method of extraction 2018 - 2030 (Tons)(USD Thousands)
9.8.5 South America essential oils market estimates and forecasts, by source 2018 - 2030 (Tons)(USD Thousands)
9.8.6 Brazil
9.8.6.1 Brazil essential oils market estimates and forecasts, by product 2018 - 2030 (Tons)(USD Thousands)
9.8.6.2 Brazil essential oils market estimates and forecasts, by application 2018 - 2030 (Tons)(USD Thousands)
9.8.6.3 Brazil essential oils market estimates and forecasts, product by application 2018 - 2030 (Tons)(USD Thousands)
9.8.6.4 Brazil essential oils market estimates and forecasts, by source 2018 - 2030 (Tons)(USD Thousands)
9.8.6.5 Brazil essential oils market estimates and forecasts, method of extraction 2018 - 2030 (Tons)(USD Thousands)
9.8.7 Argentina
9.8.7.1 Argentina essential oils market estimates and forecasts, by product 2018 - 2030 (Tons)(USD Thousands)
9.8.7.2 Argentina essential oils market estimates and forecasts, by application 2018 - 2030 (Tons)(USD Thousands)
9.8.7.3 Argentina essential oils market estimates and forecasts, product by application 2018 - 2030 (Tons)(USD Thousands)
9.8.7.4 Argentina essential oils market estimates and forecasts, by source 2018 - 2030 (Tons)(USD Thousands)
9.8.7.5 Argentina essential oils market estimates and forecasts, method of extraction 2018 - 2030 (Tons)(USD Thousands)
Chapter 10 Competitive Landscape
10.1 Company Market Positioning Analysis
10.2 Competitive Environment
10.3 Vendor landscape
10.4 Strategy framework
Chapter 11 Company Profiles
11.1 Biolandes SAS
11.1.1 Company Overview
11.1.2 Product Benchmarking
11.1.3 Strategic Initiatives
11.2 doTerra
11.2.1 Company Overview
11.2.2 Product Benchmarking
11.2.3 Strategic Initiatives
11.3 Essential Oils of New Zealand
11.3.1 Company Overview
11.3.2 Product Benchmarking
11.4 Falcon Essential Oils
11.4.1 Company Overview
11.4.2 Product Benchmarking
11.5 Farotti Srl
11.5.1 Company Overview
11.5.2 Product Benchmarking
11.6 Flavex Naturextrakte GmbH
11.6.1 Company Overview
11.6.2 Product Benchmarking
11.7 H. Reynaud & Fils (HRF)
11.7.1 Company Overview
11.7.2 Product Benchmarking
11.8 India Essential Oils
11.8.1 Company Overview
11.8.2 Product Benchmarking
11.9 Moksha Lifestyle Products
11.9.1 Company Overview
11.9.2 Product Benchmarking
11.10 Rocky Mountain Essential Oils
11.10.1 Company Overview
11.10.2 Product Benchmarking
11.11 Sydney Essential Oil Co. (SEOC)
11.11.1 Company Overview
11.11.2 Product Benchmarking
11.12 The Lebermuth Company
11.12.1 Company Overview
11.12.2 Product Benchmarking
11.13 Ungerer Limited
11.13.1 Company Overview
11.13.2 Product Benchmarking
11.14 Young Living Essential Oils
11.14.1 Company Overview
11.14.2 Product Benchmarking
11.14.3 Strategic Initiatives
11.15 West India Spices, Inc.
11.15.1 Company Overview
11.15.2 Product Benchmarking
List of Tables
TABLE 1 Global essential oils volume estimates and forecasts, by product, 2018 - 2030 (Tons)
TABLE 2 Global essential oils revenue estimates and forecasts, by product, 2018 - 2030 (USD Thousands)
TABLE 3 Acorus calamus oil market estimates and forecasts, 2018 - 2030 (Tons) (USD Thousands)
TABLE 4 Ajowan oil market estimates and forecasts, 2018 - 2030 (Tons) (USD Thousands)
TABLE 5 Basil oil market estimates and forecasts, 2018 - 2030 (Tons) (USD Thousands)
TABLE 6 Black Pepper oil market estimates and forecasts, 2018 - 2030 (Tons) (USD Thousands)
TABLE 7 Cardamom oil market estimates and forecasts, 2018 - 2030 (Tons) (USD Thousands)
TABLE 8 Carrot Seed oil market estimates and forecasts, 2018 - 2030 (Tons) (USD Thousands)
TABLE 9 Cassia oil market estimates and forecasts, 2018 - 2030 (Tons) (USD Thousands)
TABLE 10 Cedarwood oil market estimates and forecasts, 2018 - 2030 (Tons) (USD Thousands)
TABLE 11 Celery oil market estimates and forecasts, 2018 - 2030 (Tons) (USD Thousands)
TABLE 12 Cinnamon oil market estimates and forecasts, 2018 - 2030 (Tons) (USD Thousands)
TABLE 13 Citronella oil market estimates and forecasts, 2018 - 2030 (Tons) (USD Thousands)
TABLE 14 Ciz-3 Hexanol oil market estimates and forecasts, 2018 - 2030 (Tons) (USD Thousands)
TABLE 15 Clove oil market estimates and forecasts, 2018 - 2030 (Tons) (USD Thousands)
TABLE 16 Cornmint oil market estimates and forecasts, 2018 - 2030 (Tons) (USD Thousands)
TABLE 17 Cumin Seed oil market estimates and forecasts, 2018 - 2030 (Tons) (USD Thousands)
TABLE 18 Curry Leaf oil market estimates and forecasts, 2018 - 2030 (Tons) (USD Thousands)
TABLE 19 Cypress oil market estimates and forecasts, 2018 - 2030 (Tons) (USD Thousands)
TABLE 20 Cypriol oil market estimates and forecasts, 2018 - 2030 (Tons) (USD Thousands)
TABLE 21 Davana oil market estimates and forecasts, 2018 - 2030 (Tons) (USD Thousands)
TABLE 22 Dill Seed oil market estimates and forecasts, 2018 - 2030 (Tons) (USD Thousands)
TABLE 23 De-Mentholised Peppermint oil market estimates and forecasts, 2018 - 2030 (Tons) (USD Thousands)
TABLE 24 Eucalyptus oil market estimates and forecasts, 2018 - 2030 (Tons) (USD Thousands)
TABLE 25 Fennel oil market estimates and forecasts, 2018 - 2030 (Tons) (USD Thousands)
TABLE 26 Frankincense oil market estimates and forecasts, 2018 - 2030 (Tons) (USD Thousands)
TABLE 27 Garlic oil market estimates and forecasts, 2018 - 2030 (Tons) (USD Thousands)
TABLE 28 Ginger oil market estimates and forecasts, 2018 - 2030 (Tons) (USD Thousands)
TABLE 29 Holy basil oil market estimates and forecasts, 2018 - 2030 (Tons) (USD Thousands)
TABLE 30 Juniper berry oil market estimates and forecasts, 2018 - 2030 (Tons) (USD Thousands)
TABLE 31 Lavender oil market estimates and forecasts, 2018 - 2030 (Tons) (USD Thousands)
TABLE 32 Lemon oil market estimates and forecasts, 2018 - 2030 (Tons) (USD Thousands)
TABLE 33 Lemongrass oil market estimates and forecasts, 2018 - 2030 (Tons) (USD Thousands)
TABLE 34 Lime oil market estimates and forecasts, 2018 - 2030 (Tons) (USD Thousands)
TABLE 35 Mace oil market estimates and forecasts, 2018 - 2030 (Tons) (USD Thousands)
TABLE 36 Mustard oil market estimates and forecasts, 2018 - 2030 (Tons) (USD Thousands)
TABLE 37 Neem oil market estimates and forecasts, 2018 - 2030 (Tons) (USD Thousands)
TABLE 38 Nutmeg oil market estimates and forecasts, 2018 - 2030 (Tons) (USD Thousands)
TABLE 39 Orange oil market estimates and forecasts, 2018 - 2030 (Tons) (USD Thousands)
TABLE 40 Palmarosa oil market estimates and forecasts, 2018 - 2030 (Tons) (USD Thousands)
TABLE 41 Patchouli oil market estimates and forecasts, 2018 - 2030 (Tons) (USD Thousands)
TABLE 42 Peppermint oil market estimates and forecasts, 2018 - 2030 (Tons) (USD Thousands)
TABLE 43 Rosemary oil market estimates and forecasts, 2018 - 2030 (Tons) (USD Thousands)
TABLE 44 Spearmint oil market estimates and forecasts, 2018 - 2030 (Tons) (USD Thousands)
TABLE 45 Tangerine oil market estimates and forecasts, 2018 - 2030 (Tons) (USD Thousands)
TABLE 46 Tea Tree oil market estimates and forecasts, 2018 - 2030 (Tons) (USD Thousands)
TABLE 47 Turmeric oil market estimates and forecasts, 2018 - 2030 (Tons) (USD Thousands)
TABLE 48 Vetiver oil market estimates and forecasts, 2018 - 2030 (Tons) (USD Thousands)
TABLE 49 Ylang Ylang oil market estimates and forecasts, 2018 - 2030 (Tons) (USD Thousands)
TABLE 50 Other oil market estimates and forecasts, 2018 - 2030 (Tons) (USD Thousands)
TABLE 51 Key properties and benefits of cypress essential oil
TABLE 52 Major other essential oils and their effect on the body
TABLE 53 Global essential oils volume estimates and forecasts, by application, 2018 - 2030 (Tons)
TABLE 54 Global essential oils revenue estimates and forecasts, by application, 2018 - 2030 (USD Thousands)
TABLE 55 Essential oils market estimates and forecasts by medical application, 2018 - 2030 (Tons) (USD Thousands)
TABLE 56 Essential oils market estimates and forecasts by food & beverages application, 2018 - 2030 (Tons) (USD Thousands)
TABLE 57 Essential oils market estimates and forecasts by spa & relaxation application, 2018 - 2030 (Tons) (USD Thousands)
TABLE 58 Essential oils market estimates and forecasts in personal care, 2018 - 2030 (Tons) (USD Thousands)
TABLE 59 Essential oils market estimates and forecasts in cosmetics, 2018 - 2030 (Tons) (USD Thousands)
TABLE 60 Essential oils market estimates and forecasts in toiletries, 2018 - 2030 (Tons) (USD Thousands)
TABLE 61 Essential oils market estimates and forecasts in fragrances, 2018 - 2030 (Tons) (USD Thousands)
TABLE 62 Essential oils market estimates and forecasts by cleaning & home application, 2018 - 2030 (Tons) (USD Thousands)
TABLE 63 Major essential oils and their food & beverage applications
TABLE 64 Some major essential oils used by spa & relaxation industry
TABLE 65 Global essential oils volume estimates and forecasts, by sales channel, 2018 - 2030 (Tons)
TABLE 66 Global essential oils revenue estimates and forecasts, by sales channel, 2018 - 2030 (USD Thousands)
TABLE 67 Essential oils market estimates and forecasts by direct selling, 2018 - 2030 (Tons) (USD Thousands)
TABLE 68 Essential oils market estimates and forecasts by other sales channels, 2018 - 2030 (Tons) (USD Thousands)
TABLE 69 Global essential oils volume estimates and forecasts, by region, 2018 - 2030 (Tons)
TABLE 70 Global essential oils revenue estimates and forecasts, by region, 2018 - 2030 (USD Thousands)
TABLE 71 North America essential oils volume estimates and forecasts, by product, 2018 - 2030 (Tons)
TABLE 72 North America essential oils volume estimates and forecasts, by product, 2018 - 2030 (USD Thousands)
TABLE 73 North America essential oils volume estimates and forecasts, by application, 2018 - 2030 (Tons)
TABLE 74 North America essential oils volume estimates and forecasts, by application, 2018 - 2030 (USD Thousands)
TABLE 75 North America essential oils volume estimates and forecasts, product by application, 2018 - 2030 (Tons)
TABLE 76 North America essential oils volume estimates and forecasts, product by application, 2018 - 2030 (USD Thousands)
TABLE 77 U.S. essential oils volume estimates and forecasts, by product, 2018 - 2030 (Tons)
TABLE 78 U.S. essential oils volume estimates and forecasts, by product, 2018 - 2030 (USD Thousands)
TABLE 79 U.S. essential oils volume estimates and forecasts, by application, 2018 - 2030 (Tons)
TABLE 80 U.S. essential oils volume estimates and forecasts, by application, 2018 - 2030 (USD Thousands)
TABLE 81 U.S. essential oils volume estimates and forecasts, product by application, 2018 - 2030 (Tons)
TABLE 82 U.S. essential oils volume estimates and forecasts, product by application, 2018 - 2030 (USD Thousands)
TABLE 83 Canada essential oils volume estimates and forecasts, by product, 2018 - 2030 (Tons)
TABLE 84 Canada essential oils volume estimates and forecasts, by product, 2018 - 2030 (USD Thousands)
TABLE 85 Canada essential oils volume estimates and forecasts, by application, 2018 - 2030 (Tons)
TABLE 86 Canada essential oils volume estimates and forecasts, by application, 2018 - 2030 (USD Thousands)
TABLE 87 Canada essential oils volume estimates and forecasts, product by application, 2018 - 2030 (Tons)
TABLE 88 Canada essential oils volume estimates and forecasts, product by application, 2018 - 2030 (USD Thousands)
TABLE 89 Mexico essential oils volume estimates and forecasts, by product, 2018 - 2030 (Tons)
TABLE 90 Mexico essential oils volume estimates and forecasts, by product, 2018 - 2030 (USD Thousands)
TABLE 91 Mexico essential oils volume estimates and forecasts, by application, 2018 - 2030 (Tons)
TABLE 92 Mexico essential oils volume estimates and forecasts, by application, 2018 - 2030 (USD Thousands)
TABLE 93 Mexico essential oils volume estimates and forecasts, product by application, 2018 - 2030 (Tons)
TABLE 94 Mexico essential oils volume estimates and forecasts, product by application, 2018 - 2030 (USD Thousands)
TABLE 95 Europe essential oils volume estimates and forecasts, by product, 2018 - 2030 (Tons)
TABLE 96 Europe essential oils volume estimates and forecasts, by product, 2018 - 2030 (USD Thousands)
TABLE 97 Europe essential oils volume estimates and forecasts, by application, 2018 - 2030 (Tons)
TABLE 98 Europe essential oils volume estimates and forecasts, by application, 2018 - 2030 (USD Thousands)
TABLE 99 Europe essential oils volume estimates and forecasts, product by application, 2018 - 2030 (Tons)
TABLE 100 Europe essential oils volume estimates and forecasts, product by application, 2018 - 2030 (USD Thousands)
TABLE 101 Germany essential oils volume estimates and forecasts, by product, 2018 - 2030 (Tons)
TABLE 102 Germany essential oils volume estimates and forecasts, by product, 2018 - 2030 (USD Thousands)
TABLE 103 Germany essential oils volume estimates and forecasts, by application, 2018 - 2030 (Tons)
TABLE 104 Germany essential oils volume estimates and forecasts, by application, 2018 - 2030 (USD Thousands)
TABLE 105 Germany essential oils volume estimates and forecasts, product by application, 2018 - 2030 (Tons)
TABLE 106 Germany essential oils volume estimates and forecasts, product by application, 2018 - 2030 (USD Thousands)
TABLE 107 France essential oils volume estimates and forecasts, by product, 2018 - 2030 (Tons)
TABLE 108 France essential oils volume estimates and forecasts, by product, 2018 - 2030 (USD Thousands)
TABLE 109 France essential oils volume estimates and forecasts, by application, 2018 - 2030 (Tons)
TABLE 110 France essential oils volume estimates and forecasts, by application, 2018 - 2030 (USD Thousands)
TABLE 111 France essential oils volume estimates and forecasts, product by application, 2018 - 2030 (Tons)
TABLE 112 France essential oils volume estimates and forecasts, product by application, 2018 - 2030 (USD Thousands)
TABLE 113 UK essential oils volume estimates and forecasts, by product, 2018 - 2030 (Tons)
TABLE 114 UK essential oils volume estimates and forecasts, by product, 2018 - 2030 (USD Thousands)
TABLE 115 UK essential oils volume estimates and forecasts, by application, 2018 - 2030 (Tons)
TABLE 116 UK essential oils volume estimates and forecasts, by application, 2018 - 2030 (USD Thousands)
TABLE 117 UK essential oils volume estimates and forecasts, product by application, 2018 - 2030 (Tons)
TABLE 118 UK essential oils volume estimates and forecasts, product by application, 2018 - 2030 (USD Thousands)
TABLE 119 Spain essential oils volume estimates and forecasts, by product, 2018 - 2030 (Tons)
TABLE 120 Spain essential oils volume estimates and forecasts, by product, 2018 - 2030 (USD Thousands)
TABLE 121 Spain essential oils volume estimates and forecasts, by application, 2018 - 2030 (Tons)
TABLE 122 Spain essential oils volume estimates and forecasts, by application, 2018 - 2030 (USD Thousands)
TABLE 123 Spain essential oils volume estimates and forecasts, product by application, 2018 - 2030 (Tons)
TABLE 124 Spain essential oils volume estimates and forecasts, product by application, 2018 - 2030 (USD Thousands)
TABLE 125 Italy essential oils volume estimates and forecasts, by product, 2018 - 2030 (Tons)
TABLE 126 Italy essential oils volume estimates and forecasts, by product, 2018 - 2030 (USD Thousands)
TABLE 127 Italy essential oils volume estimates and forecasts, by application, 2018 - 2030 (Tons)
TABLE 128 Italy essential oils volume estimates and forecasts, by application, 2018 - 2030 (USD Thousands)
TABLE 129 Italy essential oils volume estimates and forecasts, product by application, 2018 - 2030 (Tons)
TABLE 130 Italy essential oils volume estimates and forecasts, product by application, 2018 - 2030 (USD Thousands)
TABLE 131 Asia Pacific essential oils volume estimates and forecasts, by product, 2018 - 2030 (Tons)
TABLE 132 Asia Pacific essential oils volume estimates and forecasts, by product, 2018 - 2030 (USD Thousands)
TABLE 133 Asia Pacific essential oils volume estimates and forecasts, by application, 2018 - 2030 (Tons)
TABLE 134 Asia Pacific essential oils volume estimates and forecasts, by application, 2018 - 2030 (USD Thousands)
TABLE 135 Asia Pacific essential oils volume estimates and forecasts, product by application, 2018 - 2030 (Tons)
TABLE 136 Asia Pacific essential oils volume estimates and forecasts, product by application, 2018 - 2030 (USD Thousands)
TABLE 137 China essential oils volume estimates and forecasts, by product, 2018 - 2030 (Tons)
TABLE 138 China essential oils volume estimates and forecasts, by product, 2018 - 2030 (USD Thousands)
TABLE 139 China essential oils volume estimates and forecasts, by application, 2018 - 2030 (Tons)
TABLE 140 China essential oils volume estimates and forecasts, by application, 2018 - 2030 (USD Thousands)
TABLE 141 China essential oils volume estimates and forecasts, product by application, 2018 - 2030 (Tons)
TABLE 142 China essential oils volume estimates and forecasts, product by application, 2018 - 2030 (USD Thousands)
TABLE 143 India essential oils volume estimates and forecasts, by product, 2018 - 2030 (Tons)
TABLE 144 India essential oils volume estimates and forecasts, by product, 2018 - 2030 (USD Thousands)
TABLE 145 India essential oils volume estimates and forecasts, by application, 2018 - 2030 (Tons)
TABLE 146 India essential oils volume estimates and forecasts, by application, 2018 - 2030 (USD Thousands)
TABLE 147 India essential oils volume estimates and forecasts, product by application, 2018 - 2030 (Tons)
TABLE 148 India essential oils volume estimates and forecasts, product by application, 2018 - 2030 (USD Thousands)
TABLE 149 Japan essential oils volume estimates and forecasts, by product, 2018 - 2030 (Tons)
TABLE 150 Japan essential oils volume estimates and forecasts, by product, 2018 - 2030 (USD Thousands)
TABLE 151 Japan essential oils volume estimates and forecasts, by application, 2018 - 2030 (Tons)
TABLE 152 Japan essential oils volume estimates and forecasts, by application, 2018 - 2030 (USD Thousands)
TABLE 153 Japan essential oils volume estimates and forecasts, product by application, 2018 - 2030 (Tons)
TABLE 154 Japan essential oils volume estimates and forecasts, product by application, 2018 - 2030 (USD Thousands)
TABLE 155 Taiwan essential oils volume estimates and forecasts, by product, 2018 - 2030 (Tons)
TABLE 156 Taiwan essential oils volume estimates and forecasts, by product, 2018 - 2030 (USD Thousands)
TABLE 157 Taiwan essential oils volume estimates and forecasts, by application, 2018 - 2030 (Tons)
TABLE 158 Taiwan essential oils volume estimates and forecasts, by application, 2018 - 2030 (USD Thousands)
TABLE 159 Taiwan essential oils volume estimates and forecasts, product by application, 2018 - 2030 (Tons)
TABLE 160 Taiwan essential oils volume estimates and forecasts, product by application, 2018 - 2030 (USD Thousands)
TABLE 161 South Korea essential oils volume estimates and forecasts, by product, 2018 - 2030 (Tons)
TABLE 162 South Korea essential oils volume estimates and forecasts, by product, 2018 - 2030 (USD Thousands)
TABLE 163 South Korea essential oils volume estimates and forecasts, by application, 2018 - 2030 (Tons)
TABLE 164 South Korea essential oils volume estimates and forecasts, by application, 2018 - 2030 (USD Thousands)
TABLE 165 South Korea essential oils volume estimates and forecasts, product by application, 2018 - 2030 (Tons)
TABLE 166 South Korea essential oils volume estimates and forecasts, product by application, 2018 - 2030 (USD Thousands)
TABLE 167 Singapore essential oils volume estimates and forecasts, by product, 2018 - 2030 (Tons)
TABLE 168 Singapore essential oils volume estimates and forecasts, by product, 2018 - 2030 (USD Thousands)
TABLE 169 Singapore essential oils volume estimates and forecasts, by application, 2018 - 2030 (Tons)
TABLE 170 Singapore essential oils volume estimates and forecasts, by application, 2018 - 2030 (USD Thousands)
TABLE 171 Singapore essential oils volume estimates and forecasts, product by application, 2018 - 2030 (Tons)
TABLE 172 Singapore essential oils volume estimates and forecasts, product by application, 2018 - 2030 (USD Thousands)
TABLE 173 Australia essential oils volume estimates and forecasts, by product, 2018 - 2030 (Tons)
TABLE 174 Australia essential oils volume estimates and forecasts, by product, 2018 - 2030 (USD Thousands)
TABLE 175 Australia essential oils volume estimates and forecasts, by application, 2018 - 2030 (Tons)
TABLE 176 Australia essential oils volume estimates and forecasts, by application, 2018 - 2030 (USD Thousands)
TABLE 177 Australia essential oils volume estimates and forecasts, product by application, 2018 - 2030 (Tons)
TABLE 178 Australia essential oils volume estimates and forecasts, product by application, 2018 - 2030 (USD Thousands)
TABLE 179 Middle East & Africa essential oils volume estimates and forecasts, by product, 2018 - 2030 (Tons)
TABLE 180 Middle East & Africa essential oils volume estimates and forecasts, by product, 2018 - 2030 (USD Thousands)
TABLE 181 Middle East & Africa essential oils volume estimates and forecasts, by application, 2018 - 2030 (Tons)
TABLE 182 Middle East & Africa essential oils volume estimates and forecasts, by application, 2018 - 2030 (USD Thousands)
TABLE 183 Middle East & Africa essential oils volume estimates and forecasts, product by application, 2018 - 2030 (Tons)
TABLE 184 Middle East & Africa essential oils volume estimates and forecasts, product by application, 2018 - 2030 (USD Thousands)
TABLE 185 Central America essential oils volume estimates and forecasts, by product, 2018 - 2030 (Tons)
TABLE 186 Central America essential oils volume estimates and forecasts, by product, 2018 - 2030 (USD Thousands)
TABLE 187 Central America essential oils volume estimates and forecasts, by application, 2018 - 2030 (Tons)
TABLE 188 Central America essential oils volume estimates and forecasts, by application, 2018 - 2030 (USD Thousands)
TABLE 189 Central America essential oils volume estimates and forecasts, product by application, 2018 - 2030 (Tons)
TABLE 190 Central America essential oils volume estimates and forecasts, product by application, 2018 - 2030 (USD Thousands)
TABLE 191 South America essential oils volume estimates and forecasts, by product, 2018 - 2030 (Tons)
TABLE 192 South America essential oils volume estimates and forecasts, by product, 2018 - 2030 (USD Thousands)
TABLE 193 South America essential oils volume estimates and forecasts, by application, 2018 - 2030 (Tons)
TABLE 194 South America essential oils volume estimates and forecasts, by application, 2018 - 2030 (USD Thousands)
TABLE 195 South America essential oils volume estimates and forecasts, product by application, 2018 - 2030 (Tons)
TABLE 196 South America essential oils volume estimates and forecasts, product by application, 2018 - 2030 (USD Thousands)
TABLE 197 Brazil essential oils volume estimates and forecasts, by product, 2018 - 2030 (Tons)
TABLE 198 Brazil essential oils volume estimates and forecasts, by product, 2018 - 2030 (USD Thousands)
TABLE 199 Brazil essential oils volume estimates and forecasts, by application, 2018 - 2030 (Tons)
TABLE 200 Brazil essential oils volume estimates and forecasts, by application, 2018 - 2030 (USD Thousands)
TABLE 201 Brazil essential oils volume estimates and forecasts, product by application, 2018 - 2030 (Tons)
TABLE 202 Brazil essential oils volume estimates and forecasts, product by application, 2018 - 2030 (USD Thousands)
TABLE 203 Argentina essential oils volume estimates and forecasts, by product, 2018 - 2030 (Tons)
TABLE 204 Argentina essential oils volume estimates and forecasts, by product, 2018 - 2030 (USD Thousands)
TABLE 205 Argentina essential oils volume estimates and forecasts, by application, 2018 - 2030 (Tons)
TABLE 206 Argentina essential oils volume estimates and forecasts, by application, 2018 - 2030 (USD Thousands)
TABLE 207 Argentina essential oils volume estimates and forecasts, product by application, 2018 - 2030 (Tons)
TABLE 208 Argentina essential oils volume estimates and forecasts, product by application, 2018 - 2030 (USD Thousands)
TABLE 209 Middle East & Africa essential oils volume estimates and forecasts, by product, 2018 - 2030 (Tons)
TABLE 210 Middle East & Africa essential oils volume estimates and forecasts, by product, 2018 - 2030 (USD Thousands)
TABLE 211 Middle East & Africa essential oils volume estimates and forecasts, by application, 2018 - 2030 (Tons)
TABLE 212 Middle East & Africa essential oils volume estimates and forecasts, by application, 2018 - 2030 (USD Thousands)
TABLE 213 Middle East & Africa essential oils volume estimates and forecasts, product by application, 2018 - 2030 (Tons)
TABLE 214 Middle East & Africa essential oils volume estimates and forecasts, product by application, 2018 - 2030 (USD Thousands)
TABLE 215 Highest grossing essential oils in the U.S. retail aromatherapy industry, (By value)
TABLE 216 China- Import data for key cosmetics and personal care products
TABLE 217 Major essential oil plants in India and their use
TABLE 218 South Korea- Import data for key cosmetics and personal care products import data
TABLE 219 Global essential oils market vendor landscape
List of Figures
FIG. 1 Industry snapshot
FIG. 2 Essential oils market segmentation
FIG. 3 Essential oils market size and growth prospects
FIG. 4 Essential oils market value chain analysis
FIG. 5 Essential oils market dynamics
FIG. 6 Key opportunities prioritized
FIG. 7 Essential oils market– Porter’s analysis
FIG. 8 Essential oils Macro-Economic analysis
FIG. 9 Average prices of acorus calamus essential oil 2018 to 2030 (USD/Kg)
FIG. 10 Average prices of ajowan essential oil 2018 to 2030 (USD/Kg)
FIG. 11 Average prices of basil essential oil 2018 to 2030 (USD/Kg)
FIG. 12 Average prices of black pepper essential oil 2018 - 2030 (USD/Kg)
FIG. 13 Average prices of cardamom essential oil 2018 to 2030 (USD/Kg)
FIG. 14 Average prices of carrot seed essential oil 2018 to 2030 (USD/Kg)
FIG. 15 Average prices of cassia essential oil 2018 to 2030 (USD/Kg)
FIG. 16 Average prices of cedarwood essential oil 2018 to 2030 (USD/Kg)
FIG. 17 Average prices of celery essential oil 2018 - 2030 (USD/Kg)
FIG. 18 Average prices of cinnamon essential oil 2018 - 2030 (USD/Kg)
FIG. 19 Average prices of citronella essential oil 2018 - 2030 (USD/Kg)
FIG. 20 Average prices of Ciz-3 hexanol essential oil 2018 to 2030 (USD/Kg)
FIG. 21 Average prices of clove essential oil 2018 - 2030 (USD/Kg)
FIG. 22 Average prices of cornmint essential oil 2018 - 2030 (USD/Kg)
FIG. 23 Average prices of cumin seed essential oil 2018 - 2030 (USD/Kg)
FIG. 24 Average prices of curry leaf essential oil 2018 - 2030 (USD/Kg)
FIG. 25 Average prices of cypriol essential oil 2018 to 2030 (USD/Kg)
FIG. 26 Average prices of davana essential oil 2018 to 2030 (USD/Kg)
FIG. 27 Average prices of dill seed essential oil 2018 to 2030 (USD/Kg)
FIG. 28 Average prices of De-Mentholised Peppermint essential oil 2018 to 2030 (USD/Kg)
FIG. 29 Average prices of eucalyptus essential oil 2018 to 2030 (USD/Kg)
FIG. 30 Average prices of fennel essential oil 2018 to 2030 (USD/Kg)
FIG. 31 Average prices of frankincense essential oil 2018 to 2030 (USD/Kg)
FIG. 32 Average prices of garlic essential oil 2018 - 2030 (USD/Kg)
FIG. 33 Average prices of ginger essential oil 2018 - 2030 (USD/Kg)
FIG. 34 Average prices of holy basil essential oil 2018 - 2030 (USD/Kg)
FIG. 35 Average prices of juniper berry essential oil 2018 - 2030 (USD/Kg)
FIG. 36 Average prices of lemon essential oil 2018 to 2030 (USD/Kg)
FIG. 37 Average prices of lemongrass essential oil 2018 to 2030 (USD/Kg)
FIG. 38 Average prices of lime essential oil 2018 to 2030 (USD/Kg)
FIG. 39 Average prices of mace essential oil 2018 to 2030 (USD/Kg)
FIG. 40 Average prices of mustard essential oil 2018 to 2030 (USD/Kg)
FIG. 41 Average prices of neem essential oil 2018 to 2030 (USD/Kg)
FIG. 42 Average prices of nutmeg essential oil 2018 to 2030 (USD/Kg)
FIG. 43 Average prices of orange essential oil 2018 to 2030 (USD/Kg)
FIG. 44 Average prices of palmarosa essential oil 2018 to 2030 (USD/Kg)
FIG. 45 Average prices of peppermint essential oil 2018 to 2030 (USD/Kg)
FIG. 46 Average prices of rosemary essential oil 2018 to 2030 (USD/Kg)
FIG. 47 Average prices of spearmint essential oil 2018 to 2030 (USD/Kg)
FIG. 48 Average prices of turmeric essential oil 2018 to 2030 (USD/Kg)
FIG. 49 Average prices of vetiver essential oil 2018 to 2030 (USD/Kg)
FIG. 50 Some major essential oils and their medical benefits
FIG. 51 Global essential oils revenue share, by region, 2018 to 2030 (CAGR %)
Market Segmentation
The cosmetics and personal care industries are increasingly utilizing essential oils as alternatives for conventional chemical-based additives products to improve the product value and sensory appeal. These oils are help promote skin elasticity, firmness, as well as treat acne, stretch marks, and dermatitis. They also contribute to enhanced hair and nail health. The growing population of working women paired with the increasing disposable income among consumers are expected to be major growth drivers in the personal care industry. The increasing awareness regarding feminine health and hygiene has also augmented the use of organic products and cosmetics. The mature markets including the U.S. and the UK are witnessing a remarkable demand for organic personal care products. Major cosmetic brands such as Annemarie Borlind, Melvita, JĀSÖN, and Avalon Organics have increased the content of natural ingredients in their products. The increasing desire to benefit from organically sourced products is backed by and growing consumer awareness regarding adverse effects of chemicals in toiletries and cosmetics and high purchasing power.
Flavors and fragrances are formulated using volatile chemicals and essential oils to enhance existing flavors or deliver a specified flavor. These additives offer long-lasting sensory impressions, often identified by taste and smell chemicals when added subtly in food, beverages, medical products, and other substances. These products boost the overall aesthetic value and appeal of the products. The increasing consumer demand for fresh and organic products has exponentially contributed to the segment growth. Further, the surge in demand for ready-to-eat meals and wellness foods is expected to boost the demand for food flavors and fragrances. Increasing consumer disposable incomes in emerging economies including China and India are also projected to foster the market demand over the forecast period.
Essential oils also play an important role in aromatherapy, spa, and relaxation practices. These oils help promote relaxation, reduce stress, and improve the overall well-being. Oils used in this arena are derived from lavender, jojoba, avocado, almond, grape seed, coconut, and other fragrant plants. Increasing consumer spending on relaxation and spa treatments is expected to boost the demand for essential oil-based fragrances. Numerous other end-use industries such as household cleaning agents and disinfectants are increasingly utilizing fragrant oils to create consumer interest.
Essential oils contain volatile aroma compounds that include concentrated hydrophobic liquid originated from plant matter such as roots, leaves, stems, flowers, and other parts. Large quantities of plant matter are distilled or infused to derive small volumes of oils. Some of the instances of extortionate amounts of plant matter processed include:
50 to 60 pounds of eucalyptus leaves & branch tops to produce one pound of eucalyptus oil
200 to 250 pounds of lavender flower spikes to produce one pound of lavender oil
2,000 pounds of cypress twigs, stem, and leaves to produce one pound of cypress oil
10,000 pounds of rose blossoms to produce one pound of rose oil
Several forests have been chopped down to deliver small quantities of extracts. Many arable lands have also been functioning as monoculture farming lands to harvest a single plant or crop for formulating a particular oil. It is thus becoming increasingly challenging to cultivate enough plants to deliver one pound of oil. Stringent federal regulations regarding farming and cultivation as well as environmental impact of these operations have restricted excessive farming activities and decreased the supply of crops for essential oils production. Further, raw materials used in these oils and derived fragrances are highly susceptible to natural disasters, changing agricultural practices, disease outbreaks, and political upheaval. These factors have also contributed to rising flower prices and high end-product prices.
This section will provide insights into the contents included in this essential oils market report and help gain clarity on the structure of the report to assist readers in navigating smoothly.
Industry overview
Industry trends
Market drivers and restraints
Market size
Growth prospects
Porter’s analysis
PESTEL analysis
Key market opportunities prioritized
Competitive landscape
Company overview
Financial performance
Product benchmarking
Latest strategic developments
Market size, estimates, and forecast from 2018 to 2030
Market estimates and forecast for product segments up to 2030
Regional market size and forecast for product segments up to 2030
Market estimates and forecast for application segments up to 2030
Regional market size and forecast for application segments up to 2030
Company financial performance
A three-pronged approach was followed for deducing the essential oils market estimates and forecasts. The process has three steps: information procurement, analysis, and validation. The whole process is cyclical, and steps repeat until the estimates are validated. The three steps are explained in detail below:
Information procurement: Information procurement is one of the most extensive and important stages in our research process, and quality data is critical for accurate analysis. We followed a multi-channel data collection process for essential oils market to gather the most reliable and current information possible.
Analysis: We mine the data collected to establish baselines for forecasting, identify trends and opportunities, gain insight into consumer demographics and drivers, and so much more. We utilized different methods of essential oils market data depending on the type of information we’re trying to uncover in our research.
Market Research Efforts: Bottom-up Approach for estimating and forecasting demand size and opportunity, top-down Approach for new product forecasting and penetration, and combined approach of both Bottom-up and Top-down for full coverage analysis.
Value-Chain-Based Sizing & Forecasting: Supply-side estimates for understanding potential revenue through competitive benchmarking, forecasting, and penetration modeling.
Demand-side estimates for identifying parent and ancillary markets, segment modeling, and heuristic forecasting.
Qualitative Functional Deployment (QFD) Modelling for market share assessment.
Market formulation and validation: We mine the data collected to establish baselines for forecasting, identify trends and opportunities, gain insight into consumer demographics and drivers, and so much more. We utilize different methods of data analysis depending on the type of information we’re trying to uncover in our research.
Market Formulation: This step involves the finalization of market numbers. This step on an internal level is designed to manage outputs from the Data Analysis step.
Data Normalization: The final market estimates and forecasts are then aligned and sent to industry experts, in-panel quality control managers for validation.
This step also entails the finalization of the report scope and data representation pattern.
Validation: The process entails multiple levels of validation. All these steps run in parallel, and the study is forwarded for publishing only if all three levels render validated results.
The essential oils market was categorized into four segments, namely product (Acorus Calamus, Ajowan, Basil, Black Pepper, Cardamom, Carrot Seed, Cassia, Cedarwood, Celery, Cinnamon, Citronella, Ciz-3 Hexanol, Clove, Cornmint, Cumin Seed, Curry, Leaf, Cypress, Cypriol, Davana, Dill Seed, De-Mentholised Peppermint, Eucalyptus, Fennel, Frankincense, Garlic, Ginger, Holy Basil, Juniper Berry, Lavender, Lemon, Lemongrass, Lime, Mace, Mustard, Neem, Nutmeg, Orange, Palmarosa, Patchouli, Pepper Mint, Rosemary, Spearmint, Tangerine, Tea Tree, Turmeric, Vetiver, Ylang Ylang), application (Medical, Food & Beverages, Spa & Relaxation), sales channel (Direct Selling) and region (North America, Europe, Asia Pacific, Middle East & Africa, Central America, South America).
The essential oils market was segmented into product, application, sales channel and regions. The demand at a segment level was deduced using a funnel method. Concepts like the TAM, SAM, SOM, etc., were put into practice to understand the demand. We at GVR deploy three methods to deduce market estimates and determine forecasts. These methods are explained below:
Demand estimation of each product across countries/regions summed up to from the total market.
Variable analysis for demand forecast.
Demand estimation via analyzing paid database, and company financials either via annual reports or paid database.
Primary interviews for data revalidation and insight collection.
Used extensively for new product forecasting or analyzing penetration levels.
Tool used invoice product flow and penetration models Use of regression multi-variant analysis for forecasting Involves extensive use of paid and public databases.
Primary interviews and vendor-based primary research for variable impact analysis.
The essential oils market was analyzed at a regional level. The globe was divided into North America, Europe, Asia Pacific, Middle East & Africa, Central America, South America, keeping in focus variables like consumption patterns, export-import regulations, consumer expectations, etc. These regions were further divided into thirteen countries, namely, the U.S.; Canada; Mexico; Germany; the UK.; France; China; India; Japan; Taiwan; South Korea; Singapore; Australia.
All three above-mentioned market research methodologies were applied to arrive at regional-level conclusions. The regions were then summed up to form the global market.
The essential oils market was analyzed via companies operating in the sector. Analyzing these companies and cross-referencing them to the demand equation helped us validate our assumptions and conclusions. Key market players analyzed include:
Symrise -Symrise offers fragrances, flavorings, cosmetic ingredients, functional ingredients, and nutritional & sensorial extracts. The products developed by the company are adopted in food, beverages, personal care & cosmetics, perfumes, pet food, cleaning, and laundry detergent applications. Symrise operates through three business segments, including Flavor, Nutrition, and Scent & Care. The flavor segment comprises Savory, Beverages, and Sweet business units, which offer over 13,000+ unique flavorings. This diverse range of flavors are utilized by the food and beverage industry in their product formulations. The nutrition segment consists of Food, Probi, Pet Food, and Aqua business units. The Scent & Care segment comprises Cosmetic Ingredients Fragrance and Aroma Molecules divisions.
MANE - MANE is primarily engaged in the development, formulation, and distribution of specialty ingredients for cosmetics, food & beverage, pharmaceutical, chemical, soaps & detergents, and tobacco industries. The company operates through three business divisions, including Flavor, Fragrance, and Ingredients. Its product portfolio comprises aromatic raw materials such as essential oils, isolates, absolutes, active pharmaceutical ingredients, resinoids, extracts, flavouring substances, natural & synthetic flavors, and savory additives mixtures, among others. MANE has over 50 R&D facilities and it is actively engaged in R&D activities. The company has a global presence with over 27 manufacturing sites in 39 countries.
Flavex Naturextrakte GmbH- Flavex Naturextrakte GmbH produces and distributes fragrances, flavors, and essential oils. The company’s clientele includes businesses in the food, skincare, nutraceutical, and perfumery industries. Since its inception, the company has invested in diverse R&D initiatives to optimize its production processes. Flavex employs specialists who have profound experience in analytical procedures and photochemistry. The company offers a widespread range of botanical extracts and CO2-based extracts that are integrated in producing food flavors and natural remedies.
Firmenich SA- Firmenich SA is a biotechnology-centric company that manufactures and distributes flavors and fragrances across the world. The products of the company cater to food, beverage, cosmetics, personal care, and perfumery end-use industries, among others. Jasmine Concrete (India), Essex Laboratories (Oregon, U.S.), and Nelixia (Guatemala) are some of the supplier partners of the company. Its client base includes a wide range of consumers, from multinationals to SMEs.The company has presence in over 100 countries which includes 46 manufacturing units and 6 R&D centers.
Synthite Industries Ltd. - Synthite Industries Ltd. offers plant-derived food ingredients, application-specific solutions, and value-added products. The company serves its products to various end-use applications including food, fragrance, cosmetics, aromatherapy, and nutraceuticals. Its vast product portfolio encompasses over 500 products including essential oils, organic extracts, spice oleoresins, health ingredients, floral concretes, resinoids, and absolutes. The company has over 8 manufacturing facilities out of which three are located in Kerala and two in Andhra Pradesh. Other facilities are located in Coimbatore, Karnataka, and China.
ROBERTET GROUP - ROBERTET GROUP develops and distributes specialty ingredients for the flavor, fragrance, food & beverage, cosmetics, and healthcare industries. In addition, the company also develops in-house flavors and fragrances and supplies them to end-use industries for formulating consumer products. The company operates through 4 business divisions, including Natural Raw Material, Flavor, Fragrance, and Active Ingredients. The raw materials division produces a wide range of ingredients such as essential oils, aroma chemicals, fractions, isolates, oleoresins, and floral extracts for aromatherapy, fragrance, flavor, health, and beauty applications. The flavors division offers unique solutions for food and pharmaceutical applications for their inclusion in products such as ready-to-eat meals, dairy, confectionery, and flavored drinks. The fragrance division caters to the personal care, cleaning, and perfume industries, wherein its client base includes small to large national and international brands. The active ingredients divisions cater its products specifically to the health and beauty industries through its subsidiaries, Bionov and Hitex.
International Flavors & Fragrances Inc. - International Flavors & Fragrances Inc. produces and supplies a wide range of ingredients and compounds across the world. The company operates through three business segments, including Taste, Scent, and Frutarom. The taste segment includes savory solutions, flavor compounds, nutrition & specialty ingredients and inclusions. Savory solutions comprise seasonings, natural colors, powder flavors, natural antioxidants, and functional ingredients, which cater to the meat and fish industries. Nutrition and specialty ingredients include natural health ingredients, natural colors, and flavor ingredients such as botanical extracts, flavor extracts, essential oils, citrus products, distillates, aroma chemicals, and natural gums and resins.The scent segment includes fragrance ingredients and compounds. The ingredients category comprises natural, synthetic, active, and functional ingredients. Fragrance compounds consist of two broad groups namely consumer and fine fragrances.
Givaudan- Givaudan develops, formulates, and distributes flavor and fragrance solutions worldwide. The company delivers its services through two major business divisions, including Flavors and Fragrances. The Flavors division is segmented into beverages, dairy, savory, and sweet goods. The division innovates and develops unique ingredients, which are further used in food & beverage formulations. The Fragrance division includes fine fragrances, consumer products, and active beauty, which serve consumer markets including personal care, household, and cleaning. The company has presence across 181 locations with 77 production sites, and 69 creation centers globally.
Falcon - Falcon manufactures and distributes essential oils and carrier oils worldwide. The company’s business portfolio comprises production and supply of essential oils, carrier oils, aromatherapy oils, absolutes, and linseed oils to the pharmaceutical, personal care, nutraceutical, perfumery, and paint industries. The company has invested in various R&D initiatives to enhance its product portfolios and packaging for longer shelf life and to prevent contamination. The key products offered by the company include linseed oil, carrier oils, absolutes, and essential oils. The products are classified as aromatic oil, cosmetic oil, fragrance oil, health oil, ayurvedic oil, spa oil, fixed vegetable oil, spice oils, and herbal oils.
Takasago International Corporation -Takasago International Corporation is involved in the production and distribution of specialty ingredients across the world. The company operates across food, beverage, pharmaceutical, cosmetics, and household applications. The business segments of Takasago comprise Flavors, Fragrances, Aroma Ingredients, and Fine Chemicals. The essential oils formulated by the company are used in their fragrance formulations as well as supplied to flavor and fragrance houses for further product development. The company invests significantly in research and development activities and has over 10 R&D centers worldwide, which work on creating unique solutions that cater to customers' needs. It also has over 25 production sites located in 28 different countries across the globe.
Supply Side Estimates
Company revenue estimation via referring to annual reports, investor presentations, and Hoover’s.
Segment revenue determination via variable analysis and penetration modeling.
Competitive benchmarking to identify market leaders and their collective revenue shares.
Forecasting via analyzing commercialization rates, pipelines, market initiatives, distribution networks, etc.
Demand side estimates
Identifying parent markets and ancillary markets
Segment penetration analysis to obtain pertinent
revenue/volume
Heuristic forecasting with the help of subject matter experts
Forecasting via variable analysis
Understanding market dynamics (in terms of drivers, restraints, & opportunities) in the countries.
Understanding trends & variables in the individual countries & their impact on growth and using analytical tools to provide high-level insights into the market dynamics and the associated growth pattern.
Understanding market estimates and forecasts (with the base year as 2022, historic information from 2018 to 2020, and forecast from 2023 to 2030). Regional estimates & forecasts for each category are available and are summed up to form the global market estimates.
The report provides market value for the base year 2022 and a yearly forecast till 2030 in terms of revenue/volume or both. The market for each of the segment outlooks has been provided on region & country basis for the above-mentioned forecast period.
The key industry dynamics, major technological trends, and application markets are evaluated to understand their impact on the demand for the forecast period. The growth rates were estimated using correlation, regression, and time-series analysis.
We have used the bottom-up approach for market sizing, analyzing key regional markets, dynamics, & trends for various products and end-users. The total market has been estimated by integrating the country markets.
All market estimates and forecasts have been validated through primary interviews with the key industry participants.
Inflation has not been accounted for to estimate and forecast the market.
Numbers may not add up due to rounding off.
Europe consists of EU-8, Central & Eastern Europe, along with the Commonwealth of Independent States (CIS).
Asia Pacific includes South Asia, East Asia, Southeast Asia, and Oceania (Australia & New Zealand).
Latin America includes Central American countries and the South American continent
Middle East includes Western Asia (as assigned by the UN Statistics Division) and the African continent.
GVR strives to procure the latest and unique information for reports directly from industry experts, which gives it a competitive edge. Quality is of utmost importance to us, therefore every year we focus on increasing our experts’ panel. Primary interviews are one of the critical steps in identifying recent market trends and scenarios. This process enables us to justify and validate our market estimates and forecasts to our clients. With more than 8,000 reports in our database, we have connected with some key opinion leaders across various domains, including healthcare, technology, consumer goods, and the chemical sector. Our process starts with identifying the right platform for a particular type of report, i.e., emails, LinkedIn, seminars, or telephonic conversation, as every report is unique and requires a differentiated approach.
We send out questionnaires to different experts from various regions/ countries, which is dependent on the following factors:
Report/Market scope: If the market study is global, we send questionnaires to industry experts across various regions, including North America, Europe, Asia Pacific, Latin America, and MEA.
Market Penetration: If the market is driven by technological advancements, population density, disease prevalence, or other factors, we identify experts and send out questionnaires based on region or country dominance.
The time to start receiving responses from industry experts varies based on how niche or well-penetrated the market is. Our reports include a detailed chapter on the KoL opinion section, which helps our clients understand the perspective of experts already in the market space.
NEED A CUSTOM REPORT?
We can customize every report - free of charge - including purchasing stand-alone sections or country-level reports, as well as offer affordable discounts for start-ups & universities. Contact us now
We are GDPR and CCPA compliant! Your transaction & personal information is safe and secure. For more details, please read our privacy policy.
"The quality of research they have done for us has been excellent."