
- Home
- »
- Clinical Diagnostics
- »
-
Optical Emission Spectroscopy Market Size Report, 2033GVR Report cover

Optical Emission Spectroscopy Market (2026 - 2033)
Size, Share & Trends Analysis Report By Offerings (Equipment, Services), By Form Factor (Benchtop, Portable), By Product, By Detector, By Application, By End-use (Automotive, Oil & Gas), By Region, And Segment Forecasts
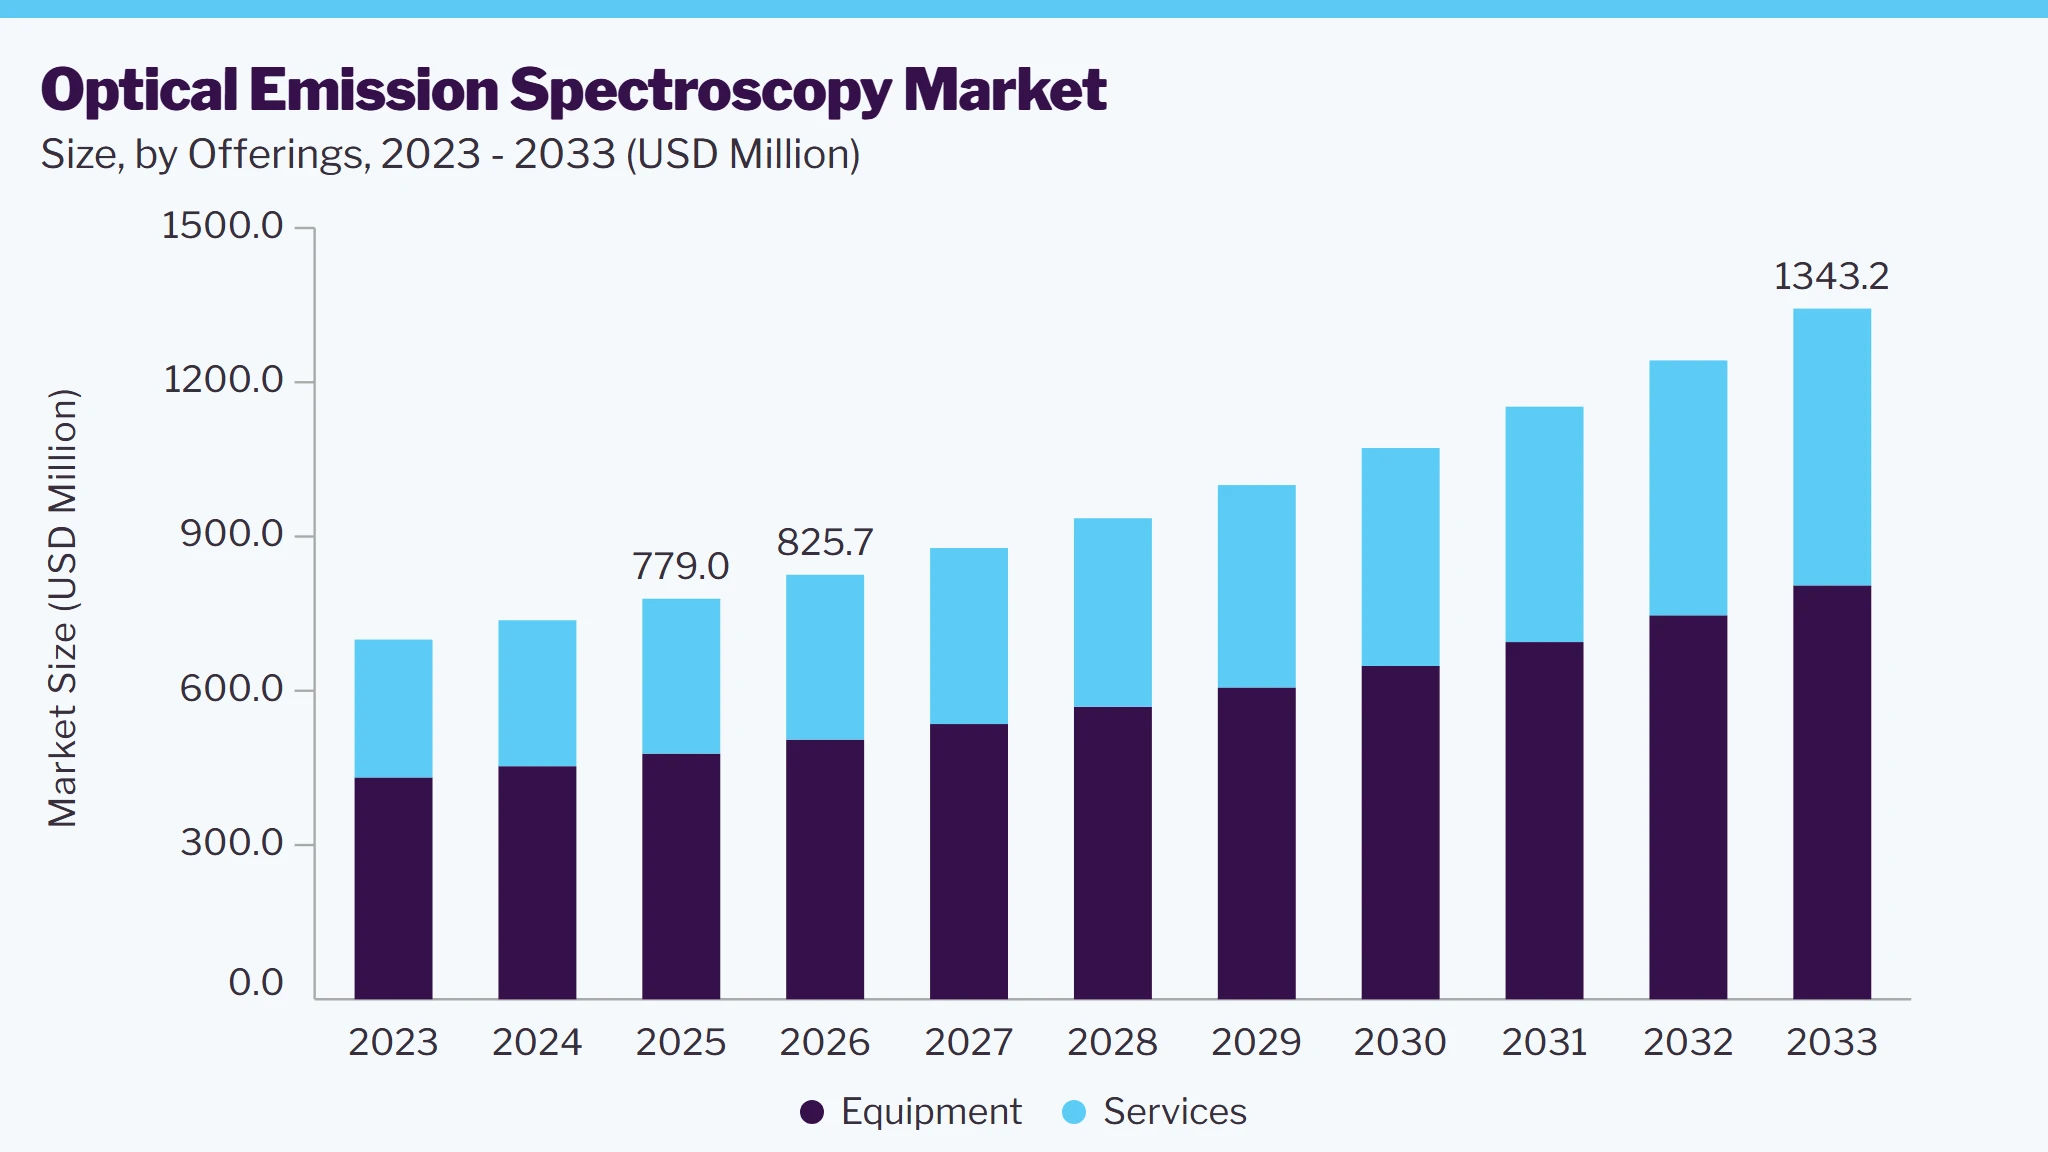
Market Size, 2025
$779.0MMarket Estimate, 2026
$825.7MMarket Forecast, 2033
$1,343.2MCAGR, 2026–2033
7.2%Optical Emission Spectroscopy Market Summary
The global optical emission spectroscopy market size was valued at USD 779.0 million in 2025 and is projected to grow from USD 825.7 million in 2026 to USD 1,343.2 million by 2033, at a CAGR of 7.2% from 2026 to 2033. North America market dominated, with a revenue share of 45.3% in 2025. This growth is attributed to the global increase in manufacturing and industrialization, strict regulatory standards, and the increasing importance of environmental monitoring. In addition, technological advancements by the leading manufacturers and the growing need for developing innovative and technologically advanced products that provide better customer outcomes is further anticipated to drive market growth.
 Source: Grand View Research, IR Documents, Primary Interviews, Paid DatabasesTo learn more about this report,
 Download Free Sample Report
 Key Market Trends & Insights
- By offerings: Equipment segment led the market with the largest revenue share of 61.3% in 2025.
- By form factor: Benchtop segment led the market with the largest revenue share of 72.3% in 2025.
- By product: Arc/Spark OES segment led the market with the largest revenue share of 63.3% in 2025.
- By detector: Solid state detector (SSD) segment led the market with the largest revenue share of 45.9% in 2025.
- By application: Chemical composition analysis segment led the market with the largest revenue share of 43.3% in 2025.
Regional Highlights
- Largest regional market: North America (45.3% revenue share, 2025)
- Fastest-growing regional market: Asia Pacific (highest CAGR, 2026-2033)
- By country: The U.S. held the largest market share in 2025.
Market Size & Forecast
- Market size in 2025: USD 779.0 Million
- Estimated market size in 2026: USD 825.7 Million
- Projected market size by 2033: USD 1,343.2 Million
- CAGR (2026-2033): 7.2%
Three ways to get this report
Buy it, customize it, or ask a question.Ask an Analyst
Analyst response in 1 business day
- AccessReport author, directly
- Reply timeWithin 1 working day
- No sales callDirect answer only
- FormatEmail reply
- CostFree, no cost
Get the Full Report
What the study covers
- FormatsPDF · Excel · Dashboard
- Timeline2026–2033 annual, 2025 base
- Coverage20+ countries, 5 regions
- Companies10+ key players profiled
Customize the Report
20% free customization
- IncludeCountries, segments, points
- TailorTo your product definition
- ExtendDeeper competitor detail
- OrA fully bespoke study
- Turnaround5–10 working days
For instance, in January 2033, the SPECTRO Analytical Instruments announced the launch of the SPECTRO ARCOS ICP-OES system, representing the next generation of industry-leading OES technology. Strict regulatory standards in industries such as automotive, aerospace, and pharmaceuticals are driving the adoption of OES to ensure compliance with safety and quality control requirements. For instance, the European Union (EU) announced the adoption of the Industrial Emissions Directive (IED) in 2010 to ensure compliance with safety and quality control requirements across various industries, particularly automotive and aerospace, further propelling the adoption of OES. Moreover, the EU has implemented a series of regulatory updates to support sectors and ensure competitiveness, including within the automotive industry. These updates encompass critical areas such as semiconductor development, raw materials sourcing, cybersecurity, data access requirements, and artificial intelligence (AI) deployment.
 To learn more about this report, Download Free Sample Report
 The growing demand from the metal and metallurgy industry is a key driver for the optical emission spectroscopy (OES) market. OES instruments are crucial in this sector, as they provide critical information about the quality and composition of metals used in various applications, from automotive and aerospace to construction. Leading providers of scientific instrumentation are focusing on developing and introducing innovative OES solutions to cater to the evolving needs of the metal industry. For instance, in November 2023, Thermo Fisher Scientific Inc. announced the launch of Thermo Scientific ARL iSpark Plus Optical Emission Spectrometer range. This newest series of OES spectrometers is tailor-made to optimize elemental analysis tasks in metal production, processing, and recycling sectors and in contract and research labs.
The growing emphasis on sustainability practices across industries is forcing companies to adopt advanced technologies such as optical emission spectroscopy (OES) to support efficient resource utilization, waste reduction, and environmental impact mitigation. OES involves the analysis of the electromagnetic radiation emitted by atoms when they are excited, providing valuable insights into the elemental composition of materials. This method facilitates effective process monitoring and empowers organizations to make data-driven decisions to improve the sustainability of their operations.
Market Dynamics
The optical emission spectroscopy market is supported by the growing need for rapid, accurate, and multi-element analysis across metallurgy, foundries, automotive, aerospace, mining, oil and gas, environmental laboratories, and research facilities. Manufacturers are increasingly using Arc/Spark OES for alloy verification, melt control, incoming-material inspection, and quality assurance, while ICP-OES is gaining adoption for trace-element analysis in environmental, food, petrochemical, geological, and industrial samples. Advances in solid-state detectors, hybrid detection systems, automated calibration, software-assisted spectral analysis, and portable instrument designs are improving analytical speed, sensitivity, and ease of use. The market is further supported by increasing demand for on-site testing and faster decision-making in production environments, scrap yards, mines, and field laboratories. For instance, in September 2021, HORIBA Scientific, a global leader in the production of high-performance spectroscopy systems and solutions, announced a partnership with Covalent Metrology, a leading North American provider of analytical services, to expand engineering and scientific access to world-class expertise and chemical analysis instruments. The new partnership announces the opening of the HORIBA Scientific North American Demonstration Lab at Covalent's Silicon Valley headquarters. This showroom is HORIBA's first demonstration lab with a partner in North America and joins their application / demo labs in their corporate offices.
The growing demand for rapid multi-element analysis is driving the optical emission spectroscopy market because manufacturers, testing laboratories, and regulatory agencies increasingly need to determine several elements from a single sample within a short analytical cycle. In metallurgy and foundries, Arc/Spark OES supports rapid verification of alloy grades, melt chemistry, and trace-element content before materials move to the next production stage. In environmental, food, mining, battery, petrochemical, and research laboratories, ICP-OES enables simultaneous or near-simultaneous determination of major, minor, and trace elements, reducing the need to run separate single-element methods. This capability improves sample throughput, lowers analysis time per element, and allows laboratories to respond more quickly to quality-control failures, contamination events, and process deviations. In March 2025, Agilent published an ICP-OES application for RoHS compliance testing that measured multiple regulated elements in plastic materials, including cadmium, chromium, lead, and mercury, using a single analytical platform. The same year, Agilent released application notes for multi-element analysis of solid-state battery electrolytes, lithium-ion battery black mass, brines used in direct lithium extraction, and precious metals. These applications show that demand is expanding beyond conventional metals testing into battery manufacturing, recycling, electronics compliance, and critical-mineral processing, where laboratories must quantify several valuable elements and impurities together rather than sequentially.
High capital and operating costs hamper the growth of the optical emission spectroscopy market by making instrument acquisition difficult for small laboratories, academic facilities, regional testing providers, foundries, and low-volume industrial users. Advanced ICP-OES and Arc/Spark OES systems require more than the purchase of the core spectrometer. A complete installation may include an autosampler, recirculating water chiller, gas-control equipment, exhaust and ventilation infrastructure, computers, analytical software, certified reference materials, sample-preparation equipment, installation, training, and multiyear maintenance support. Government procurement requirements also show that lifecycle service expenditure is an important purchasing consideration. In April 2025, the New Jersey Department of Transportation issued specifications for an optical emission spectrometer requiring installation, a one-year warranty, commonly needed replacement parts and consumables, and a guaranteed 10-year service contract included in the bid. Such requirements indicate that buyers must budget for long-term preventive maintenance, technical support, detector and optical-system servicing, and potential component replacement rather than treating OES as a one-time capital purchase. For smaller organizations, committing funds over such a long operating period can delay procurement or encourage continued use of older instruments and outsourced testing services.
The growth of portable and at-line optical emission spectroscopy systems represents a meaningful opportunity for the optical emission spectroscopy market because it brings elemental analysis closer to the point where production, maintenance, and material-handling decisions are made. Traditional laboratory OES workflows generally require operators to collect samples, transport them to a centralized laboratory, prepare the sample, perform the analysis, and communicate the result back to the production team. In foundries, scrap yards, fabrication plants, mines, oil and gas facilities, and aerospace maintenance environments, this delay can slow material acceptance, melt correction, alloy sorting, and equipment-release decisions. Mobile Arc/Spark OES systems reduce this gap by enabling users to perform high-quality chemical composition analysis directly on large components, pipelines, production-floor materials, and metal inventories that cannot be conveniently moved to a laboratory. At-line instruments provide a similar advantage by positioning the analyzer close to furnaces, casting lines, incoming-material stations, or recycling operations, allowing faster intervention when an alloy is outside specification. Government investment in critical-material processing and recycling provides another supportive demand signal. In March 2026, the U.S. Department of Energy announced up to USD 500 million to expand domestic critical-mineral processing, battery-material manufacturing, and recycling. The program includes recovery of critical minerals from manufacturing scrap and end-of-life batteries.
Analyst Perspective
The optical emission spectroscopy market is positioned for steady growth as industries place greater emphasis on rapid elemental analysis, tighter quality control, and faster production decisions. From an analyst’s perspective, the market benefits from a broad application base spanning metallurgy, foundries, automotive, aerospace, mining, oil and gas, environmental testing, food analysis, and advanced materials research. This diversity reduces dependence on any single end-use industry and supports recurring demand for equipment replacement, calibration, consumables, software, and technical services.
Offerings Insights
Based on offerings, the equipment segment led the market with the largest revenue share of 61.3% in 2025. This can be attributed to the growing demand for advanced and sophisticated OES instruments across various industries. Manufacturers are continuously focusing on investing in research and development to launch new OES equipment with enhanced features and capabilities, driving the adoption of these equipment. For Instance, in April 2020, Thermo Fisher Scientific introduced the innovative Thermo Scientific iCAP PRO Series ICP-OES platform, an instrument developed to offer quick and sensitive solutions for trace element analysis. This platform is engineered to enhance trace element analysis through its focus on rapidity, sensitivity, improved workflow efficiency, and affordability.
Services segment is projected to grow at the fastest growth rate over the forecast period. This can be attributed to the increasing demand for outsourcing analytical testing requirements from various end users. Companies increasingly prefer outsourcing their OES testing and analysis to third-party service providers rather than investing in expensive OES equipment and maintaining in-house expertise. This trend is driven by the need to reduce capital expenditure, access specialized expertise, and ensure compliance with stringent quality standards. For instance, leading OES market players such as Thermo Fisher Scientific Inc., Agilent Technologies Inc., and PerkinElmer offer customers comprehensive OES testing and analysis services across industries such as metals, automotive, aerospace, and environmental monitoring.
Form Factor Insights
Based on form factor, the benchtop segment led the market with the largest revenue share of 72.3% in 2025. Benchtop OES instruments are preferred for their ease of use, stability, and ability to provide accurate and reliable elemental analysis. They are widely used in applications such as metals and heavy machinery, automotive, aerospace, and power generation, where precise material composition analysis is critical for quality control and regulatory compliance. For instance, Thermo Fisher Scientific's ARL iSpark 8860 is a benchtop OES system designed to analyze metals and alloys, offering high-speed analysis and advanced data processing capabilities.
Portable segment is anticipated to grow significantly during the forecast period. This is attributed to the increasing demand for compact and mobile OES instruments across various industries. Portable OES systems offer advantages such as ease of use, on-site analysis capabilities, and reduced sample preparation requirements, making them suitable for remote and field applications. For Instance, Hitachi High-Tech's PMI-MASTER Smart is a portable OES system that combines high performance with a user-friendly interface, making it ideal for applications in the metals industry.
Product Insights
Based on product, the Arc/Spark OES segment led the market with the largest revenue share of 63.3% in 2025. This dominance can be attributed to the high accuracy, sensitivity, and reliability of Arc/Spark OES instruments in analyzing metallic samples. The ability of Arc/Spark OES to provide precise elemental analysis across a wide range of metals, alloys, and materials makes it a preferred choice for industries such as manufacturing, automotive, aerospace, and research laboratories. In addition, technological advancements have led to the development of Arc/Spark OES systems with enhanced features such as automation, improved detection limits, and faster analysis times, further solidifying its position in the market. The growing demand for quality control and material verification in various industries also drives the adoption of Arc/Spark OES instruments.
ICP-OES (Inductively Coupled Plasma) is anticipated to witness lucrative growth over the forecast period. This growth can be attributed to several drivers, such as its high sensitivity, multi-element analysis capabilities, and low detection limits. In environmental testing, ICP-OES is crucial for detecting trace elements in soil and water samples to ensure compliance with regulatory standards. The versatility and efficiency of ICP-OES make it a preferred choice for laboratories requiring precise elemental analysis across a wide range of applications.
Detector Insights
Based on detector, the solid state detector (SSD) segment led the market with the largest revenue share of 45.9% in 2025. Solid-state detectors are semiconductor devices that convert incident photons into electrical signals, offering high sensitivity and resolution for detecting various elements in samples. Their ability to analyze every wavelength simultaneously in the UV and visible portions of the electromagnetic spectrum makes them preferred in end user verticals such as metal analysis in environmental samples, food and beverages, pharmaceuticals, chemicals, and oil and gas.
ThePhotomultiplier Tube (PMT) segment is anticipated to grow significantly over the forecast period. The increasing demand for high-performance analytical instruments in various industries, such as healthcare, environmental monitoring, and material science, is a key driver behind the rapid adoption of PMTs. In addition, advancements in PMT technology, such as enhanced quantum efficiency and reduced noise levels, have further propelled their popularity.
Application Insights
Based on application, the chemical composition analysis segment led the market with the largest revenue share of 43.3% in 2025 and is anticipated to grow rapidly over the forecast period. The market is driven by its wide range of applications across various industries, including metallurgy, pharmaceuticals, and environmental monitoring. The increasing demand for accurate and rapid elemental analysis in materials testing and quality control processes fuels this dominance. Optical emission spectroscopy's ability to provide precise quantitative analysis of elements present in a sample makes it indispensable in ensuring product quality, compliance with regulations, and process optimization.
Material testing and quality control is the second largest segment in the market. Optical emission spectroscopy's ability to provide rapid and accurate elemental analysis of materials makes it a valuable tool for ensuring product quality and compliance with industry standards. For instance, in the automotive industry, optical emission spectroscopy is used to analyze the composition of metals in components to ensure they meet stringent performance requirements. Similarly, this technology is employed in the aerospace sector to verify the integrity of materials used in aircraft parts, contributing to enhanced safety and reliability.
End-use Insights
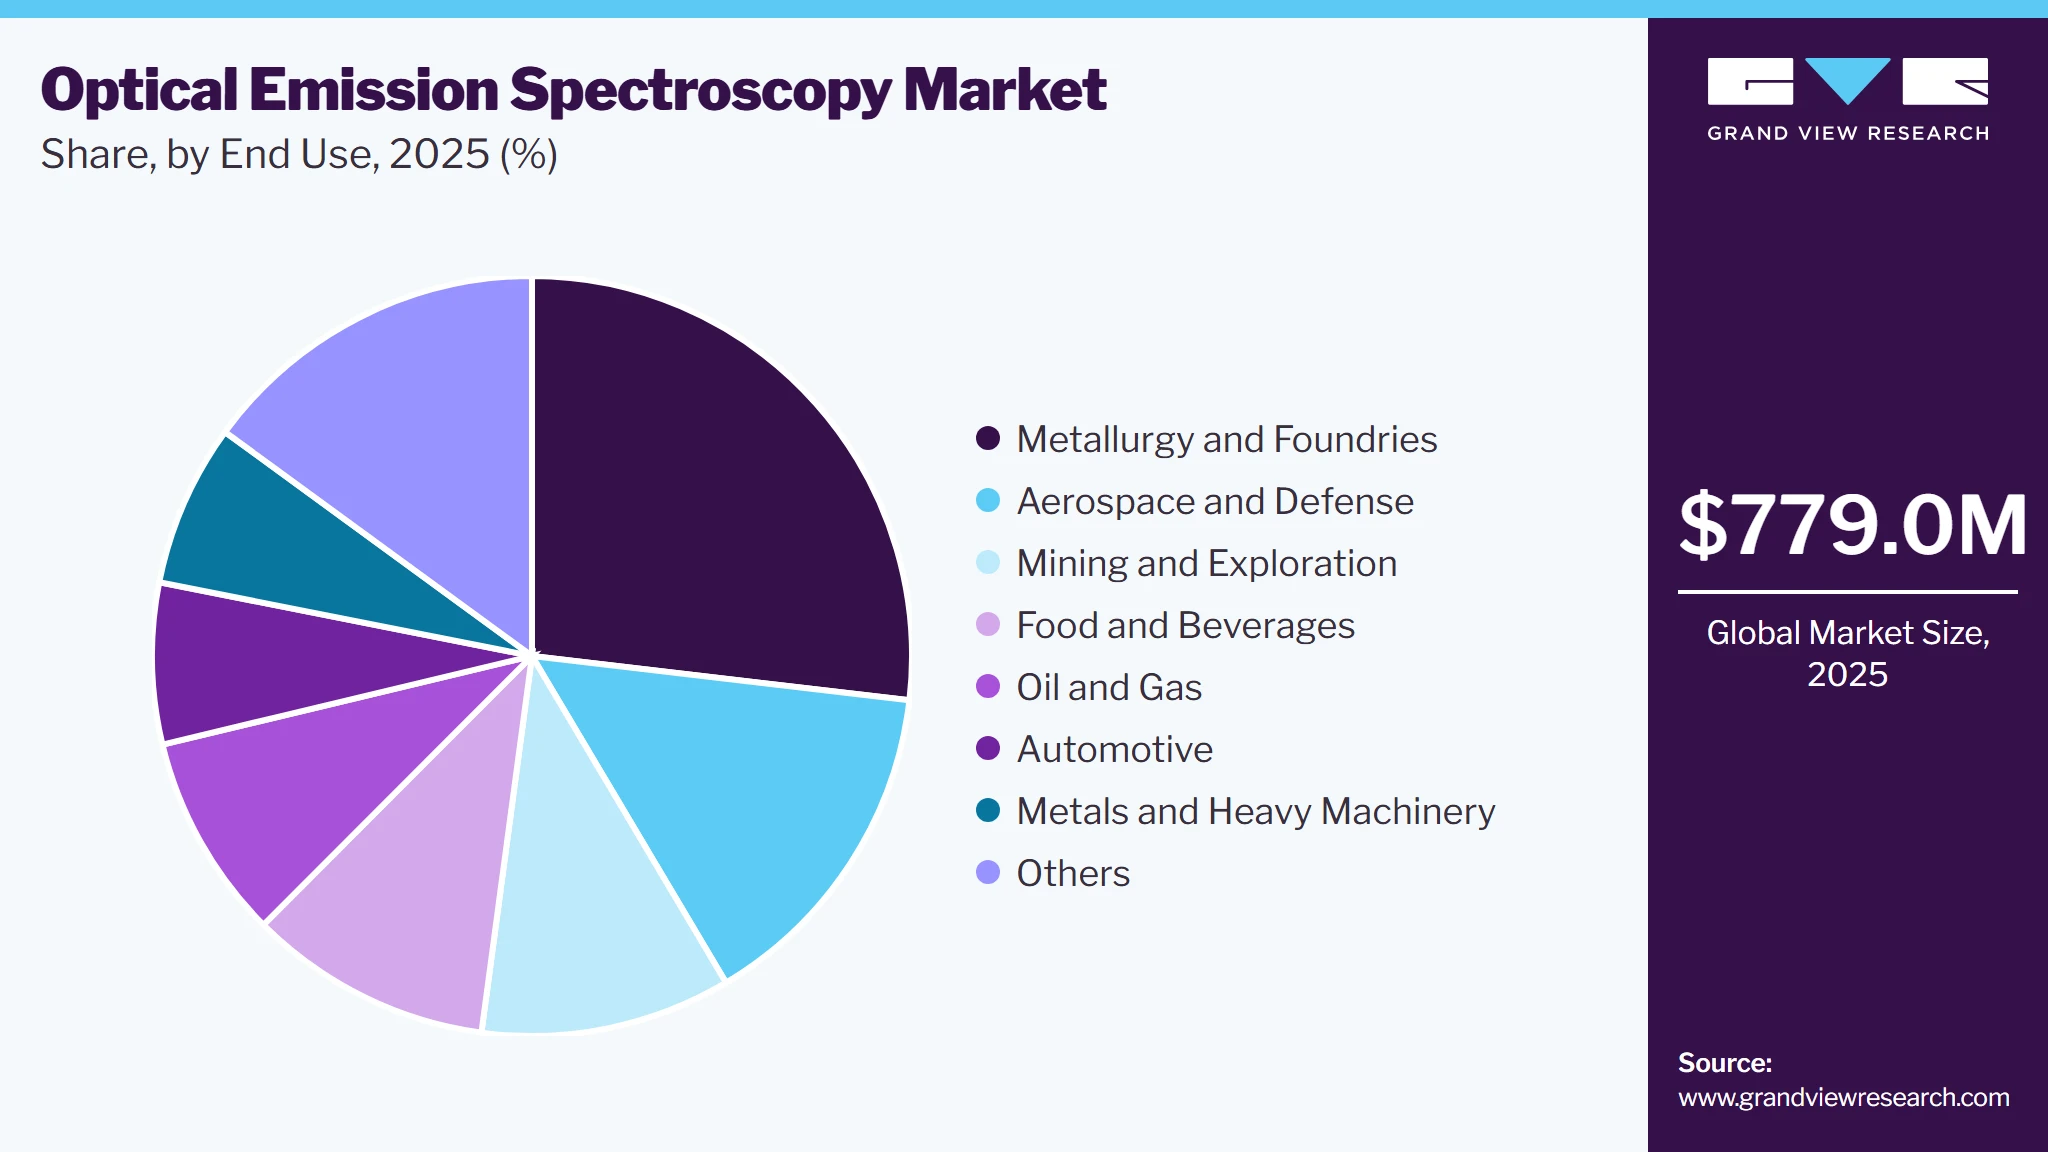
Based on end-use, the metallurgy and foundries segment led the market with the largest revenue share of 26.9% in 2025. This can be attributed to the extensive use of OES in various metallurgical applications, such as analyzing the composition of metals and alloys in foundries. OES is a crucial analytical technique for the metals industry, as it accurately determines the elemental composition of materials, ensuring quality control and compliance with industry standards. The steel manufacturers rely on optical emission microscopy to verify the chemical composition of steel alloys, enabling them to maintain the desired properties and performance characteristics. Similarly, aluminum producers use OES to analyze the composition of aluminum alloys, which is essential for producing high-quality components for the automotive, aerospace, and construction industries.
 To learn more about this report, Download Free Sample Report
 Aerospace and defense is anticipated to witness significant growth over the forecast period. Optical emission spectroscopy is widely employed in the aerospace and defense sector for analyzing metals, alloys, and other materials used in aircraft and spacecraft manufacturing. This ensures that their composition adheres to the necessary specifications and safety standards. This method is utilized to examine the composition of aluminum alloys in aircraft fuselages, wings, and landing gear to confirm their strength and durability. Similarly, it is applied to determine the composition of titanium alloys used in jet engines and other critical components, ensuring their resistance to high temperatures and stresses. The growing demand for lightweight and high-performance materials, coupled with the need for rigorous quality control measures in the aerospace and defense industry, is driving the adoption of OES market.
Regional Insights
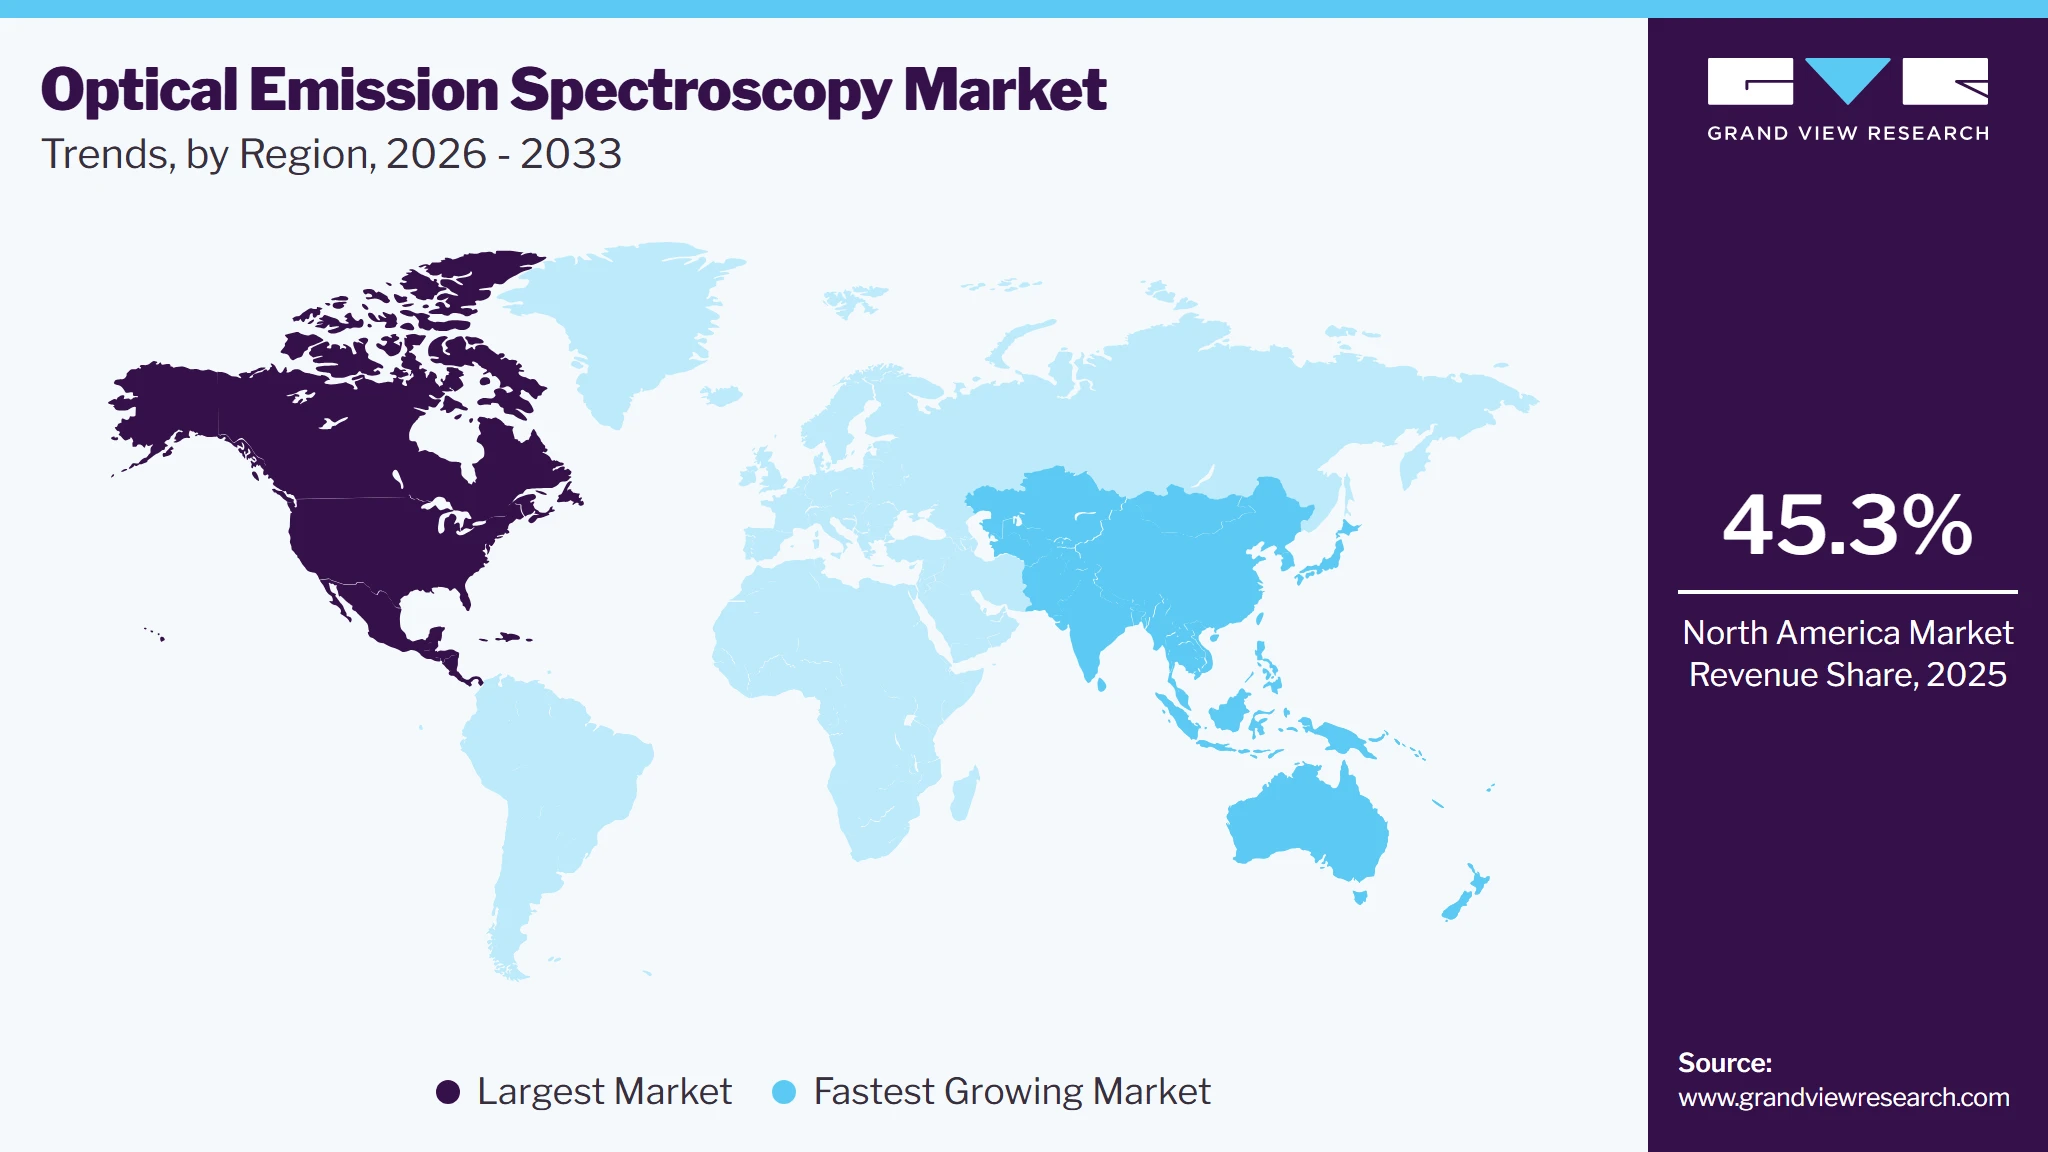
North America dominated the optical emission spectroscopy market with the largest revenue share of 45.3% in 2025, owing to increasing demand for quality control and process optimization in various industries such as manufacturing, pharmaceuticals, and metals. The US is a major contributor to this growth, driven by the presence of key industry players and a robust research and development landscape. In addition, government initiatives promoting the adoption of advanced analytical techniques are also driving market growth.
 To learn more about this report, Download Free Sample Report
 U.S. Optical Emission Spectroscopy Market Trends
The optical emission spectroscopy market in the U.S. held the largest share in the North America region in 2025. The U.S. optical emission spectroscopy market is anticipated to witness significant growth over the forecast period. The U.S. market is characterized by the presence of leading OES manufacturers, such as Thermo Fisher Scientific Inc. and Agilent Technologies Inc. These companies offer a wide range of products and services to cater to diverse application needs. These companies continuously invest in research and development to launch new OES equipment with enhanced features and capabilities, further propelling the market's growth.
Europe Optical Emission Spectroscopy Market Trends
Europe's optical emission spectroscopy market is projected to witness significant growth driven by a focus on technological innovation and sustainability. The European Union's rising focus on environmental policies and industries in the region are under pressure to adopt cutting-edge analytical tools that can help them minimize their ecological footprint. This has fueled the demand for OES systems that can accurately detect and quantify various elements, enabling companies to optimize manufacturing processes and comply with stringent regulations.
Asia Pacific Optical Emission Spectroscopy Market Trends
Asia Pacific optical emission spectroscopy market is growing at the fastest CAGR over the forecast period. The market is driven by the region's booming industrial sector. Countries such as China and India are undergoing rapid industrialization and urbanization, leading to increased demand for advanced analytical technologies such as OES across various applications, from metals processing to food safety. In addition, the region's growing emphasis on environmental protection has created new opportunities for OES in water and air quality monitoring areas.
Key Optical Emission Spectroscopy Company Insights
Some of the key players operating in the market include Agilent Technologies, Inc., Bruker, HORIBA and others. These companies have a strong global presence and are continuously innovating to meet the growing demand for precise and efficient material analysis across different sectors.
Key Optical Emission Spectroscopy Companies
The following key companies have been profiled for this study on the optical emission spectroscopy market.
-
Agilent Technologies, Inc.
-
Anritsu Corporation
-
Bruker
-
HORIBA
-
JEOL Ltd.
-
PerkinElmer
-
Rigaku Holdings Corporation and its Global Subsidiaries.
-
Shimadzu Corporation
-
SPECTRO Analytical Instruments GmbH.
-
Thermo Fisher Scientific Inc.
Competitive Benchmarking
Category
Operating Strategies
Competitive Edge
Weakness
Well-Established Players (Agilent Technologies, Inc.; Bruker; HORIBA; PerkinElmer; Shimadzu Corporation; SPECTRO Analytical Instruments GmbH; Thermo Fisher Scientific Inc.)
Focus on expanding Arc/Spark OES and ICP-OES portfolios through higher-resolution optics, advanced PMT, solid-state and hybrid detectors, automated calibration, lower argon consumption, and application-specific software.
Strong brand recognition, established installed bases, extensive analytical-method libraries, broad geographic coverage, and mature application-support capabilities. Their large R&D budgets allow continued improvement in detection limits, wavelength coverage, automation, robustness, and operating efficiency.
Large organizational structures may slow product customization and response to highly specialized customer requirements. Premium pricing, expensive service contracts, and proprietary consumables or software can reduce affordability for small laboratories and price-sensitive markets.
Emerging Players (Anritsu Corporation; JEOL Ltd.; Rigaku Holdings Corporation and its Global Subsidiaries)
Concentrate on selected OES niches, adjacent elemental-analysis technologies, portable instruments, custom optical systems, detector innovation, and region-specific applications.
Leaner structures can support faster decision-making, greater product customization, and closer technical engagement with customers. Specialized companies may respond more quickly to unmet needs in portable analysis, compact system design, software integration, or application-specific workflows.
Limited installed bases, lower brand visibility, smaller service networks, and restricted global distribution can slow customer adoption. Emerging participants may face difficulties in providing extensive calibration libraries, regulatory documentation, long-term spare-parts support, and rapid on-site servicing across multiple regions.
Recent Developments
-
In March 2024, SPECTRO Analytical Instruments launched the latest version of SPECTROMAXx arc/spark optical emission spectrometry (OES) analyzer. This is one of the industry's best-selling OES analyzers for material control analysis. The LMX10 delivers outstanding repeatability, reproducibility, and reliability in material analysis across the supply chain.
-
In August 2021, HORIBA Scientific, a leading provider of spectroscopy solutions, collaborated with Covalent Metrology, a provider of analytical services, to inaugurate the HORIBA Scientific North American Demonstration Lab at Covalent's Silicon Valley headquarters.
Optical Emission Spectroscopy Market Report Scope
Report Attribute
Details
Market size in 2025
USD 779.0 million
Estimated market size in 2026
USD 825.7 million
Projected market size by 2033
USD 1,343.2 million
Growth rate
CAGR of 7.2% from 2026 to 2033
Historical data
2021 - 2024
Forecast period
2026 - 2033
Quantitative units
Revenue in USD million/billion and CAGR from 2026 to 2033
Report coverage
Revenue forecast, company ranking, competitive landscape, growth factors, and trends
Segments covered
Offerings, form factor, product, detector, application,end-use, region
Regional scope
North America; Europe; Asia Pacific; Latin America; MEA
Country scope
U.S.; Canada; Mexico; Germany; UK; France; Italy; Spain; Denmark; Sweden; Norway; Japan; China; India; South Korea; Australia; Thailand; Brazil; Argentina; South Africa; Saudi Arabia; UAE; and Kuwait
Key companies profiled
Agilent Technologies, Inc.; Anritsu Corporation; Bruker; HORIBA; JEOL Ltd.; PerkinElmer; Rigaku Holdings Corporation and its Global Subsidiaries.; Shimadzu Corporation; SPECTRO Analytical Instruments GmbH.; Thermo Fisher Scientific Inc.
Customization scope
Free report customization (equivalent up to 8 analysts' working days) with purchase. Addition or alteration to country, regional & segment scope.
Pricing and purchase options
Avail customized purchase options to meet your exact research needs. Explore purchase options
Global Optical Emission Spectroscopy Market Report Segmentation
This report forecasts revenue growth at global, regional, and country levels and provides an analysis of the latest industry trends in each of the sub-segments from 2021 to 2033. For this study, Grand View Research has segmented the global optical emission spectroscopy market report based on offerings, form factor, product, detector, application, end use, and region.
-
Offerings Outlook (Revenue, USD Million, 2021 - 2033)
-
Equipment
-
Services
-
-
Form Factor Outlook (Revenue, USD Million, 2021 - 2033)
-
Benchtop
-
Portable
-
-
Product Outlook (Revenue, USD Million, 2021 - 2033)
-
Arc/Spark OES
-
ICP-OES (Inductively Coupled Plasma)
-
-
Detector Outlook (Revenue, USD Million, 2021 - 2033)
-
Photomultiplier Tube (PMT)
-
Solid State Detector (SSD)
-
Hybrid
-
-
Application Outlook (Revenue, USD Million, 2021 - 2033)
-
Chemical Composition Analysis
-
Material Testing and Quality Control
-
Environmental Testing
-
Research and Development
-
-
End-use Outlook (Revenue, USD Million, 2021 - 2033)
-
Metallurgy and Foundries
-
Mining and Exploration
-
Automotive
-
Aerospace and Defense
-
Oil and Gas
-
Food and Beverages
-
Metals and Heavy Machinery
-
Others
-
-
Regional Outlook (Revenue, USD Million, 2021 - 2033)
-
North America
-
U.S.
-
Canada
-
Mexico
-
-
Europe
-
Germany
-
UK
-
France
-
Italy
-
Spain
-
Denmark
-
Sweden
-
Norway
-
-
Asia Pacific
-
China
-
Japan
-
India
-
South Korea
-
Australia
-
Thailand
-
-
Latin America
-
Brazil
-
Argentina
-
-
Middle East and Africa (MEA)
-
South Africa
-
Saudi Arabia
-
Kuwait
-
UAE
-
-
Research Methodology
The optical emission spectroscopy market figures in this report are based on a proven research process that combines executive interviews with secondary research from proprietary databases, company filings, and recognized regulatory and institutional sources. Market size is built through value-chain sizing-reconciling supply-side and demand-side estimates-and triangulated with bottom-up and top-down approaches. Every estimate passes multiple levels of expert validation before publication, with each optical emission spectroscopy segment quantified using the revenue-capture definitions in the table below.
Segment Definition
Segment - Offerings
Revenue capture definition
Equipment
Revenue is captured from the sale, lease, or replacement of optical emission spectroscopy instruments and associated hardware. This includes Arc/Spark OES systems, ICP-OES instruments, benchtop and portable analyzers, autosamplers, excitation sources, optical systems, detectors, gas-control units, cooling systems, sample-introduction components, and related instrument accessories.
Services
Revenue is generated from instrument installation, calibration, preventive maintenance, repair, validation, method development, application support, operator training, software upgrades, remote diagnostics, and contract elemental-analysis services. It also includes annual maintenance agreements, qualification services, and laboratory testing performed for customers that do not operate their own OES instruments.
Segment - Form Factor
Revenue capture definition
Benchtop
Revenue is captured from stationary laboratory and at-line OES systems designed for routine, high-throughput, and high-precision elemental analysis. This includes benchtop Arc/Spark OES and ICP-OES instruments used in quality-control laboratories, foundries, manufacturing plants, environmental laboratories, food-testing facilities, and research institutions.
Portable
Revenue is derived from transportable, mobile, or field-deployable OES instruments used for on-site alloy verification, positive material identification, scrap sorting, pipeline inspection, mining analysis, and production-floor testing.
Segment - Product
Revenue capture definition
Arc/Spark OES
Revenue is captured from optical emission spectrometers that use an electrical arc or spark to excite atoms in solid, electrically conductive samples. The segment includes laboratory and mobile systems used for rapid elemental analysis of steels, cast irons, aluminium, copper, nickel, cobalt, titanium, magnesium, and other metallic alloys.
ICP-OES
(Inductively Coupled Plasma)
Revenue is generated from inductively coupled plasma optical emission spectrometers used for simultaneous or sequential multi-element analysis of liquid samples. This includes radial-, axial-, and dual-view systems; sample-introduction components; nebulizers; spray chambers; torches; autosamplers; chillers; software; and consumables.
Segment - Detector
Revenue capture definition
Photomultiplier Tube (PMT)
Revenue is captured from OES instruments and replacement detector components that use photomultiplier tubes to convert emitted light into electrical signals. These systems are commonly configured for predefined analytical channels and high-sensitivity measurement of selected wavelengths.
Solid State Detector (SSD)
Revenue is derived from OES systems equipped with charge-coupled device, charge-injection device, CMOS, or other solid-state detector technologies. These detectors support broad wavelength coverage, simultaneous spectral acquisition, compact instrument design, and flexible method development.
Hybrid
Revenue is captured from OES systems that combine photomultiplier tubes with solid-state detectors or use multiple detector architectures within one instrument. These configurations are designed to balance sensitivity, spectral coverage, speed, and analytical flexibility. Revenue includes hybrid instruments, detector upgrades, optical-system components, and technical support.
Segment - Application
Revenue capture definition
Chemical Composition Analysis
Revenue is generated from instruments, consumables, software, and services used to identify and quantify elemental composition in metals, liquids, chemicals, minerals, food products, petroleum samples, and environmental materials. It includes routine alloy identification, trace-element measurement, impurity analysis, and multi-element composition testing.
Material Testing
and Quality Control
Revenue is captured from OES systems used for incoming-material inspection, melt control, alloy verification, production monitoring, failure investigation, and final-product certification. The segment includes instruments and services used to confirm that raw materials and manufactured components meet internal specifications, industry standards, and customer requirements.
Environmental Testing
Revenue is derived from ICP-OES instruments, sample-preparation systems, consumables, calibration standards, and analytical services used to measure metals and trace elements in drinking water, wastewater, soil, sludge, sediment, air-particulate digests, and industrial effluents. It includes regulatory compliance monitoring and contamination assessment.
Research and Development
Revenue is generated from OES instruments and related services used in academic, government, and industrial research laboratories for new-material development, method development, elemental characterization, process optimization, and experimental studies.
Segment - End Use
Revenue capture definition
Metallurgy and Foundries
Revenue is captured from OES systems, consumables, and services used by steelmakers, non-ferrous metal producers, foundries, smelters, and casting facilities for melt control, alloy verification, furnace correction, incoming-material inspection, and final-product certification.
Mining and Exploration
Revenue is derived from OES instruments and analytical services used for ore characterization, mineral processing, exploration-sample testing, process-stream monitoring, and elemental analysis of geological materials.
Automotive
Revenue is generated from equipment and services used by vehicle manufacturers, component suppliers, recyclers, and testing laboratories for alloy verification, incoming-material control, lightweight-material analysis, failure analysis, and quality assurance of engine, chassis, battery, and structural components.
Aerospace and Defense
Revenue is captured from OES instruments and services used to verify high-performance alloys, assess trace elements, inspect safety-critical components, support maintenance and repair operations, and ensure compliance with demanding aerospace and defense material specifications.
Oil and Gas
Revenue is derived from OES systems and testing services used for positive material identification, pipeline and refinery inspection, lubricant and fuel analysis, corrosion monitoring, petrochemical testing, and verification of alloy components used in high-pressure and high-temperature environments.
Food and Beverages
Revenue is captured from ICP-OES systems, consumables, and laboratory services used to determine nutritional minerals, trace elements, heavy metals, and contaminants in food ingredients, beverages, packaged products, and processing materials.
Metals and Heavy Machinery
Revenue is generated from OES instruments and services used by metal fabricators, machinery manufacturers, equipment producers, and industrial component suppliers for raw-material verification, alloy control, weld analysis, quality inspection, and failure investigation.
Others
Revenue is captured from OES applications outside the listed industries, including environmental laboratories, semiconductor and electronics manufacturing, battery-material production and recycling, chemicals, pharmaceuticals, academic institutions, government laboratories, waste management, and independent testing organizations.
Estimation Model
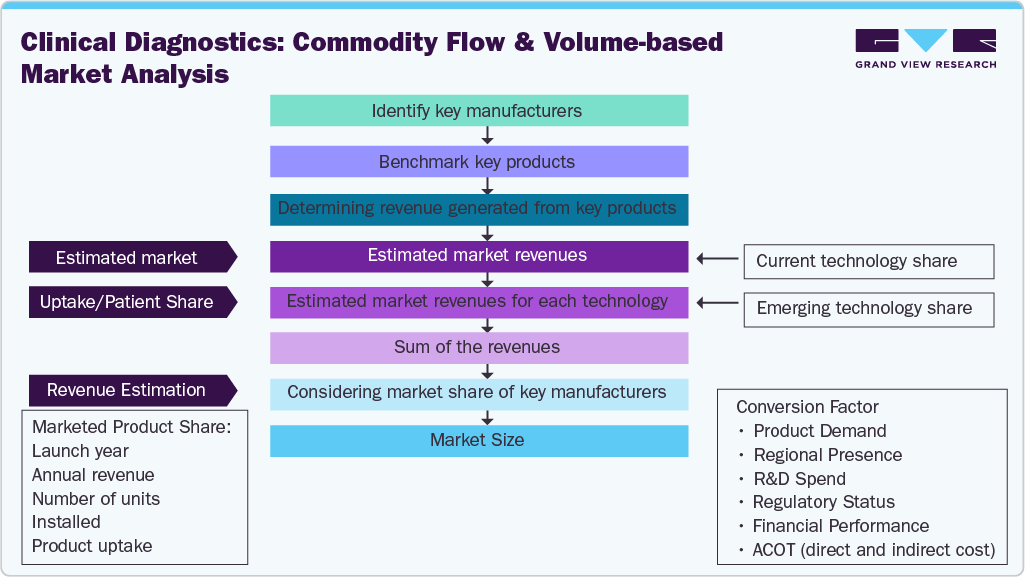
The optical emission spectroscopy market size was estimated using a bottom up approach by identifying key manufacturers, benchmarking their optical emission spectroscopy product portfolios, and assessing revenues generated from optical emission spectroscopy products across major technologies. Market revenues were further validated by analyzing technology wise adoption, patient testing volumes, and the market share of leading manufacturers, followed by aggregation of segment level revenues to derive the overall market size.
 To learn more about this report, Download Free Sample Report
 Delivered Customizations
This report has been delivered with the following In-depth customizations
Optical Emission Spectroscopy Market
Client Request
Customization Delivered
Value Adds
Competitive Landscape & Technology Assessment - Arc/Spark OES, ICP-OES, Portable and Benchtop Systems
Assessed the global optical emission spectroscopy ecosystem across equipment manufacturers, analytical service providers, industrial laboratories, foundries, metal producers, environmental laboratories, mining companies, automotive manufacturers, aerospace suppliers, and research institutes.
Enabled benchmarking of established and specialized market participants, identified differentiation in analytical speed, detection limits, wavelength coverage, portability, argon efficiency, automation, and software capabilities, and mapped competitive positioning across chemical composition analysis, material testing, environmental testing, and research applications.
Optical Emission Spectroscopy Regulatory, Standards, Quality-Control & Commercialization Assessment
Analyzed regulatory and industry requirements governing elemental analysis across major markets, including environmental testing methods, material-certification standards, laboratory accreditation, quality-control procedures, calibration requirements, certified reference materials, instrument validation, and analytical method compliance.
Supported regulatory and commercialization risk assessment, identified compliance and laboratory-adoption challenges, evaluated the effect of environmental regulations and material-quality standards on instrument demand, and provided strategic direction on product registration, method validation, service models, distributor selection, and geographic expansion.
Comprehensive OES Technology Innovation & Application Assessment - Detectors, Automation, Portable Analysis and Emerging End Uses
Evaluated advancements in solid-state and hybrid detectors, high-resolution optics, automated calibration, spectral-interference correction, portable Arc/Spark systems, at-line testing, reduced-argon platforms, remote diagnostics, autosamplers, and digital analytical software.
Highlighted high-growth innovation areas, identified technologies improving analytical throughput, accuracy, portability, workflow efficiency, and total cost of ownership, and assessed competitive positioning across laboratory, production-floor, and field-testing environments.
Frequently Asked Questions About This Report
The global optical emission spectroscopy market is expected to grow at a CAGR of 7.2% from 2026 to 2033, reaching 1,343.2 million by 2033.
North America market dominated, with a revenue share of 45.3% in 2025.
The global optical emission spectroscopy market size was valued at USD 779.0 million in 2025 and is estimated at USD 825.7 million for 2026.
Key factors that are driving the market growth include an increase in manufacturing and industrialization, strict regulatory standards, and the increasing importance of environmental monitoring.
Equipment segment led the market with the largest revenue share of 61.3% in 2025.
Benchtop segment led the market with the largest revenue share of 72.3% in 2025.
Arc/Spark OES segment led the market with the largest revenue share of 63.3% in 2025.
Asia Pacific is the fastest-growing region over the forecast period.
Key players include Agilent Technologies, Inc.; Anritsu Corporation; Bruker; HORIBA; JEOL Ltd.; PerkinElmer; Rigaku Holdings Corporation and its Global Subsidiaries.; Shimadzu Corporation; SPECTRO Analytical Instruments GmbH.; Thermo Fisher Scientific Inc.
About the Author(s)
Clinical Diagnostics Research Team
Healthcare · Clinical DiagnosticsThis report was authored by the clinical diagnostics research team at Grand View Research - comprising two research analysts, one senior research analyst, and one industry expert - with specialized expertise in the clinical diagnostics segment of the healthcare industry. All findings are based on proprietary healthcare databases, executive interviews, and regulatory analysis, subject to internal peer review prior to publication.
Last Updated:
Speak to Analyst

Customize this report to your needs - add regions, segments, or data points, with 20% free customization.
Or view our licence options:


ISO 9001:2015 & 27001:2022 Certified
We are GDPR and CCPA compliant! Your transaction & personal information is safe and secure. For more details, please read our privacy policy.


