
- Home
- »
- Next Generation Technologies
- »
-
Product Analytics Market Size And Share Report, 2026-2033GVR Report cover
![Product Analytics Market (2026 - 2033)Report]()
Product Analytics Market (2026 - 2033)
Size, Share & Trends Analysis Report By Component (Solution, Services), By Deployment (Cloud, On-premises), By Organization Size, By Mode (Tracking Data, Analysing Data), By Application, By Vertical (BFSI), By Region, And Segment Forecasts
Market Size, 2025
$25.9BMarket Estimate, 2026
$32.8BMarket Forecast, 2033
$72.3BCAGR, 2026–2033
12.0%Product Analytics Market Size & Trends
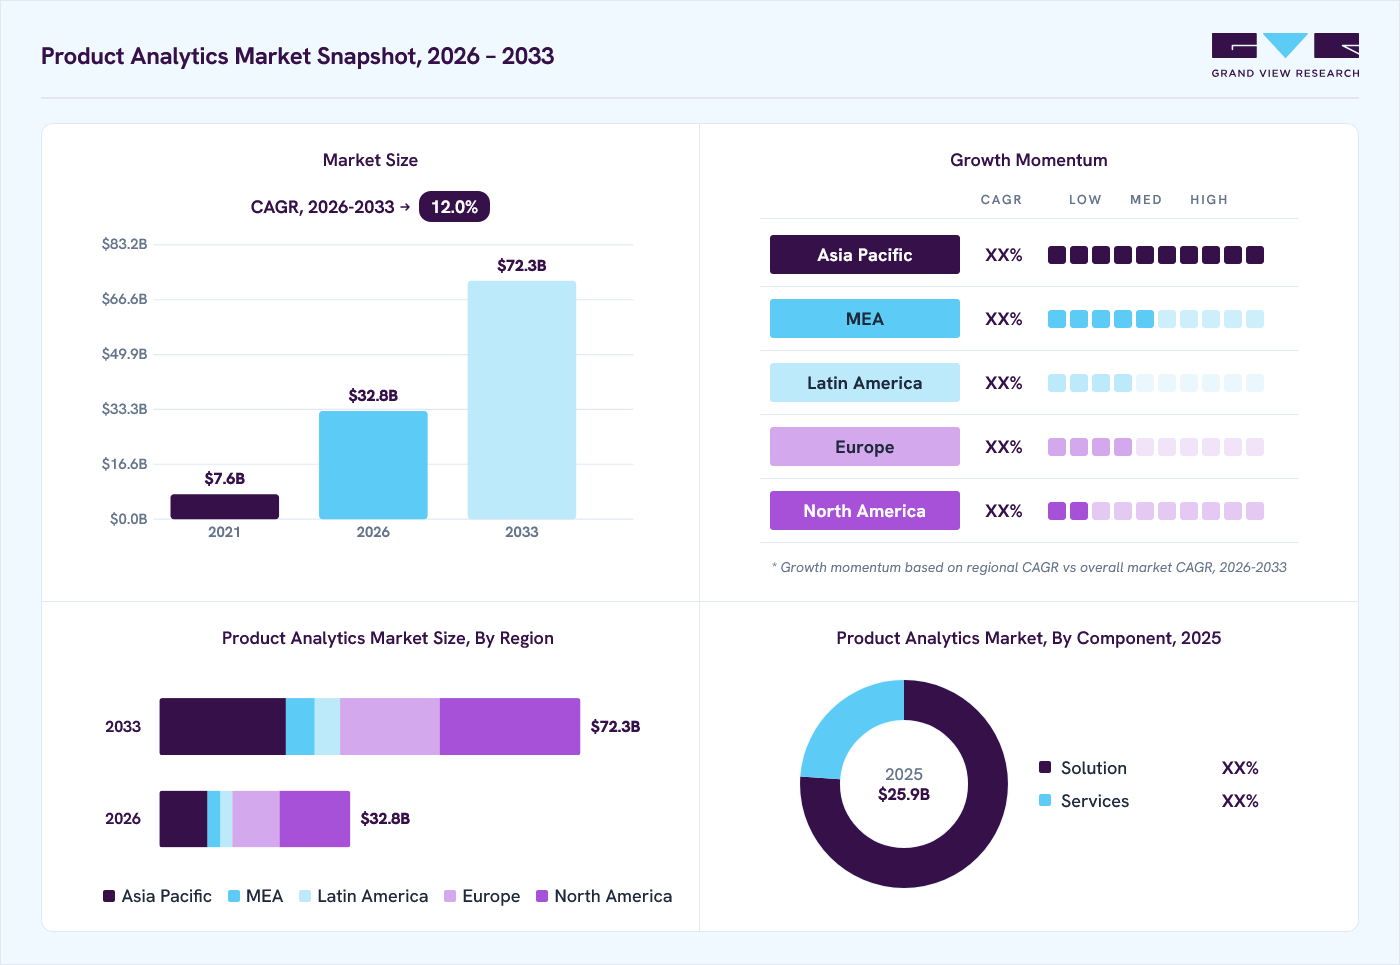
The global product analytics market size was valued at USD 25.9 billion in 2025 and is projected to grow from USD 32.8 billion in 2026 to USD 72.3 billion by 2033, at a CAGR of 12.0% from 2026 to 2033. The market in North America dominated with a revenue share of 37.6% in 2025. This market expansion is driven by the companies seeking automated insights, predictive user behavior analysis, and personalized customer experience optimization.
Key Market Trends & Insights
- By component: Solution segment dominated the market, with a revenue share of 76.1% in 2025.
- By deployment mode: On-premises segment held the largest market share of 62.8% in 2025.
- By organization size: Large enterprises segment held the largest market share of 72.5% in 2025.
- By mode: Tracking data segment held the largest market share of 73.2% in 2025.
- By application: Consumer engagement segment held the largest market share of 43.0% in 2025.
- By vertical: Retail & e-commerce segment held the largest market share of 25.4% in 2025.
Regional Highlights
- Largest regional market: North America (37.6% revenue share, 2025)
- Fastest-growing regional market: Asia Pacific (highest CAGR, 2026-2033)
- By country: The U.S. held the largest market share in 2025.
Market Size & Forecast
- Market size in 2025: USD 25.9 Billion
- Estimated market size in 2026: USD 32.8 Billion
- Projected market size by 2033: USD 72.3 Billion
- CAGR (2026-2033): 12.0%
Various factors, such as the growing need to improve customer behavior management, increasing demand for advanced analytics tools, advancement in technologies, and focus on user experience, are primarily driving the growth of the product analytics market. The growing adoption of cloud-based solutions is another major factor driving market growth. Cloud-based product analytics platforms are scalable, cost-effective, and offer easy access to data for businesses of all sizes. This eliminates the need for expensive on-premises infrastructure and IT expertise, making product analytics more accessible to a wider range of companies.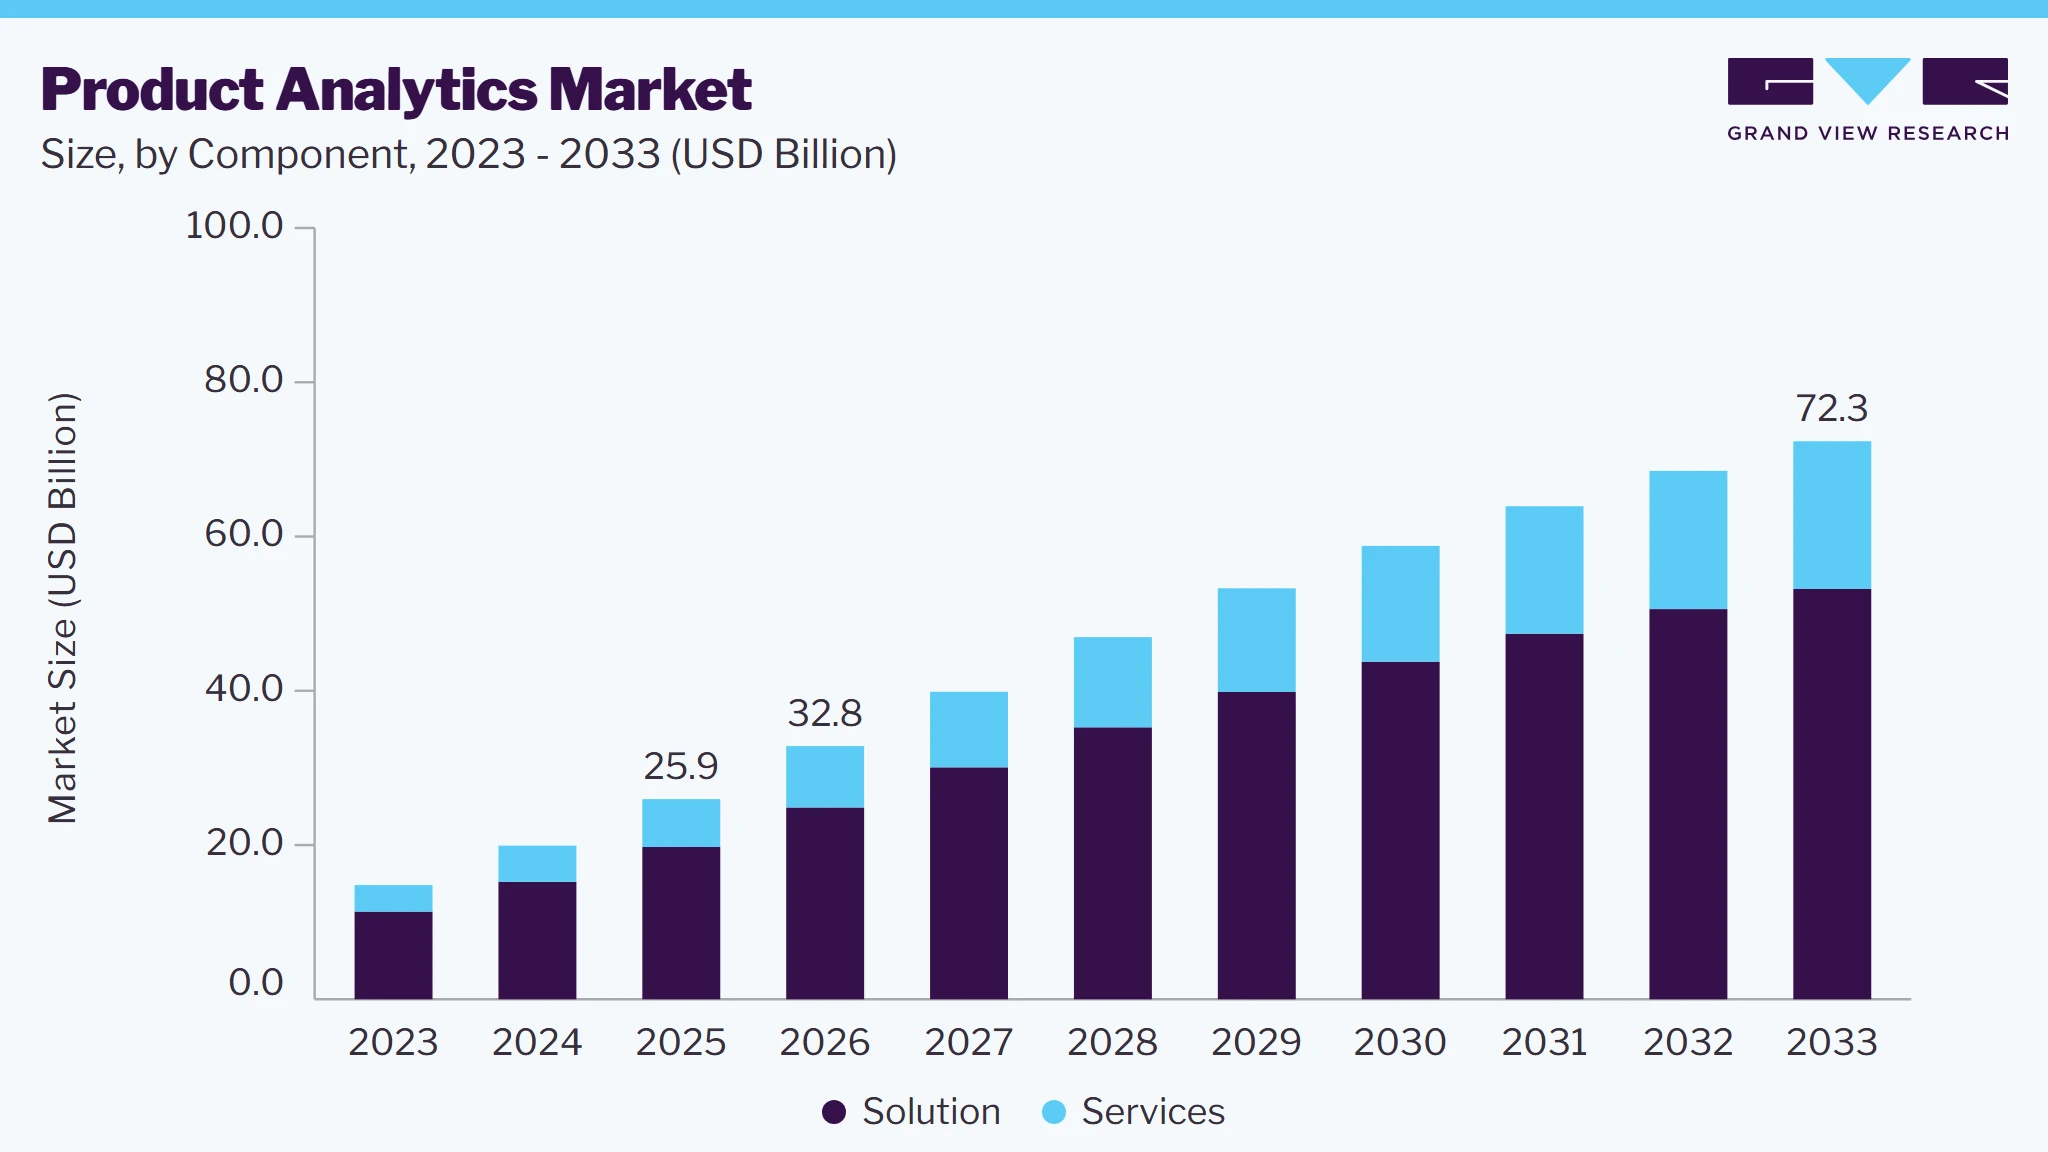
Businesses are increasingly focusing on understanding customers’ buying behavior. Product analytics tools help companies track user journeys, identify pain points, and personalize the user experience, leading to higher customer satisfaction and retention. In today's digital age, user experience (UX) is a top priority for businesses. Product analytics tools help companies understand how users interact with their products and identify areas for improvement. By optimizing the UX, businesses can increase user engagement, satisfaction, and ultimately, conversion rates.
Moreover, businesses are no longer satisfied with basic data collection. They require advanced analytics tools that can provide deeper insights into customer behavior. These tools use techniques such as machine learning and artificial intelligence (AI) to uncover hidden patterns and trends in data, enabling companies to make data-driven decisions for product development, marketing strategies, and overall business operations. The rise of big data technologies has generated massive amounts of data from various sources. Product analytics platforms can ingest and analyze this data to extract valuable insights that would be impossible to glean from traditional methods. The integration of big data, AI, and machine learning is significantly propelling the product analytics market forward.
Market Dynamics
The product analytics market is growing as organizations increasingly rely on data-driven insights to understand customer behavior, improve user experiences, and optimize product performance. The rapid expansion of digital platforms, mobile applications, and SaaS solutions has generated large volumes of user interaction data that require advanced analytics tools for actionable insights. Businesses are also focusing on reducing customer churn, increasing engagement, and accelerating product development cycles through real-time performance monitoring. In addition, the growing adoption of AI and ML technologies is improving predictive analytics capabilities, enabling organizations to make faster and more informed product decisions.
Organizations are increasingly adopting product analytics solutions to make product development decisions based on actual user behavior rather than assumptions. These platforms help businesses understand how customers interact with products, identify feature adoption patterns, and detect areas that require improvement. By analyzing user engagement data, companies can prioritize development efforts that deliver the highest business value and customer satisfaction.
The growing complexity of digital products and the need for faster innovation cycles have further increased the importance of data-driven decision-making. Product analytics enables teams to monitor performance in real time, validate product changes, and measure outcomes more effectively. This approach helps reduce development risks, improve resource allocation, and support continuous product optimization, contributing to the overall growth of the product analytics market.
Organizations today collect data from numerous sources, including websites, mobile applications, CRM platforms, marketing tools, e-commerce systems, and customer support channels. Bringing these diverse datasets together into a unified analytics environment is often challenging because each system uses different data formats, structures, and collection methods. This can result in data inconsistencies, duplication, and gaps that reduce the accuracy of product insights.
The integration process also requires significant technical expertise, time, and investment to ensure seamless data connectivity and governance. As businesses continue to adopt new digital tools and platforms, maintaining a consistent and reliable flow of data becomes increasingly complex. These challenges can delay analytics initiatives and limit an organization's ability to generate real-time, data-driven product decisions.
The rapid growth of mobile applications, e-commerce platforms, SaaS products, and digital services is creating significant opportunities for the product analytics market. As businesses compete to improve user acquisition, engagement, and retention, they are increasingly relying on analytics tools to understand how customers interact with their digital products. Product analytics helps organizations identify usage patterns, detect friction points, and optimize features based on real user behavior. This enables companies to make faster and more effective product decisions while enhancing customer satisfaction.
Furthermore, the increasing shift toward digital-first business models is generating vast amounts of user interaction data that require advanced analytical capabilities. Organizations are investing in product analytics platforms to gain real-time visibility into customer journeys across websites, mobile apps, and connected digital channels. The growing need for personalized user experience and continuous product improvement is further driving adoption across industries. As digital ecosystems continue to expand, the demand for comprehensive product analytics solutions is expected to create substantial growth opportunities for market participants.
Market Concentration & Characteristics
The market shows a high degree of innovation, with vendors continuously introducing advanced capabilities such as predictive analytics, machine learning, behavioral analytics, and automated insight generation. Organizations are seeking deeper visibility into customer interactions, driving demand for more sophisticated analytics solutions. The integration of artificial intelligence is enabling faster identification of trends, user preferences, and product performance issues. This ongoing technological advancement is shaping product analytics into a more intelligent and proactive decision-making tool.
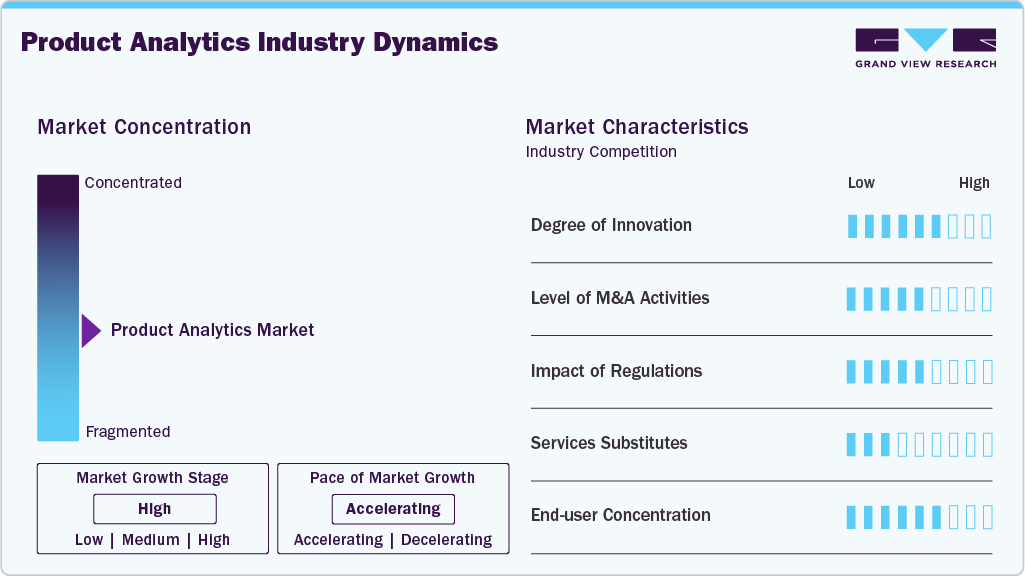
End-user concentration is moderately high as demand is largely driven by organizations with strong digital product strategies, including technology companies, SaaS providers, e-commerce platforms, financial institutions, and media organizations. Large enterprises account for a significant share of the market for extensive customer data and complex analytics requirements. However, increasing accessibility through cloud-based deployment models is also expanding adoption among small and medium-sized businesses. This broadening customer base is helping to diversify market demand while maintaining strong enterprise participation.
Analyst Perspective
The product analytics market is becoming a critical component of enterprise digital strategy as organizations increasingly rely on data-driven insights to optimize customer experiences, improve product performance, and support product-led growth initiatives. The strongest competitive position will belong to vendors that integrate behavioral analytics, customer journey intelligence, experimentation, and AI-driven insights into a unified platform, enabling businesses to move beyond tracking user activity toward predicting behavior, accelerating decision-making, and driving long-term customer retention and revenue growth.
Component Insights
Based on component, the solution segment led the market with the largest revenue share of 76.1% in 2025 and is expected to grow at a significant CAGR over the forecast period. Interactive dashboards and data visualization tools are becoming crucial. They help users easily understand complex data sets and uncover actionable insights. The ability to present data in clear and compelling ways is a major selling point for product analytics solutions. Product analytics solution providers are increasingly focusing on user adoption by offering intuitive interfaces, easy-to-use features, and robust training programs. This ensures users can leverage the full potential of the product analytics solution.
The services segment is predicted to foresee highest growth in the coming years. Businesses invest in product analytics to gain valuable insights that can improve their bottom line. Services providers can help companies define success metrics, track ROI, and ensure they're getting the most value out of their product analytics investment. Moreover, the product analytics landscape is constantly evolving with new technologies and best practices. Service providers help businesses stay contemporary by offering training on emerging trends and ensuring their data strategies are future-proof.
Deployment Insights
Based on deployment mode, the on-premises segment led the market with the largest revenue share of 62.8% in 2025. Cloud-based solutions eliminate the need for expensive on-premises hardware and software. Businesses can pay for the resources they use, making it a cost-effective option for companies of all sizes, especially startups and SMEs. Moreover, Cloud-based solutions are accessible remotely with an internet connection. This allows teams to collaborate on data analysis remotely, fostering better communication and faster decision-making.
The cloud segment is anticipated to exhibit a significant CAGR over the forecast period. On-premises solutions offer businesses more control over data storage and accessibility. This can be crucial for organizations that handle sensitive customer information. Some regulations mandate that data must be stored within specific geographical boundaries. On-premises solutions allow businesses to keep their data on-site or in a private cloud within the specific region, ensuring compliance with data residency requirements.
Organization Size Insights
Based on organization size, the large enterprises segment led the market with the largest revenue share of 72.5% in 2025. Large enterprises generate massive amounts of data from various sources such as customer interactions, website traffic, and internal applications. Product analytics solutions help them manage, analyze, and extract valuable insights from this complex data landscape. Moreover, product analytics helps large enterprises segment their customer base more effectively. By understanding different customer groups and their needs, businesses can tailor their marketing campaigns and product offerings for maximum impact.
The SMEs segment is anticipated to exhibit the highest CAGR over the forecast period. Numerous product analytics vendors offer subscription-based pricing models with tiered plans based on features and data volume. This allows SMEs to choose a plan that fits their budget and scales up as their businesses grow. Moreover, SMEs are increasingly recognizing the value of data-driven decision-making. Product analytics empowers them to understand customer behavior, optimize marketing campaigns, and improve product offerings for faster growth.
Mode Insights
Based on mode, the tracking data segment led the market with the largest revenue share of 73.2% in 2025 and is expected to grow at a significant CAGR over the forecast period. Product analytics platforms are increasingly integrating with BI tools. This allows businesses to combine product data with other business metrics such as sales figures and marketing campaign performance to gain a holistic view of their operations and make more informed strategic decisions. Accurate and comprehensive data tracking ensures that the analysis is based on a complete picture of user behavior. Moreover, as data collection methods and technologies evolve, tracking data becomes more efficient and cost-effective, allowing for deeper analysis.
The analyzing data segment is anticipated to exhibit the highest CAGR over the forecast period. As the volume and complexity of data continues to grow, advanced analytics will play an even more critical role in the product analytics market. Businesses will increasingly seek solutions that offer explainable AI, real-time analytics, and predictive analytics. Traditionally, data analysis was the domain of data scientists. However, the rise of self-service analytics empowers various teams such as marketing and sales to access and analyze data independently. This fosters a data-driven culture within organizations and allows for faster decision-making based on insights.
Application Insights
Based on application, the consumer engagement segment led the market with the largest revenue share of 43.0% in 2025. By tracking engagement metrics, businesses can identify aspects of their product that lead to user drop-off. This data is crucial for optimizing consumer engagement and making the product more engaging and user-friendly. High user engagement is a strong indicator of customer satisfaction and loyalty. Product analytics helps businesses understand what drives engagement and use those insights to implement strategies to keep users actively using the product, reducing churn and increasing retention rates.
The sales and marketing segment is anticipated to exhibit the highest CAGR over the forecast period. Product analytics equips sales teams with valuable customer and product usage insights. This allows them to target lead generation, and improve sales conversations. Moreover, by optimizing campaigns and targeting the right audience with personalized messages, product analytics helps marketing teams maximize their return on investment. Product analytics helps sales and marketing teams understand customer needs and preferences better. This allows them to tailor their messaging and interactions for a more relevant and positive customer experience.
Vertical Insights
Based on vertical, the retail & e-commerce segment led the market with the largest revenue share of 25.4% in 2025 and is expected to grow at a significant CAGR over the forecast period. Product analytics helps retailers and e-commerce businesses understand the entire online shopping journey. This includes tracking user behavior from product discovery to purchase and post-purchase interactions. Moreover, by analyzing user behavior data, retailers can personalize product recommendations and upsell and cross-sell opportunities, leading to increased customer satisfaction and higher average order value. Furthermore, product analytics helps identify reasons for cart abandonment at various stages of the checkout process. This allows for targeted interventions to reduce cart abandonment and improve conversion rates.
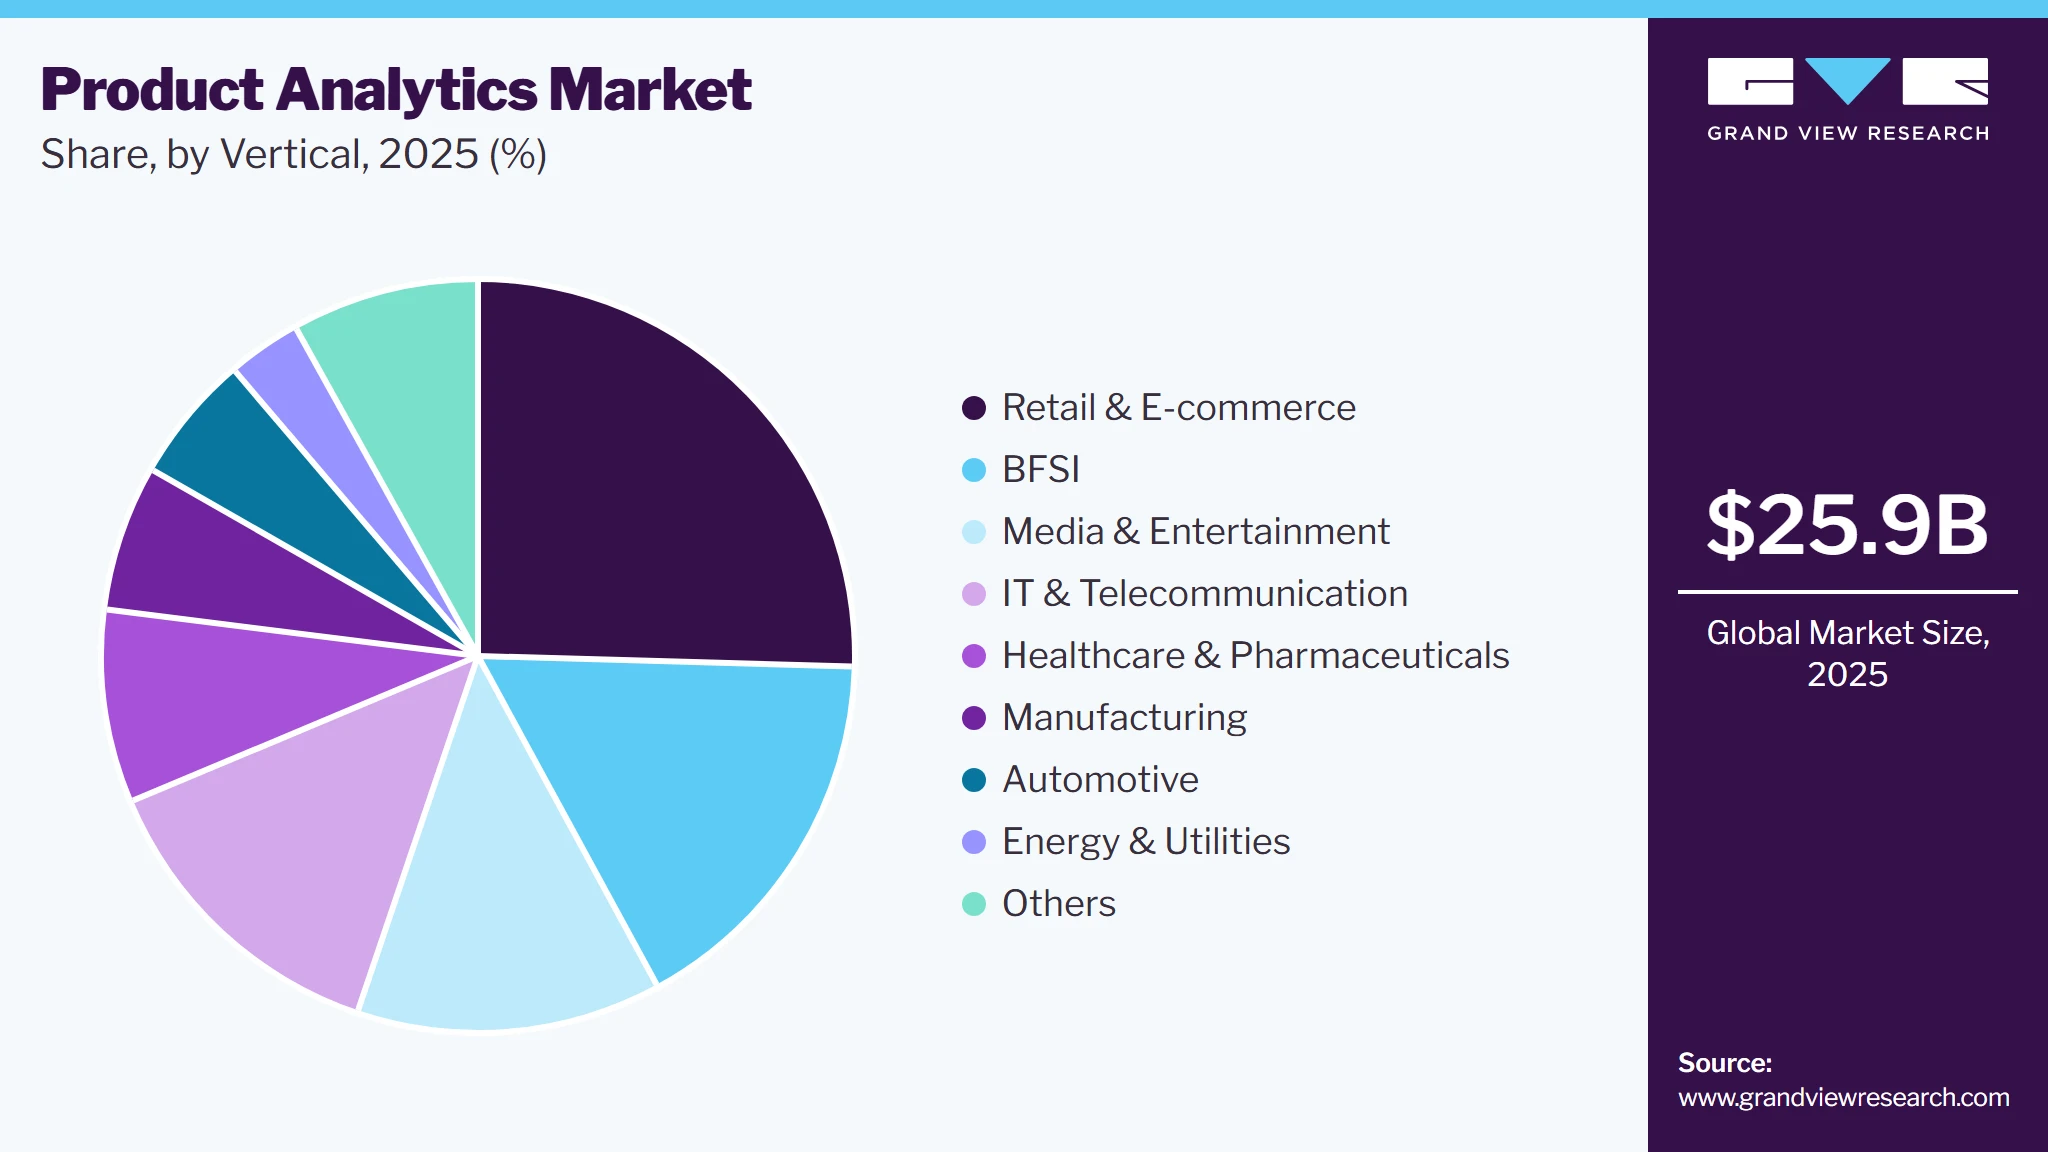
The media & entertainment segment is anticipated to exhibit the highest CAGR over the forecast period. Product analytics helps track the audiences consume content such as movies, TV shows, and music. This includes analyzing viewing time, completion rates, and engagement with different content formats. By analyzing user data, media & entertainment companies can segment their audience based on demographics, interests, and viewing habits. This allows for targeted content creation, marketing campaigns, and personalized recommendations. Product analytics allows for A/B testing of different elements of content, such as trailers, thumbnails, and even storylines in interactive experiences, to see what resonates best with audiences.
Regional Insights
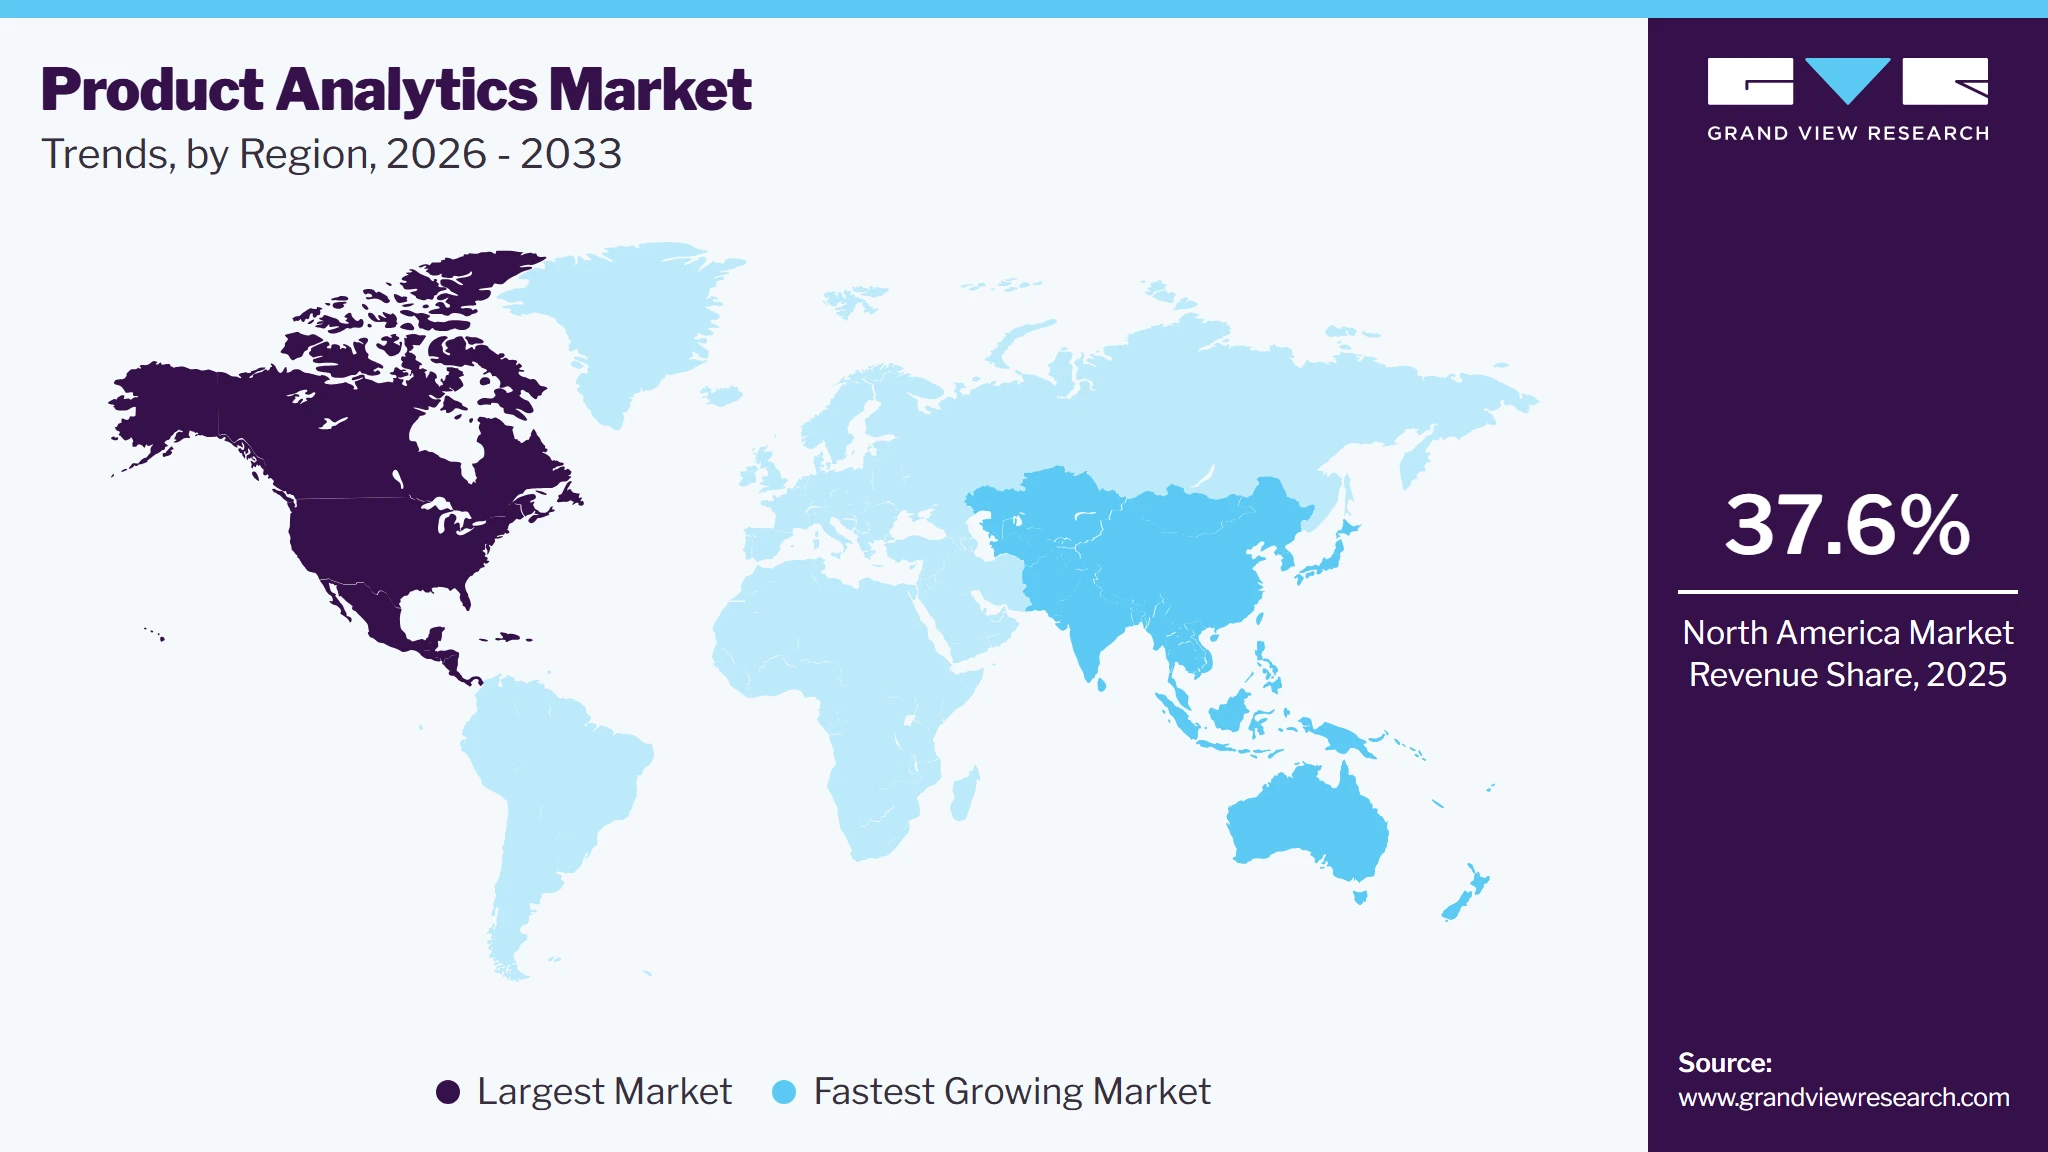
North America dominated the product analytics market with the largest revenue share of 37.6% in 2025. North America boasts a well-developed technological infrastructure with high internet penetration and widespread adoption of smartphones and other connected devices. This creates a vast amount of data to be analyzed, fueling demand for product analytics solutions. Moreover, the booming e-commerce sector in North America heavily relies on product analytics to understand customer behavior, personalize the shopping experience, and optimize marketing strategies. The financial services industry in North America is seen to be using product analytics to improve fraud detection, personalize financial products, and enhance customer service experiences.
U.S. Product Analytics Market Trends
The product analytics market in the U.S. held the largest share in the North America region in 2025. The U.S. boasts a highly developed technological infrastructure with widespread internet access, smartphone adoption, and a growing number of connected devices. This generates massive volumes of data, fueling the demand for advanced product analytics solutions. Moreover, the U.S. businesses are increasingly embracing data-driven decision making. Product analytics is seen as a vital tool for extracting actionable insights from customer data to optimize products, marketing campaigns, and overall business performance.
Europe Product Analytics Market Trends
The product analytics market in the European region is expected to witness significant growth over the forecast period. European consumers are highly conscious of data privacy. Product analytics solutions that prioritize user privacy and offer transparency in data usage are in high demand. Moreover, the European retail sector, including both online and brick-and-mortar stores, is leveraging product analytics tools to optimize product assortment, manage inventory effectively, and understand customer buying patterns.
Asia Pacific Product Analytics Market Trends
The product analytics market in the Asia Pacific region is anticipated to register the highest CAGR over the forecast period. The APAC region is witnessing a digital revolution, with a growing internet penetration rate and increasing smartphone adoption. This surge in digital activity creates a massive amount of data, fueling the demand for product analytics solutions. Moreover, the APAC e-commerce sector is booming, with countries such as China and India leading the charge. Product analytics helps e-commerce businesses in APAC personalize the shopping experience, optimize marketing campaigns, and boost conversion rates.
Key Product Analytics Company Insights
Key product analytics companies include Adobe Inc., Oracle, Accenture, and Google. Companies active in the product analytics market are focusing aggressively on expanding their customer base and gaining a competitive edge over their rivals. Hence, they pursue various strategic initiatives, including partnerships, mergers & acquisitions, collaborations, and new product/ technology development. For instance, in March 2023, Adobe Inc. introduced Adobe Product Analytics. Adobe Product Analytics software tool would enable organizations to integrate workstreams, data, and customer profiles, empowers product teams to work closely with their marketing and customer experience (CX) colleagues, and facilitates the coordination and delivery of more tailored experiences across all platforms.
Key Product Analytics Companies
The following key companies have been profiled for this study on the product analytics market.
-
Accenture
-
Adobe Inc.
-
Google LLC
-
International Business Machines Corporation
-
LatentView Analytics
-
Medallia Inc.
-
Mixpanel
-
Oracle
-
Salesforce, Inc.
-
Veritone, Inc.
Competitive Benchmarking
Category
Operating Strategies
Competitive Edge
Weakness
Established Players (Accenture; Adobe Inc.; Google LLC; International Business Machines Corporation (IBM); Oracle; Salesforce, Inc.; Medallia Inc.)
- Focus on integrated analytics ecosystems combining product analytics with AI, customer experience, cloud, and business intelligence platforms.
- Expand market presence through partnerships, acquisitions, and enterprise-wide digital transformation engagements.
- Strong enterprise customer base and broad product portfolios support large-scale deployments across industries.
- Advanced AI, cloud infrastructure, and data management capabilities enable end-to-end analytics solutions.
- Complex implementation and higher deployment costs may limit adoption among smaller organizations.
- Large platform structures can reduce flexibility and slow feature customization compared to specialized vendors.
Emerging Players (Mixpanel; LatentView Analytics; Veritone, Inc.)
- Concentrate on dedicated product analytics capabilities, user behavior insights, and rapid innovation cycles.
- Target specific use cases and mid-market customers through scalable cloud-native platforms.
- Specialized analytics features provide deeper visibility into customer journeys, feature adoption, and product performance.
- Faster product enhancements and user-friendly interfaces support quicker implementation and adoption.
- Limited global reach and smaller customer bases compared to established enterprise vendors.
- Dependence on third-party integrations and narrower solution portfolios may restrict expansion opportunities.
Recent Developments
-
In March 2024, Accenture launched IBM Sterling Intelligent, a supply chain cost optimization tool to enhance consumer transparency throughout their shopping journey. The solution enables companies to utilize data, real-time systems, and machine learning (ML), supporting a digital transformation journey from product discovery to delivery.
-
In March 2024, Oracle announced the launch of Oracle Analytics Server (OAS). This update brings more than a hundred new features that improve the analytics experience for every user in an organization. It offers new advancements that allow customers to derive more profound insights from their data and make decisions that lead to improved business results.
-
In February 2024, Medallia Inc., launched four new solutions to personalize customer and employee experiences. The solutions are Ask Athena, Intelligent Summaries, Smart Response, and Themes. These solutions will advance the ability of companies to spread insights broadly, engage employees, and customize experiences through affordable, ethical, and scalable AI and intelligent automation. Each of these four solutions will be accessible to Medallia customers via the Medallia Experience Cloud.
Product Analytics Market Report Scope
Report Attribute
Details
Market size in 2025
USD 25.9 billion
Estimated market size in 2026
USD 32.8 billion
Projected market size by 2033
USD 72.3 billion
Growth rate
CAGR of 12.0% from 2026 to 2033
Base year for estimation
2025
Historical data
2021 - 2024
Forecast period
2026 - 2033
Quantitative units
Revenue in USD million/billion and CAGR from 2026 to 2033
Report coverage
Revenue forecast, company ranking, competitive landscape, growth factors, and trends
Segments covered
Component, deployment mode, organization size, mode, application, vertical, region
Regional scope
North America, Asia Pacific; Europe; MEA; Latin America
Country scope
U.S.; Canada; Mexico; Germany; UK; France; China; Japan; India; South Korea; Australia; Brazil; Saudi Arabia; South Africa; UAE
Key companies profiled
Accenture; Adobe Inc.; Google LLC; International Business Machines Corporation; LatentView Analytics; Medallia Inc.; Mixpanel; Oracle; Salesforce, Inc.; Veritone, Inc.
Customization scope
Free report customization (equivalent up to 8 analysts' working days) with purchase. Addition or alteration to country, regional & segment scope.
Pricing and purchase options
Avail customized purchase options to meet your exact research needs. Explore purchase options
Global Product Analytics Market Report Segmentation
This report forecasts revenue growth at global, regional, and country levels and provides an analysis of the latest industry trends in each of the sub-segments from 2021 to 2033. For this study, Grand View Research has segmented the global product analytics market report based on component, deployment, organization size, mode, application, vertical, and region.
-
Component Outlook (Revenue, USD Billion, 2021 - 2033)
-
Solution
-
Services
-
-
Deployment Outlook (Revenue, USD Billion, 2021 - 2033)
-
Cloud
-
On-premises
-
-
Organization Size Outlook (Revenue, USD Billion, 2021 - 2033)
-
SMEs
-
Large Enterprises
-
-
Mode Outlook (Revenue, USD Billion, 2021 - 2033)
-
Tracking Data
-
Analysing Data
-
-
Application Outlook (Revenue, USD Billion, 2021 - 2033)
-
Design and Manufacturing
-
Sales and Marketing
-
Consumer Engagement
-
-
Vertical Outlook (Revenue, USD Billion, 2021 - 2033)
-
BFSI
-
Retail & E-commerce
-
IT & Telecommunication
-
Automotive
-
Media & Entertainment
-
Manufacturing
-
Healthcare & Pharmaceuticals
-
Energy & Utilities
-
Others
-
-
Regional Outlook (Revenue, USD Billion, 2021 - 2033)
-
North America
-
U.S.
-
Canada
-
Mexico
-
-
Europe
-
UK
-
Germany
-
France
-
-
Asia Pacific
-
China
-
India
-
Japan
-
Australia
-
South Korea
-
-
Latin America
-
Brazil
-
-
MEA
-
UAE
-
South Africa
-
KSA
-
-
Research Methodology
The product analytics market figures in this report are based on a proven research process that combines executive interviews with secondary research from proprietary databases, company filings, and recognized regulatory and institutional sources. Market size is built through value-chain sizing - reconciling supply-side and demand-side estimates - and triangulated with bottom-up and top-down approaches. Every estimate passes multiple levels of expert validation before publication, with each product analytics segment quantified using the revenue-capture definitions in the table belowa
Segment Definition
Segment - Component
Revenue capture definition
Solution
Product analytics solutions include software platforms that collect, process, and analyze user interaction data across digital products and applications. Revenue is generated from platform subscriptions, analytics software licenses, dashboards, reporting tools, and AI-driven insight capabilities.
Services
Product analytics services comprise consulting, implementation, integration, customization, training, and support activities associated with analytics platforms. Revenue is derived from professional services that help organizations deploy, manage, and optimize product analytics environments.
Segment - Deployment Mode
Revenue capture definition
Cloud
Cloud deployment captures revenue generated from subscription-based and hosted product analytics platforms delivered through public, private, or hybrid cloud environments. This segment includes analytics software, platform access, data processing, and associated cloud-managed services.
On-premises
On-premises deployment captures revenue from product analytics solutions installed and operated within an organization's own IT infrastructure and data centers. Revenue includes software licenses, implementation, maintenance, and infrastructure-related support services.
Segment - Organization Size
Revenue capture definition
Large Enterprises
Large enterprises account for a significant share of the product analytics market due to their extensive digital ecosystems, large user bases, and continuous focus on product performance optimization. These organizations invest in advanced analytics platforms to support data-driven decision-making, customer experience improvement, and feature adoption analysis across multiple products.
SMEs
Small and medium-sized enterprises are increasingly adopting product analytics solutions to gain visibility into user behavior and improve product development outcomes. Cloud-based platforms and subscription-based pricing models have made analytics tools more accessible, enabling SMEs to enhance customer engagement and operational efficiency.
Segment - Mode
Revenue capture definition
Tracking Data
This segment captures revenue generated from solutions that collect, monitor, and organize user interaction data across websites, mobile applications, software platforms, and digital products. These tools provide visibility into customer actions, feature usage, engagement patterns, and user journeys for further analysis.
Analyzing Data
This segment includes revenue derived from platforms that process and interpret collected user data to generate actionable insights. The solutions support trend identification, behavior analysis, performance measurement, and data-driven product decision-making across digital environments.
Segment - Application
Revenue capture definition
Design and Manufacturing
Revenue for this segment is generated from the adoption of product analytics solutions that help organizations evaluate product performance, usage patterns, and customer feedback throughout the development lifecycle. These insights support feature optimization, quality improvement, and data-driven product planning.
Sales and Marketing
This segment captures revenue from analytics platforms used to measure customer interactions, campaign effectiveness, conversion funnels, and product adoption trends. Organizations utilize these insights to refine go-to-market strategies and improve customer acquisition outcomes.
Consumer Engagement
Revenue in this segment is derived from the use of product analytics tools to monitor user behavior, engagement levels, retention patterns, and feature utilization. Businesses use these insights to enhance customer experience, increase product usage, and support long-term user retention.
Segment - Vertical
Revenue capture definition
BFSI
Revenue in the BFSI segment is generated from the adoption of product analytics solutions to monitor digital banking journeys, optimize financial products, and improve customer engagement across web and mobile platforms. Analytics tools support user behavior analysis, conversion tracking, and feature utilization assessment.
Retail & E-commerce
Revenue is captured through the deployment of product analytics platforms that help retailers understand shopping behavior, optimize digital storefronts, and enhance customer experiences. These solutions support basket analysis, customer retention initiatives, and product performance measurement.
IT & Telecommunication
The IT & telecommunications segment generates revenue by product analytics to evaluate software adoption, feature usage, and customer interactions across digital services. Organizations utilize these insights to improve product development and service delivery.
Automotive
Revenue is derived from the application of product analytics across connected vehicle platforms, digital sales channels, and mobility services. Automotive companies use analytics to assess user engagement, service adoption, and customer experience performance.
Media & Entertainment
This segment captures revenue from analytics solutions that track content consumption patterns, user engagement, and subscription behaviors. Media companies leverage these insights to refine content strategies and improve audience retention.
Manufacturing
Revenue is generated through the adoption of product analytics tools that evaluate the performance and utilization of digital manufacturing applications and industrial software. These platforms support operational efficiency improvements and product lifecycle optimization.
Healthcare & Pharmaceuticals
The healthcare and pharmaceutical segment contributes revenue using product analytics for digital health applications, patient engagement platforms, and healthcare software solutions. Analytics capabilities assist organizations in understanding usage trends and improving digital service effectiveness.
Energy & Utilities
Revenue is captured from analytics deployments that monitor customer interactions with digital energy management platforms, utility applications, and self-service portals. Organizations use these insights to enhance service quality and optimize digital product offerings.
Others
The others segment includes education, government, travel, logistics, and other industries utilizing product analytics to measure user behavior and digital product performance. Revenue is generated from the growing adoption of data-driven decision-making across diverse business applications.
Estimation Model
Layer Name
Key Questions
Description
Digital Product Layer
Who operates digital products?
Identify organizations that manage websites, mobile applications, SaaS platforms, e-commerce portals, and digital services. This establishes the addressable base of companies generating user interaction data suitable for product analytics.
Analytics Adoption Layer
How many organizations use product analytics?
Apply adoption rates for product analytics across enterprises and SMEs. This converts the digital product universe into active users of analytics platforms for monitoring customer behavior, engagement, and product performance.
Deployment Layer
Which analytics solutions are implemented?
Measure the distribution of deployments across cloud-based and on-premises platforms, along with usage across industries and application areas. This reflects the penetration and utilization of product analytics solutions within organizations.
Monetization Layer
How much revenue is generated?
Apply average annual spending on software subscriptions, platform licenses, implementation services, consulting, and support services. Aggregating these revenues provides the total addressable product analytics market size.
Delivered Customizations
This report has been delivered with the following In-depth customizations
Client Request
Customization Delivered
Value Adds
Market Entry & Expansion Assessment
Regional demand sizing and forecasting
Customer segmentation and buying behavior analysis
Competitive landscape benchmarking
Regulatory and distribution channel assessment
Identified high-growth market opportunities
Supported go-to-market strategy development
Highlighted investment priorities and risks
Enabled data-driven expansion planning
Technology & Innovation Assessment
Emerging technology trend analysis
Innovation pipeline
Technology adoption readiness assessment
Ecosystem and partnership mapping
Identified future growth areas
Supported innovation roadmap planning
Evaluated commercialization potential
Strengthened strategic partnership decisions
Customer & End-User Insights Study
Consumer awareness and adoption analysis
Purchase decision journey mapping
Satisfaction and loyalty assessment
Usage pattern and pain-point evaluation
Revealed key adoption drivers and barriers
Supported customer-centric product development
Improved targeting and engagement strategy
Identified opportunities for retention and upselling
Frequently Asked Questions About This Report
Asia Pacific is the fastest-growing region over the forecast period.
Tracking data segment held the largest share (over 73.0%) in 2025, while the analyzing data segment is the fastest-growing mode.
The large enterprises segment led with a 72.5% revenue share in 2025, while the SMEs segment is the fastest-growing size.
Some key players operating in the product analytics market include Accenture; Adobe Inc.; Google LLC; International Business Machines Corporation; LatentView Analytics; Medallia Inc.; Mixpanel; Oracle; Salesforce, Inc.; Veritone, Inc.
This market expansion is driven by the companies seeking automated insights, predictive user behavior analysis, and personalized customer experience optimization.e.
The consumer engagement segment led with a 43.0% revenue share in 2025, while the sales and marketing segment is the fastest-growing application.
The solution segment led with a 76.1% revenue share in 2025, while the services segment is the fastest-growing component.
The global product analytics market size was valued at USD 25.9 billion in 2025 and is estimated at USD 32.8 billion for 2026.
The global product analytics market is expected to grow at a CAGR of 12.0% from 2026 to 2033, reaching USD 72.3 billion by 2033.
North America dominated the product analytics market with a share of 37.6% in 2025. North America boasts a well-developed technological infrastructure with high internet penetration and widespread adoption of smartphones and other connected devices. This creates a vast amount of data to be analyzed, fueling demand for product analytics solutions.
About the Author(s)
Next Generation Technologies Research Team
Technology · Next Generation TechnologiesThis report was authored by the next generation technologies research team at Grand View Research - comprising two research analysts, one senior research analyst, and one industry expert - with specialized expertise in the next generation technologies segment of the technology industry. All findings are based on proprietary technology databases, executive interviews, and regulatory analysis, subject to internal peer review prior to publication.
Last Updated:
Speak to Analyst


Customize this report to your needs — add regions, segments, or data points, with 20% free customization.
Or view our licence options:


ISO 9001:2015 & 27001:2022 Certified
We are GDPR and CCPA compliant! Your transaction & personal information is safe and secure. For more details, please read our privacy policy.


