GVR Report cover Smart Infrastructure Market Size, Share & Trends Report

Smart Infrastructure Market Size, Share & Trends Analysis Report By Offering (Products, Services), By Type, By End-user (Residential, Non-residential), By Region, And Segment Forecasts, 2024 - 2030

  • Report ID: GVR-4-68040-175-6
  • Number of Pages: 125
  • Format: Electronic (PDF)
  • Historical Range: 2018 - 2022
  • Industry: Technology

Smart Infrastructure Market Size & Trends

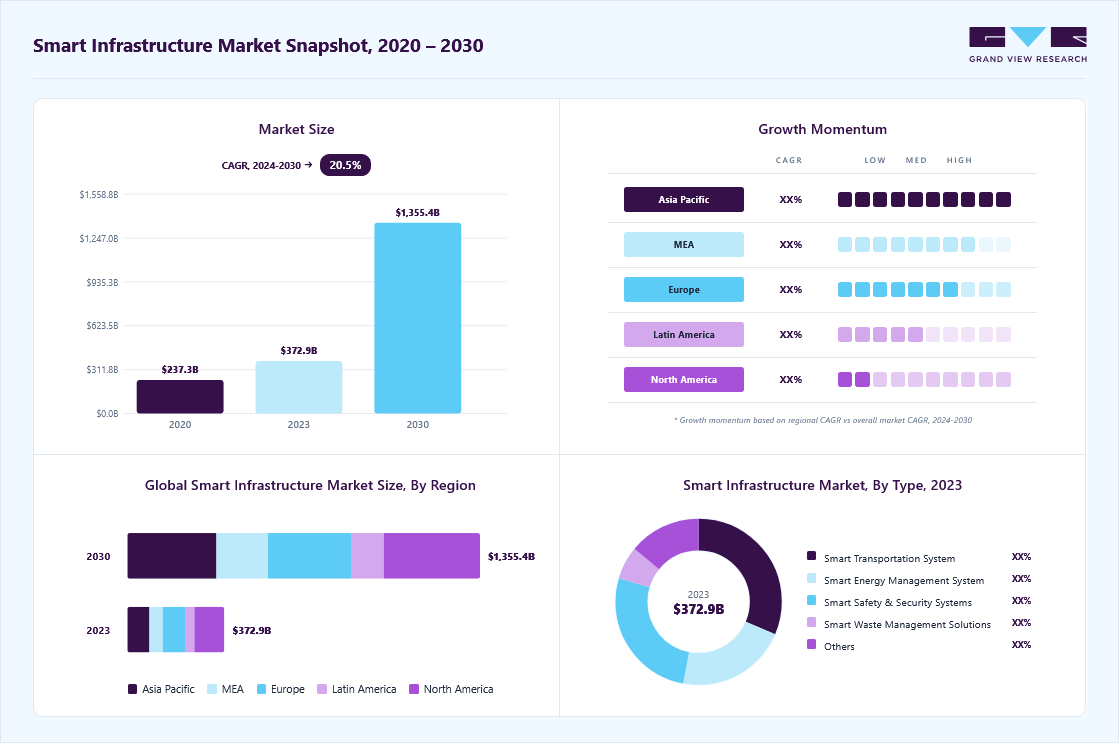
The global smart infrastructure market size was estimated at USD 372.95 billion in 2023 and is projected to grow at a compound annual growth rate (CAGR) of 20.5% from 2024 to 2030. The considerable growth of the smart infrastructure market can be attributed to increasing public and private investments in smart city projects, supportive government initiatives for digitalization, and shifting focus of various end-user companies toward improving their consumer experience.

U.S. Smart Infrastructure Market size and growth rate, 2024 - 2030

Smart infrastructure collects valuable information using connected devices, cameras, and sensors to assist urban planners, transport department officials, and city leaders, among others, to provide countless benefits to citizens or end-users, thus supporting smart infrastructure market growth. Companies operating in this market, such as Siemens, Honeywell International Inc., and International Business Machines Corporation, are notably investing in developing smart infrastructure solutions, creating robust opportunities for the smart infrastructure industry.

For instance, in November 2023, VMware announced a collaboration with International Business Machines Corporation (IBM) to integrate IBM Watsonx data and Artificial Intelligence (AI) on Red Hat OpenShift and VMware Private AI platform. This will enable their clients to improve operational efficiency of their AI-powered infrastructure and cloud platform.

Shifting focus of governments of various countries such as China, India, Germany, Brazil, and South Africa towards smart cities to elevate living standards of citizens is creating a positive outlook for smart infrastructure market. Governments in these countries are launching various smart city projects, which are anticipated to fuel market growth. For instance, in April 2022, the Government of Mpumalanga province in South Africa announced the transformation of Nkosi city, which is located near the Kruger National Park, into a smart city. The project is valued at around USD 5.24 billion and has received all government approvals.

Furthermore, various governments are organizing smart city exhibitions, which is propelling market growth. For instance, in October 2023, the Government of New York organized Smart City Expo USA 2023 in partnership with National League of Cities (NLC) and the African American Mayors Association (AAMA). The event was held at Pier 36 NYC, New York, and visited by various key market players who presented their latest technology-equipped smart infrastructure solutions, demos, and workshops, among others.

Market Concentration & Characteristics

The growth of market is very high and pace is accelerating. The smart infrastructure market is characterized by a high degree of innovation owing to rapid advancements in various technologies such as Artificial Intelligence (AI), Machine Learning (ML), big data analytics, cybersecurity, and Blockchain, among others. Further, emerging AI and cloud platforms are disrupting the current market and creating new opportunities for market stakeholders.

The market is also witnessing a high level of merger and acquisition (M&A) activity by key players. These players are focusing on acquiring technology providers to optimize their research & development (R&D) costs and expand their business presence into untapped markets.

The market is also subject to rules and regulations set by international, regional, and country-level regulatory bodies. The regulations for the next generation of emerging technologies are becoming stringent owing to rising privacy violations and manipulation in application algorithms. Owing to this, rules & regulations can significantly influence the development of the smart infrastructure market.

Smart Infrastructure Market Concentration & Characteristics

There are no direct substitutes for smart infrastructure solutions. The industry is relatively focused on narrow solutions that have few technology-driven substitutes and comparable product offerings. Companies are investing large amounts in research and development for the development of new products and technologies.

End-user concentration is one of the considerable factors that is anticipated to influence market growth. These solutions are witnessing high demand owing to their sustainability and enhanced efficiency. High need for customizable solutions to address specific needs of end-users creates challenges for emerging market players who are trying to establish their brand image.

End-user Insights

Non-residential end-users held the largest market revenue share in 2023. This high share can be attributed to the increasing adoption of smart infrastructure solutions in various commercial and industrial companies to digitize their business operations and improve consumer experience. Smart infrastructure solution consists of automation systems that contribute to streamlining operations and effective resource utilization. Furthermore, businesses integrate smart infrastructure solutions to strengthen the digital security and safety of their sensitive data.

Global Smart Infrastructure Market share and size, 2023

The residential end-user segment is projected to witness highest growth rate over the forecast period. The segment growth can be attributed to the rise in demand for HVAC management, smart home lighting, smart meters, and smart door lock security systems to monitor & manage a building's electrical and mechanical systems. Moreover, the segment is anticipated to benefit from increased awareness about smart grids, growth of the consumer electronics sector, rising personal income in developing economies, and improved power line communication.

Offering Insights

Products led the market and held over 68.0% of global revenue share in 2023. This high segment share can be attributed to increasing adoption of smart infrastructure hardware & software such as smart grid solutions, Building Automation Systems (BAS), and Internet of Things (IoT)-based environmental monitoring system, among others, to improve the operational efficiency and reduce human errors.  This segment is expected to dominate the market through 2030 and witness robust functionality due to rapid technological advancements in smart infrastructure solutions development.

Service offering is anticipated to witness the highest CAGR from 2024 to 2030 in the market for smart infrastructure. The considerable growth expected during the forecast period can be attributed to shifting focus of organizations on utilizing smart infrastructure services to optimize their budgets. Market players offer consulting, support & maintenance, and designing services to assist end-users in digitalizing their operations and maximizing their business profitability.

Regional Insights

North America dominated the market with a share of 30.84% in 2023. This high share is attributable to presence of established market players such as Cisco Systems Inc., Honeywell International Inc., Johnson Controls, & International Business Machines Corporation, as well as favorable government policies for digitalization. In the U.S., various non-residential sectors emphasize transforming their existing offices into smart offices. Such initiatives by end-user companies are anticipated to boost smart infrastructure solution adoption in this country during the forecast period.

Smart Infrastructure Market Trends, by Region, 2024 - 2030

Asia Pacific is anticipated to witness significant growth in the smart infrastructure industry. This growth is aided by high urbanization, shifting consumer focus toward remote management services through IoT technology, and increasing rate of internet penetration. Supportive government initiatives for smart cities and rising concerns regarding energy consumption among buildings are driving China's smart infrastructure market growth. Moreover, regional industries are focusing on automation to improve their business operations and reduce overhead costs.

Type Insights

Smart transportation system accounted for the largest revenue share in 2023. Current advancements in computing, communications sensors, and network speed have made it possible to overhaul the transportation infrastructure, vehicular operations, and traffic management. Advances in sensing technologies and telecommunications have improved the capabilities of transportation systems to ensure safety and security. Further, favorable policies and regulations, increased awareness of road safety, and a growing number of vehicles pose many potential opportunities in this segment during the forecast period.

Smart waste management is expected to register the fastest CAGR during the forecast period. The significant segment growth can be attributed to the rising usage of smart bin technology, implementation of Blockchain technology for tracking waste from generation to disposal, and development of automated sorting systems. Local governments, technology solutions providers, distributors, and system integrators are the major stakeholders in the implementation of city-level waste management projects. Different types of mobile apps are being developed to monitor the fill levels of bins and enhance user convenience.

Key Companies & Market Share Insights

Some of the key players operating in the market include ABB; Honeywell International Inc., International Business Machines Corporation; Siemens; and Cisco Systems, Inc.

  • ABB offers smart infrastructure solutions for the management of water, energy, healthcare facilities, and communications, among others. ABB’s Asset Manager and Ability Energy Manager are cloud solutions that offer asset and energy management functionalities through a single intuitive dashboard.

  • Honeywell International Inc. utilizes its IoT-enabled command & control platform for city management. It offers various smart city applications for Geographic Information System (GIS)-based incident management, citizen engagement, and workforce dispatch.

Panamax Infotech, Huawei Technologies Co., Ltd., and Dynamic Ratings, Inc. are some of the emerging market participants in the smart infrastructure market.

  • Panamax Infotech provides Smart Infrastructure Solutions (SIS) that includes Integrated Command and Control Centre (ICCC), smart surveillance, smart transport & mobility solution, and smart healthcare solution.

  • Dynamic Ratings specializes in designing and developing smart infrastructure solutions such as EV charging systems, outage detection systems, and Distributed Energy Resources (DERs).

Key Smart Infrastructure Companies:

  • ABB
  • Aclara Technologies LLC (Hubbell Incorporated)
  • Broadcom, Inc. (VMware)
  • Cisco Systems, Inc.
  • Dynamic Ratings
  • Honeywell International Inc.
  • Hewlett Packard Enterprise Development LP
  • Huawei Technologies Co., Ltd.
  • International Business Machines Corporation
  • L&T Technology Services Limited
  • Panamax Infotech
  • Schneider Electric
  • Siemens
  • Wipro
  • Xylem (Sensus)

Recent Developments

  • In September 2023, Huawei Technologies Co., Ltd. launched smart infrastructure solutions such as Intelligent DC OptiX, an ultra-broadband solution, and CloudEngine XH, the company’s AI Computing DCN Switch Series to enable enterprises to digitize their business operations

  • n August 2023, Honeywell International Inc. announced that it would be providing its City Suite Software for a smart city project handled by Atlanta BeltLine that includes the redevelopment of 22 miles of railroad in this city. The software will help smart city developers display data from multiple points across the whole area in a single unified view

  • In June 2023, ABB strengthened its smart home product portfolio with the acquisition of the smart home solution provider Eve Systems GmbH for an undisclosed amount. The acquisition will help ABB improve its brand image in North America and Europe

Smart Infrastructure Market Report Scope

Report Attribute

Details

Market size value in 2024

USD 443.81 billion

Revenue forecast in 2030

USD 1,355.44 billion

Growth rate

CAGR of 20.5% from 2024 to 2030

Base year for estimation

2023

Historical data

2018 - 2022

Forecast period

2024 - 2030

Quantitative units

Revenue in USD billion and CAGR from 2024 to 2030

Report coverage

Revenue forecast, company share, competitive landscape, growth factors, and trends

Segments covered

Offering, type, end-user, region

Regional scope

North America; Europe; Asia Pacific; Latin America; MEA

Country scope

U.S., Canada; Germany; U.K.; France; China; Japan; India; South Korea; Australia; Brazil Mexico; Saudi Arabia; UAE; South Africa

Key companies profiled

ABB; Aclara Technologies LLC (Hubbell Incorporated); Broadcom, Inc. (VMware); Cisco Systems, Inc.; Dynamic Ratings; Honeywell International Inc.; Hewlett Packard Enterprise Development LP; Huawei Technologies Co., Ltd.; International Business Machines Corporation; L&T Technology Services Limited; Panamax Infotech; Schneider Electric; Siemens; Wipro; Xylem (Sensus)

Customization scope

Free report customization (equivalent up to 8 analysts' working days) with purchase. Addition or alteration to country, regional & segment scope.

Pricing and purchase options

Avail customized purchase options to meet your exact research needs. Explore purchase options


Global Smart Infrastructure Market Report Segmentation

This report forecasts revenue growth at the global, regional, and country levels and provides an analysis of the latest industry trends in each of the sub-segments from 2018 to 2030. For this study, Grand View Research has segmented the global smart infrastructure market report based on offering, type, end-user, and region:

Global Smart Infrastructure Market Report Segmentation

  • Offering Outlook (Revenue, USD Billion, 2018 - 2030)

    • Products

    • Services

  • Type Outlook (Revenue, USD Billion, 2018 - 2030)

    • Smart Transportation System

    • Smart Energy Management System

    • Smart Safety & Security Systems

    • Smart Waste Management Solutions

    • Others

  • End-user Outlook (Revenue, USD Billion, 2018 - 2030)

    • Residential

    • Non-residential

  • Regional Outlook (Revenue, USD Billion, 2018 - 2030)

    • North America

      • U.S.

      • Canada

    • Europe

      • Germany

      • U.K.

      • France

    • Asia Pacific

      • China

      • Japan

      • India

      • Australia

      • South Korea

    • Latin America

      • Brazil

      • Mexico

    • Middle East and Africa (MEA)

      • Saudi Arabia

      • UAE

      • South Africa

Frequently Asked Questions About This Report

Table of Contents

Chapter 1. Methodology and Scope
                     1.1. Market Segmentation and Scope
                     1.2. Market Definitions
                     1.3. Research Methodology
                         1.3.1. Information Procurement
                         1.3.2. Information or Data Analysis
                         1.3.3. Market Formulation & Data Visualization
                         1.3.4. Data Validation & Publishing
                     1.4. Research Scope and Assumptions
                         1.4.1. List of Data Sources
Chapter 2. Executive Summary
                     2.1. Market Outlook
                     2.2. Segment Outlook
                     2.3. Competitive Insights
Chapter 3. Smart Infrastructure Market Variables, Trends, & Scope
                     3.1. Market Introduction/Lineage Outlook
                     3.2. Market Size and Growth Prospects (USD Billion)
                     3.3. Industry Value Chain Analysis
                     3.4. Market Dynamics
                         3.4.1. Market Drivers Analysis
                         3.4.2. Market Restraints Analysis
                         3.4.3. Market Opportunity Analysis
                     3.5. Smart Infrastructure Market Analysis Tools
                         3.5.1. Porter’s Five Forces Analysis
                             3.5.1.1. Bargaining power of the suppliers
                             3.5.1.2. Bargaining power of the buyers
                             3.5.1.3. Threats of substitution
                             3.5.1.4. Threats from new entrants
                             3.5.1.5. Competitive rivalry
                         3.5.2. PESTEL Analysis
                             3.5.2.1. Political landscape
                             3.5.2.2. Economic and Social landscape
                             3.5.2.3. Technological landscape
                             3.5.2.4. Environmental landscape
                             3.5.2.5. Legal landscape
Chapter 4. Smart Infrastructure Market: Offering Estimates & Trend Analysis
                     4.1. Segment Dashboard
                     4.2. Smart Infrastructure Market: Offering Movement Analysis, 2023 & 2030 (USD Billion)
                     4.3. Products
                         4.3.1. Market Size Estimates and Forecasts, 2018 - 2030 (USD Billion)
                     4.4. Services
                         4.4.1. Market Size Estimates and Forecasts, 2018 - 2030 (USD Billion)
Chapter 5. Smart Infrastructure Market: Type Estimates & Trend Analysis
                     5.1. Segment Dashboard
                     5.2. Smart Infrastructure Market: Type Movement Analysis, 2023 & 2030 (USD Billion)
                     5.3. Smart Transportation System
                         5.3.1. Market Size Estimates and Forecasts, 2018 - 2030 (USD Billion)
                     5.4. Smart Energy Management System
                         5.4.1. Market Size Estimates and Forecasts, 2018 - 2030 (USD Billion)
                     5.5. Smart Safety & Security Systems
                         5.5.1. Market Size Estimates and Forecasts, 2018 - 2030 (USD Billion)
                     5.6. Smart Waste Management Solutions
                         5.6.1. Market Size Estimates and Forecasts, 2018 - 2030 (USD Billion)
                     5.7. Others
                         5.7.1. Market Size Estimates and Forecasts, 2018 - 2030 (USD Billion)
Chapter 6. Smart Infrastructure Market: End-user Estimates & Trend Analysis
                     6.1. Segment Dashboard
                     6.2. Smart Infrastructure Market: End-user Movement Analysis, 2023 & 2030 (USD Billion)
                     6.3. Residential
                         6.3.1. Market Size Estimates and Forecasts, 2018 - 2030 (USD Billion)
                     6.4. Non-residential
                         6.4.1. Market Size Estimates and Forecasts, 2018 - 2030 (USD Billion)
Chapter 7. Smart Infrastructure Market: Regional Estimates & Trend Analysis
                     7.1. Smart Infrastructure Market Share by Region, 2023 & 2030 (USD Billion)
                     7.2. North America
                         7.2.1. Market Size Estimates and Forecasts, 2018 - 2030 (USD Billion)
                         7.2.2. Market Size Estimates and Forecasts by Offering, 2018 - 2030 (USD Billion)
                         7.2.3. Market Size Estimates and Forecasts by Type, 2018 - 2030 (USD Billion)
                         7.2.4. Market Size Estimates and Forecasts by End-user, 2018 - 2030 (USD Billion)
                         7.2.5. U.S.
                             7.2.5.1. Market Size Estimates and Forecasts, 2018 - 2030 (USD Billion)
                             7.2.5.2. Market Size Estimates and Forecasts by Offering, 2018 - 2030 (USD Billion)
                             7.2.5.3. Market Size Estimates and Forecasts by Type, 2018 - 2030 (USD Billion)
                             7.2.5.4. Market Size Estimates and Forecasts by End-user, 2018 - 2030 (USD Billion)
                         7.2.6. Canada
                             7.2.6.1. Market Size Estimates and Forecasts, 2018 - 2030 (USD Billion)
                             7.2.6.2. Market Size Estimates and Forecasts by Offering, 2018 - 2030 (USD Billion)
                             7.2.6.3. Market Size Estimates and Forecasts by Type, 2018 - 2030 (USD Billion)
                             7.2.6.4. Market Size Estimates and Forecasts by End-user, 2018 - 2030 (USD Billion)
                     7.3. Europe
                         7.3.1. Market Size Estimates and Forecasts, 2018 - 2030 (USD Billion)
                         7.3.2. Market Size Estimates and Forecasts by Offering, 2018 - 2030 (USD Billion)
                         7.3.3. Market Size Estimates and Forecasts by Type, 2018 - 2030 (USD Billion)
                         7.3.4. Market Size Estimates and Forecasts by End-user, 2018 - 2030 (USD Billion)
                         7.3.5. U.K.
                             7.3.5.1. Market Size Estimates and Forecasts, 2018 - 2030 (USD Billion)
                             7.3.5.2. Market Size Estimates and Forecasts by Offering, 2018 - 2030 (USD Billion)
                             7.3.5.3. Market Size Estimates and Forecasts by Type, 2018 - 2030 (USD Billion)
                             7.3.5.4. Market Size Estimates and Forecasts by End-user, 2018 - 2030 (USD Billion)
                         7.3.6. Germany
                             7.3.6.1. Market Size Estimates and Forecasts, 2018 - 2030 (USD Billion)
                             7.3.6.2. Market Size Estimates and Forecasts by Offering, 2018 - 2030 (USD Billion)
                             7.3.6.3. Market Size Estimates and Forecasts by Type, 2018 - 2030 (USD Billion)
                             7.3.6.4. Market Size Estimates and Forecasts by End-user, 2018 - 2030 (USD Billion)
                         7.3.7. France
                             7.3.7.1. Market Size Estimates and Forecasts, 2018 - 2030 (USD Billion)
                             7.3.7.2. Market Size Estimates and Forecasts by Offering, 2018 - 2030 (USD Billion)
                             7.3.7.3. Market Size Estimates and Forecasts by Type, 2018 - 2030 (USD Billion)
                             7.3.7.4. Market Size Estimates and Forecasts by End-user, 2018 - 2030 (USD Billion)
                     7.4. Asia Pacific
                         7.4.1. Market Size Estimates and Forecasts, 2018 - 2030 (USD Billion)
                         7.4.2. Market Size Estimates and Forecasts by Offering, 2018 - 2030 (USD Billion)
                         7.4.3. Market Size Estimates and Forecasts by Type, 2018 - 2030 (USD Billion)
                         7.4.4. Market Size Estimates and Forecasts by End-user, 2018 - 2030 (USD Billion)
                         7.4.5. China
                             7.4.5.1. Market Size Estimates and Forecasts, 2018 - 2030 (USD Billion)
                             7.4.5.2. Market Size Estimates and Forecasts by Offering, 2018 - 2030 (USD Billion)
                             7.4.5.3. Market Size Estimates and Forecasts by Type, 2018 - 2030 (USD Billion)
                             7.4.5.4. Market Size Estimates and Forecasts by End-user, 2018 - 2030 (USD Billion)
                         7.4.6. India
                             7.4.6.1. Market Size Estimates and Forecasts, 2018 - 2030 (USD Billion)
                             7.4.6.2. Market Size Estimates and Forecasts by Offering, 2018 - 2030 (USD Billion)
                             7.4.6.3. Market Size Estimates and Forecasts by Type, 2018 - 2030 (USD Billion)
                             7.4.6.4. Market Size Estimates and Forecasts by End-user, 2018 - 2030 (USD Billion)
                         7.4.7. Japan
                             7.4.7.1. Market Size Estimates and Forecasts, 2018 - 2030 (USD Billion)
                             7.4.7.2. Market Size Estimates and Forecasts by Offering, 2018 - 2030 (USD Billion)
                             7.4.7.3. Market Size Estimates and Forecasts by Type, 2018 - 2030 (USD Billion)
                             7.4.7.4. Market Size Estimates and Forecasts by End-user, 2018 - 2030 (USD Billion)
                         7.4.8. Australia
                             7.4.8.1. Market Size Estimates and Forecasts, 2018 - 2030 (USD Billion)
                             7.4.8.2. Market Size Estimates and Forecasts by Offering, 2018 - 2030 (USD Billion)
                             7.4.8.3. Market Size Estimates and Forecasts by Type, 2018 - 2030 (USD Billion)
                             7.4.8.4. Market Size Estimates and Forecasts by End-user, 2018 - 2030 (USD Billion)
                         7.4.9. South Korea
                             7.4.9.1. Market Size Estimates and Forecasts, 2018 - 2030 (USD Billion)
                             7.4.9.2. Market Size Estimates and Forecasts by Offering, 2018 - 2030 (USD Billion)
                             7.4.9.3. Market Size Estimates and Forecasts by Type, 2018 - 2030 (USD Billion)
                             7.4.9.4. Market Size Estimates and Forecasts by End-user, 2018 - 2030 (USD Billion)
                     7.5. Latin America
                         7.5.1. Market Size Estimates and Forecasts, 2018 - 2030 (USD Billion)
                         7.5.2. Market Size Estimates and Forecasts by Offering, 2018 - 2030 (USD Billion)
                         7.5.3. Market Size Estimates and Forecasts by Type, 2018 - 2030 (USD Billion)
                         7.5.4. Market Size Estimates and Forecasts by End-user, 2018 - 2030 (USD Billion)
                         7.5.5. Brazil
                             7.5.5.1. Market Size Estimates and Forecasts, 2018 - 2030 (USD Billion)
                             7.5.5.2. Market Size Estimates and Forecasts by Offering, 2018 - 2030 (USD Billion)
                             7.5.5.3. Market Size Estimates and Forecasts by Type, 2018 - 2030 (USD Billion)
                             7.5.5.4. Market Size Estimates and Forecasts by End-user, 2018 - 2030 (USD Billion)
                         7.5.6. Mexico
                             7.5.6.1. Market Size Estimates and Forecasts, 2018 - 2030 (USD Billion)
                             7.5.6.2. Market Size Estimates and Forecasts by Offering, 2018 - 2030 (USD Billion)
                             7.5.6.3. Market Size Estimates and Forecasts by Type, 2018 - 2030 (USD Billion)
                             7.5.6.4. Market Size Estimates and Forecasts by End-user, 2018 - 2030 (USD Billion)
                     7.6. Middle East & Africa
                         7.6.1. Market Size Estimates and Forecasts, 2018 - 2030 (USD Billion)
                         7.6.2. Market Size Estimates and Forecasts by Offering, 2018 - 2030 (USD Billion)
                         7.6.3. Market Size Estimates and Forecasts by Type, 2018 - 2030 (USD Billion)
                         7.6.4. Market Size Estimates and Forecasts by End-user, 2018 - 2030 (USD Billion)
                         7.6.5. UAE
                             7.6.5.1. Market Size Estimates and Forecasts, 2018 - 2030 (USD Billion)
                             7.6.5.2. Market Size Estimates and Forecasts by Offering, 2018 - 2030 (USD Billion)
                             7.6.5.3. Market Size Estimates and Forecasts by Type, 2018 - 2030 (USD Billion)
                             7.6.5.4. Market Size Estimates and Forecasts by End-user, 2018 - 2030 (USD Billion)
                         7.6.6. Saudi Arabia
                             7.6.6.1. Market Size Estimates and Forecasts, 2018 - 2030 (USD Billion)
                             7.6.6.2. Market Size Estimates and Forecasts by Offering, 2018 - 2030 (USD Billion)
                             7.6.6.3. Market Size Estimates and Forecasts by Type, 2018 - 2030 (USD Billion)
                             7.6.6.4. Market Size Estimates and Forecasts by End-user, 2018 - 2030 (USD Billion)
                         7.6.7. South Africa
                             7.6.7.1. Market Size Estimates and Forecasts, 2018 - 2030 (USD Billion)
                             7.6.7.2. Market Size Estimates and Forecasts by Offering, 2018 - 2030 (USD Billion)
                             7.6.7.3. Market Size Estimates and Forecasts by Type, 2018 - 2030 (USD Billion)
                             7.6.7.4. Market Size Estimates and Forecasts by End-user, 2018 - 2030 (USD Billion)
Chapter 8. Competitive Landscape
                     8.1. Recent Developments & Impact Analysis by Key Market Participants
                     8.2. Company Categorization
                     8.3. Company Market Positioning
                     8.4. Company Market Share Analysis
                     8.5. Company Heat Map Analysis
                     8.6. Strategy Mapping
                         8.6.1. Expansions
                         8.6.2. Mergers & Acquisition
                         8.6.3. Partnerships & Collaborations
                         8.6.4. New Product Launches
                         8.6.5. Research And Development
                     8.7. Company Profiles
                         8.7.1. ABB
                             8.7.1.1. Participant’s Overview
                             8.7.1.2. Financial Performance
                             8.7.1.3. Product Benchmarking
                             8.7.1.4. Recent Developments
                         8.7.2. Aclara Technologies LLC (Hubbell Incorporated)
                             8.7.2.1. Participant’s Overview
                             8.7.2.2. Financial Performance
                             8.7.2.3. Product Benchmarking
                             8.7.2.4. Recent Developments
                         8.7.3. Broadcom, Inc. (VMware)
                             8.7.3.1. Participant’s Overview
                             8.7.3.2. Financial Performance
                             8.7.3.3. Product Benchmarking
                             8.7.3.4. Recent Developments
                         8.7.4. Cisco Systems, Inc.
                             8.7.4.1. Participant’s Overview
                             8.7.4.2. Financial Performance
                             8.7.4.3. Product Benchmarking
                             8.7.4.4. Recent Developments
                         8.7.5. Dynamic Ratings
                             8.7.5.1. Participant’s Overview
                             8.7.5.2. Financial Performance
                             8.7.5.3. Product Benchmarking
                             8.7.5.4. Recent Developments
                         8.7.6. Honeywell International Inc.
                             8.7.6.1. Participant’s Overview
                             8.7.6.2. Financial Performance
                             8.7.6.3. Product Benchmarking
                             8.7.6.4. Recent Developments
                         8.7.7. Hewlett Packard Enterprise Development LP
                             8.7.7.1. Participant’s Overview
                             8.7.7.2. Financial Performance
                             8.7.7.3. Product Benchmarking
                             8.7.7.4. Recent Developments
                         8.7.8. Huawei Technologies Co., Ltd.
                             8.7.8.1. Participant’s Overview
                             8.7.8.2. Financial Performance
                             8.7.8.3. Product Benchmarking
                             8.7.8.4. Recent Developments
                         8.7.9. International Business Machines Corporation
                             8.7.9.1. Participant’s Overview
                             8.7.9.2. Financial Performance
                             8.7.9.3. Product Benchmarking
                             8.7.9.4. Recent Developments
                         8.7.10. L&T Technology Services Limited
                             8.7.10.1. Participant’s Overview
                             8.7.10.2. Financial Performance
                             8.7.10.3. Product Benchmarking
                             8.7.10.4. Recent Developments
                         8.7.11. Panamax Infotech
                             8.7.11.1. Participant’s Overview
                             8.7.11.2. Financial Performance
                             8.7.11.3. Product Benchmarking
                             8.7.11.4. Recent Developments
                         8.7.12. Schneider Electric
                             8.7.12.1. Participant’s Overview
                             8.7.12.2. Financial Performance
                             8.7.12.3. Product Benchmarking
                             8.7.12.4. Recent Developments
                         8.7.13. Siemens
                             8.7.13.1. Participant’s Overview
                             8.7.13.2. Financial Performance
                             8.7.13.3. Product Benchmarking
                             8.7.13.4. Recent Developments
                         8.7.14. Wipro
                             8.7.14.1. Participant’s Overview
                             8.7.14.2. Financial Performance
                             8.7.14.3. Product Benchmarking
                             8.7.14.4. Recent Developments
                         8.7.15. Xylem (Sensus)
                             8.7.15.1. Participant’s Overview
                             8.7.15.2. Financial Performance
                             8.7.15.3. Product Benchmarking
                             8.7.15.4. Recent Developments


List of Tables

Table 1 Smart Infrastructure Market 2018 - 2030 (USD Billion)
Table 2 Global smart infrastructure market estimates and forecasts by region, 2018 - 2030 (USD Billion)
Table 3 Global smart infrastructure market estimates and forecasts by offering, 2018 - 2030 (USD Billion)
Table 4 Global smart infrastructure market estimates and forecasts by type, 2018 - 2030 (USD Billion)
Table 5 Global smart infrastructure market estimates and forecasts by End-user, 2018 - 2030 (USD Billion)
Table 6 Offering market by region, 2018 - 2030 (USD Billion)
Table 7 Products market by region, 2018 - 2030 (USD Billion)
Table 8 Services market by region, 2018 - 2030 (USD Billion)
Table 9 Type market by region, 2018 - 2030 (USD Billion)
Table 10 Smart transportation system market by region, 2018 - 2030 (USD Billion)
Table 11 Smart energy management system market by region, 2018 - 2030 (USD Billion)
Table 12 Smart safety & security systems market by region, 2018 - 2030 (USD Billion)
Table 13 Smart waste management solutions market by region, 2018 - 2030 (USD Billion)
Table 14 Others market by region, 2018 - 2030 (USD Billion)
Table 15 End-user market by region, 2018 - 2030 (USD Billion)
Table 16 Residential market by region, 2018 - 2030 (USD Billion)
Table 17 Non-residential market by region, 2018 - 2030 (USD Billion)
Table 18 North America smart infrastructure market, by offering, 2018 - 2030 (Revenue, USD Billion)
Table 19 North America smart infrastructure market, by type, 2018 - 2030 (Revenue, USD Billion)
Table 20 North America smart infrastructure market, by End-user, 2018 - 2030 (Revenue, USD Billion)
Table 21 U.S. smart infrastructure market, by offering, 2018 - 2030 (Revenue, USD Billion)
Table 22 U.S. smart infrastructure market, by type, 2018 - 2030 (Revenue, USD Billion)
Table 23 U.S. smart infrastructure market, by End-user, 2018 - 2030 (Revenue, USD Billion)
Table 24 Canada smart infrastructure market, by offering, 2018 - 2030 (Revenue, USD Billion)
Table 25 Canada smart infrastructure market, by type, 2018 - 2030 (Revenue, USD Billion)
Table 26 Canada smart infrastructure market, by End-user, 2018 - 2030 (Revenue, USD Billion)
Table 27 Europe smart infrastructure market, by offering, 2018 - 2030 (Revenue, USD Billion)
Table 28 Europe smart infrastructure market, by type, 2018 - 2030 (Revenue, USD Billion)
Table 29 Europe smart infrastructure market, by End-user, 2018 - 2030 (Revenue, USD Billion)
Table 30 U.K. smart infrastructure market, by offering, 2018 - 2030 (Revenue, USD Billion)
Table 31 U.K. smart infrastructure market, by type, 2018 - 2030 (Revenue, USD Billion)
Table 32 U.K. smart infrastructure market, by End-user, 2018 - 2030 (Revenue, USD Billion)
Table 33 Germany smart infrastructure market, by offering, 2018 - 2030 (Revenue, USD Billion)
Table 34 Germany smart infrastructure market, by type, 2018 - 2030 (Revenue, USD Billion)
Table 35 Germany smart infrastructure market, by End-user, 2018 - 2030 (Revenue, USD Billion)
Table 36 France smart infrastructure market, by offering, 2018 - 2030 (Revenue, USD Billion)
Table 37 France smart infrastructure market, by type, 2018 - 2030 (Revenue, USD Billion)
Table 38 France smart infrastructure market, by End-user, 2018 - 2030 (Revenue, USD Billion)
Table 39 Asia Pacific smart infrastructure market, by offering, 2018 - 2030 (Revenue, USD Billion)
Table 40 Asia Pacific smart infrastructure market, by type, 2018 - 2030 (Revenue, USD Billion)
Table 41 Asia Pacific smart infrastructure market, by End-user, 2018 - 2030 (Revenue, USD Billion)
Table 42 China smart infrastructure market, by offering, 2018 - 2030 (Revenue, USD Billion)
Table 43 China smart infrastructure market, by type, 2018 - 2030 (Revenue, USD Billion)
Table 44 China smart infrastructure market, by End-user, 2018 - 2030 (Revenue, USD Billion)
Table 45 India smart infrastructure market, by offering, 2018 - 2030 (Revenue, USD Billion)
Table 46 India smart infrastructure market, by type, 2018 - 2030 (Revenue, USD Billion)
Table 47 India smart infrastructure market, by End-user, 2018 - 2030 (Revenue, USD Billion)
Table 48 Japan smart infrastructure market, by offering, 2018 - 2030 (Revenue, USD Billion)
Table 49 Japan smart infrastructure market, by type, 2018 - 2030 (Revenue, USD Billion)
Table 50 Japan smart infrastructure market, by End-user, 2018 - 2030 (Revenue, USD Billion)
Table 51 Australia smart infrastructure market, by offering, 2018 - 2030 (Revenue, USD Billion)
Table 52 Australia smart infrastructure market, by type, 2018 - 2030 (Revenue, USD Billion)
Table 53 Australia smart infrastructure market, by End-user, 2018 - 2030 (Revenue, USD Billion)
Table 54 South Korea smart infrastructure market, by offering, 2018 - 2030 (Revenue, USD Billion)
Table 55 South Korea smart infrastructure market, by type, 2018 - 2030 (Revenue, USD Billion)
Table 56 South Korea smart infrastructure market, by End-user, 2018 - 2030 (Revenue, USD Billion)
Table 57 Latin America smart infrastructure market, by offering, 2018 - 2030 (Revenue, USD Billion)
Table 58 Latin America smart infrastructure market, by type, 2018 - 2030 (Revenue, USD Billion)
Table 59 Latin America smart infrastructure market, by End-user, 2018 - 2030 (Revenue, USD Billion)
Table 60 Brazil smart infrastructure market, by offering, 2018 - 2030 (Revenue, USD Billion)
Table 61 Brazil smart infrastructure market, by type, 2018 - 2030 (Revenue, USD Billion)
Table 62 Brazil smart infrastructure market, by End-user, 2018 - 2030 (Revenue, USD Billion)
Table 63 Mexico smart infrastructure market, by offering, 2018 - 2030 (Revenue, USD Billion)
Table 64 Mexico smart infrastructure market, by type, 2018 - 2030 (Revenue, USD Billion)
Table 65 Mexico smart infrastructure market, by End-user, 2018 - 2030 (Revenue, USD Billion)
Table 66 MEA smart infrastructure market, by offering, 2018 - 2030 (Revenue, USD Billion)
Table 67 MEA smart infrastructure market, by type, 2018 - 2030 (Revenue, USD Billion)
Table 68 MEA smart infrastructure market, by End-user, 2018 - 2030 (Revenue, USD Billion)
Table 69 UAE smart infrastructure market, by offering, 2018 - 2030 (Revenue, USD Billion)
Table 70 UAE smart infrastructure market, by type, 2018 - 2030 (Revenue, USD Billion)
Table 71 UAE smart infrastructure market, by End-user, 2018 - 2030 (Revenue, USD Billion)
Table 72 Saudi Arabia smart infrastructure market, by offering, 2018 - 2030 (Revenue, USD Billion)
Table 73 Saudi Arabia smart infrastructure market, by type, 2018 - 2030 (Revenue, USD Billion)
Table 74 Saudi Arabia smart infrastructure market, by End-user, 2018 - 2030 (Revenue, USD Billion)
Table 75 South Africa smart infrastructure market, by offering, 2018 - 2030 (Revenue, USD Billion)
Table 76 South Africa smart infrastructure market, by type, 2018 - 2030 (Revenue, USD Billion)
Table 77 South Africa smart infrastructure market, by End-user, 2018 - 2030 (Revenue, USD Billion)


List of Figures

Fig. 1 Smart Infrastructure Market Segmentation
Fig. 2 Market landscape
Fig. 3 Information Procurement
Fig. 4 Data Analysis Models
Fig. 5 Market Formulation and Validation
Fig. 6 Data Validating & Publishing
Fig. 7 Market Snapshot
Fig. 8 Segment Snapshot (1/2)
Fig. 9 Segment Snapshot (2/2)
Fig. 10 Competitive Landscape Snapshot
Fig. 11 Smart Infrastructure - Market Size and Growth Prospects (USD Billion)
Fig. 12 Smart Infrastructure Market: Industry Value Chain Analysis
Fig. 13 Smart Infrastructure Market: Market Dynamics
Fig. 14 Smart Infrastructure Market: Porter’s Five Forces Analysis
Fig. 15 Smart Infrastructure Market: PESTEL Analysis
Fig. 16 Smart Infrastructure Market Share by Offering, 2023 & 2030 (USD Billion)
Fig. 17 Smart Infrastructure Market, by Offering: Market Share, 2023 & 2030
Fig. 18 Products Market Estimates & Forecasts, 2018 - 2030 (Revenue, USD Billion)
Fig. 19 Services Market Estimates & Forecasts, 2018 - 2030 (Revenue, USD Billion)
Fig. 20 Smart Infrastructure Market Share by Type, 2023 & 2030 (USD Billion)
Fig. 21 Smart Infrastructure Market, by Type: Market Share, 2023 & 2030
Fig. 22 Smart Transportation System Market Estimates & Forecasts, 2018 - 2030 (Revenue, USD Billion)
Fig. 23 Smart Energy Management System Market Estimates & Forecasts, 2018 - 2030 (Revenue, USD Billion)
Fig. 24 Smart Safety & Security Systems Market Estimates & Forecasts, 2018 - 2030 (Revenue, USD Billion)
Fig. 25 Smart Waste Management Solutions Market Estimates & Forecasts, 2018 - 2030 (Revenue, USD Billion)
Fig. 26 Others Market Estimates & Forecasts, 2018 - 2030 (Revenue, USD Billion)
Fig. 27 Smart Infrastructure Market Share by End-user, 2023 & 2030 (USD Billion)
Fig. 28 Smart Infrastructure Market, by End-user: Market Share, 2023 & 2030
Fig. 29 Residential Market Estimates & Forecasts, 2018 - 2030 (Revenue, USD Billion)
Fig. 30 Non-residential Market Estimates & Forecasts, 2018 - 2030 (Revenue, USD Billion)
Fig. 31 Regional Marketplace: Key Takeaways
Fig. 32 North America Smart Infrastructure Market Estimates and Forecasts, 2018 - 2030 (USD Billion)
Fig. 33 U.S. Smart Infrastructure Market Estimates and Forecasts, 2018 - 2030 (USD Billion)
Fig. 34 Canada Smart Infrastructure Market Estimates and Forecasts, 2018 - 2030 (USD Billion)
Fig. 35 Europe Smart Infrastructure Market Estimates and Forecasts, 2018 - 2030 (USD Billion)
Fig. 36 U.K. Smart Infrastructure Market Estimates and Forecasts, 2018 - 2030 (USD Billion)
Fig. 37 Germany Smart Infrastructure Market Estimates and Forecasts, 2018 - 2030 (USD Billion)
Fig. 38 France Smart Infrastructure Market Estimates and Forecasts, 2018 - 2030 (USD Billion)
Fig. 39 Asia Pacific Smart Infrastructure Market Estimates and Forecast, 2018 - 2030 (USD Billion)
Fig. 40 China Smart Infrastructure Market Estimates and Forecasts, 2018 - 2030 (USD Billion)
Fig. 41 Japan Smart Infrastructure Market Estimates and Forecasts, 2018 - 2030 (USD Billion)
Fig. 42 India Smart Infrastructure Market Estimates and Forecasts, 2018 - 2030 (USD Billion)
Fig. 43 South Korea Smart Infrastructure Market Estimates and Forecasts, 2018 - 2030 (USD Billion)
Fig. 44 Australia Smart Infrastructure Market Estimates and Forecasts, 2018 - 2030 (USD Billion)
Fig. 45 Latin America Smart Infrastructure Market Estimates and Forecasts, 2018 - 2030 (USD Billion)
Fig. 46 Brazil Smart Infrastructure Market Estimates and Forecasts, 2018 - 2030 (USD Billion)
Fig. 47 Mexico Smart Infrastructure Market Estimates and Forecasts, 2018 - 2030 (USD Billion)
Fig. 48 MEA Smart Infrastructure Market Estimates and Forecasts, 2018 - 2030 (USD Billion)
Fig. 49 Saudi Arabia Smart Infrastructure Market Estimates and Forecasts, 2018 - 2030 (USD Billion)
Fig. 50 UAE Smart Infrastructure Market Estimates and Forecasts, 2018 - 2030 (USD Billion)
Fig. 51 South Africa Smart Infrastructure Market Estimates and Forecasts, 2018 - 2030 (USD Billion)
Fig. 52 Key Company Categorization
Fig. 53 Company Market Positioning
Fig. 54 Key Company Market Share Analysis, 2023
Fig. 55 Strategic Framework

What questions do you have? Get quick response from our industry experts. Request a Free Consultation

Market Segmentation

  • Smart Infrastructure Offering Outlook (Revenue, USD Billion, 2018 - 2030)
    • Products
    • Services
  • Smart Infrastructure Type Outlook (Revenue, USD Billion, 2018 - 2030)
    • Smart Transportation System
    • Smart Energy Management System
    • Smart Safety & Security Systems
    • Smart Waste Management Solutions
    • Others
  • Smart Infrastructure End-user Outlook (Revenue, USD Billion, 2018 - 2030)
    • Residential
    • Non-residential
  • Smart Infrastructure Regional Outlook (Revenue, USD Billion, 2018 - 2030)
    • North America
      • North America Smart Infrastructure Market Offering Outlook
        • Products
        • Services
      • North America Smart Infrastructure Market Type Outlook
        • Smart Transportation System
        • Smart Energy Management System
        • Smart Safety & Security Systems
        • Smart Waste Management Solutions
        • Others
      • North America Smart Infrastructure Market End-user Outlook
        • Residential
        • Non-residential
      • U.S.
        • U.S. Smart Infrastructure Market Offering Outlook
          • Products
          • Services
        • U.S. Smart Infrastructure Market Type Outlook
          • Smart Transportation System
          • Smart Energy Management System
          • Smart Safety & Security Systems
          • Smart Waste Management Solutions
          • Others
        • U.S. Smart Infrastructure Market End-user Outlook
          • Residential
          • Non-residential
      • Canada
        • Canada Smart Infrastructure Market Offering Outlook
          • Products
          • Services
        • Canada Smart Infrastructure Market Type Outlook
          • Smart Transportation System
          • Smart Energy Management System
          • Smart Safety & Security Systems
          • Smart Waste Management Solutions
          • Others
        • Canada Smart Infrastructure Market End-user Outlook
          • Residential
          • Non-residential
    • Europe
      • Europe Smart Infrastructure Market Offering Outlook
        • Products
        • Services
      • Europe Smart Infrastructure Market Type Outlook
        • Smart Transportation System
        • Smart Energy Management System
        • Smart Safety & Security Systems
        • Smart Waste Management Solutions
        • Others
      • Europe Smart Infrastructure Market End-user Outlook
        • Residential
        • Non-residential
      • U.K.
        • U.K. Smart Infrastructure Market Offering Outlook
          • Products
          • Services
        • U.K. Smart Infrastructure Market Type Outlook
          • Smart Transportation System
          • Smart Energy Management System
          • Smart Safety & Security Systems
          • Smart Waste Management Solutions
          • Others
        • U.K. Smart Infrastructure Market End-user Outlook
          • Residential
          • Non-residential
      • Germany
        • Germany Smart Infrastructure Market Offering Outlook
          • Products
          • Services
        • Germany Smart Infrastructure Market Type Outlook
          • Smart Transportation System
          • Smart Energy Management System
          • Smart Safety & Security Systems
          • Smart Waste Management Solutions
          • Others
        • Germany Smart Infrastructure Market End-user Outlook
          • Residential
          • Non-residential
      • France
        • France Smart Infrastructure Market  Offering Outlook
          • Products
          • Services
        • France Smart Infrastructure Market Type Outlook
          • Smart Transportation System
          • Smart Energy Management System
          • Smart Safety & Security Systems
          • Smart Waste Management Solutions
          • Others
        • France Smart Infrastructure Market End-user Outlook
          • Residential
          • Non-residential
    • Asia Pacific
      • Asia Pacific Smart Infrastructure Market Offering Outlook
        • Products
        • Services
      • Asia Pacific Smart Infrastructure Market Type Outlook
        • Smart Transportation System
        • Smart Energy Management System
        • Smart Safety & Security Systems
        • Smart Waste Management Solutions
        • Others
      • Asia Pacific Smart Infrastructure Market End-user Outlook
        • Residential
        • Non-residential
      • China
        • China Smart Infrastructure Market Offering Outlook
          • Products
          • Services
        • China Smart Infrastructure Market Type Outlook
          • Smart Transportation System
          • Smart Energy Management System
          • Smart Safety & Security Systems
          • Smart Waste Management Solutions
          • Others
        • China Smart Infrastructure Market End-user Outlook
          • Residential
          • Non-residential
      • India
        • India Smart Infrastructure Market Offering Outlook
          • Products
          • Services
        • India Smart Infrastructure Market Type Outlook
          • Smart Transportation System
          • Smart Energy Management System
          • Smart Safety & Security Systems
          • Smart Waste Management Solutions
          • Others
        • India Smart Infrastructure Market End-user Outlook
          • Residential
          • Non-residential
      • Japan
        • Japan Smart Infrastructure Market Offering Outlook
          • Products
          • Services
        • Japan Smart Infrastructure Market Type Outlook
          • Smart Transportation System
          • Smart Energy Management System
          • Smart Safety & Security Systems
          • Smart Waste Management Solutions
          • Others
        • Japan Smart Infrastructure Market End-user Outlook
          • Residential
          • Non-residential
      • Australia
        • Australia Smart Infrastructure Market Offering Outlook
          • Products
          • Services
        • Australia Smart Infrastructure Market Type Outlook
          • Smart Transportation System
          • Smart Energy Management System
          • Smart Safety & Security Systems
          • Smart Waste Management Solutions
          • Others
        • Australia Smart Infrastructure Market End-user Outlook
          • Residential
          • Non-residential
      • South Korea
        • South Korea Smart Infrastructure Market Offering Outlook
          • Products
          • Services
        • South Korea Smart Infrastructure Market Type Outlook
          • Smart Transportation System
          • Smart Energy Management System
          • Smart Safety & Security Systems
          • Smart Waste Management Solutions
          • Others
        • South Korea Smart Infrastructure Market End-user Outlook
          • Residential
          • Non-residential
    • Latin America
      • Latin America Smart Infrastructure Market Offering Outlook
        • Products
        • Services
      • Latin America Smart Infrastructure Market Type Outlook
        • Smart Transportation System
        • Smart Energy Management System
        • Smart Safety & Security Systems
        • Smart Waste Management Solutions
        • Others
      • Latin America Smart Infrastructure Market End-user Outlook
        • Residential
        • Non-residential
      • Brazil
        • Brazil Smart Infrastructure Market Offering Outlook
          • Products
          • Services
        • Brazil Smart Infrastructure Market Type Outlook
          • Smart Transportation System
          • Smart Energy Management System
          • Smart Safety & Security Systems
          • Smart Waste Management Solutions
          • Others
        • Brazil Smart Infrastructure Market End-user Outlook
          • Residential
          • Non-residential
      • Mexico
        • Mexico Smart Infrastructure Market Offering Outlook
          • Products
          • Services
        • Mexico Smart Infrastructure Market Type Outlook
          • Smart Transportation System
          • Smart Energy Management System
          • Smart Safety & Security Systems
          • Smart Waste Management Solutions
          • Others
        • Mexico Smart Infrastructure Market End-user Outlook
          • Residential
          • Non-residential
    • MEA
      • MEA Smart Infrastructure Market Offering Outlook
        • Products
        • Services
      • MEA Smart Infrastructure Market Type Outlook
        • Smart Transportation System
        • Smart Energy Management System
        • Smart Safety & Security Systems
        • Smart Waste Management Solutions
        • Others
      • MEA Smart Infrastructure Market End-user Outlook
        • Residential
        • Non-residential
      • UAE
        • UAE Smart Infrastructure Market Offering Outlook
          • Products
          • Services
        • UAE Smart Infrastructure Market Type Outlook
          • Smart Transportation System
          • Smart Energy Management System
          • Smart Safety & Security Systems
          • Smart Waste Management Solutions
          • Others
        • UAE Smart Infrastructure Market End-user Outlook
          • Residential
          • Non-residential
      • Saudi Arabia
        • Saudi Arabia Smart Infrastructure Market Offering Outlook
          • Products
          • Services
        • Saudi Arabia Smart Infrastructure Market Type Outlook
          • Smart Transportation System
          • Smart Energy Management System
          • Smart Safety & Security Systems
          • Smart Waste Management Solutions
          • Others
        • Saudi Arabia Smart Infrastructure Market End-user Outlook
          • Residential
          • Non-residential
      • South Africa
        • South Africa Smart Infrastructure Market Offering Outlook
          • Products
          • Services
        • South Africa Smart Infrastructure Market Type Outlook
          • Smart Transportation System
          • Smart Energy Management System
          • Smart Safety & Security Systems
          • Smart Waste Management Solutions
          • Others
        • South Africa Smart Infrastructure Market End-user Outlook
          • Residential
          • Non-residential

Report content

Qualitative Analysis

  • Industry overview
  • Industry trends
  • Market drivers and restraints
  • Market size
  • Growth prospects
  • Porter’s analysis
  • PESTEL analysis
  • Key market opportunities prioritized
  • Competitive landscape
    • Company overview
    • Financial performance
    • Product benchmarking
    • Latest strategic developments

Quantitative Analysis

  • Market size, estimates, and forecast from 2018 to 2030
  • Market estimates and forecast for product segments up to 2030
  • Regional market size and forecast for product segments up to 2030
  • Market estimates and forecast for application segments up to 2030
  • Regional market size and forecast for application segments up to 2030
  • Company financial performance
What questions do you have? Get quick response from our industry experts. Request a Free Consultation

Research Methodology

Grand View Research employs a comprehensive and iterative research methodology focused on minimizing deviance in order to provide the most accurate estimates and forecast possible. The company utilizes a combination of bottom-up and top-down approaches for segmenting and estimating quantitative aspects of the market. In Addition, a recurring theme prevalent across all our research reports is data triangulation that looks market from three different perspectives. Critical elements of the methodology employed for all our studies include:

Preliminary data mining

Raw market data is obtained and collated on a broad front. Data is continuously filtered to ensure that only validated and authenticated sources are considered. In addition, data is also mined from a host of reports in our repository, as well as a number of reputed paid databases. For a comprehensive understanding of the market, it is essential to understand the complete value chain, and in order to facilitate this; we collect data from raw material suppliers, distributors as well as buyers.

Technical issues and trends are obtained from surveys, technical symposia, and trade journals. Technical data is also gathered from an intellectual property perspective, focusing on white space and freedom of movement. Industry dynamics with respect to drivers, restraints, pricing trends are also gathered. As a result, the material developed contains a wide range of original data that is then further cross-validated and authenticated with published sources.

Statistical model

Our market estimates and forecasts are derived through simulation models. A unique model is created customized for each study. Gathered information for market dynamics, technology landscape, application development, and pricing trends are fed into the model and analyzed simultaneously. These factors are studied on a comparative basis, and their impact over the forecast period is quantified with the help of correlation, regression, and time series analysis. Market forecasting is performed via a combination of economic tools, technological analysis, industry experience, and domain expertise.

Econometric models are generally used for short-term forecasting, while technological market models are used for long-term forecasting. These are based on an amalgamation of the technology landscape, regulatory frameworks, economic outlook, and business principles. A bottom-up approach to market estimation is preferred, with key regional markets analyzed as separate entities and integration of data to obtain global estimates. This is critical for a deep understanding of the industry as well as ensuring minimal errors. Some of the parameters considered for forecasting include:

    • Market drivers and restraints, along with their current and expected impact
    • Raw material scenario and supply v/s price trends
    • Regulatory scenario and expected developments
    • Current capacity and expected capacity additions up to 2030

We assign weights to these parameters and quantify their market impact using weighted average analysis, to derive an expected market growth rate.

Primary validation

This is the final step in estimating and forecasting for our reports. Exhaustive primary interviews are conducted, face to face as well as over the phone to validate our findings and assumptions used to obtain them. Interviewees are approached from leading companies across the value chain including suppliers, technology providers, domain experts, and buyers so as to ensure a holistic and unbiased picture of the market. These interviews are conducted across the globe, with language barriers overcome with the aid of local staff and interpreters. Primary interviews not only help in data validation but also provide critical insights into the market, current business scenario, and future expectations and enhance the quality of our reports. All our estimates and forecast are verified through exhaustive primary research with Key Industry Participants (KIPs) which typically include:

    • Market-leading companies
    • Raw material suppliers
    • Product distributors
    • Buyers

The key objectives of primary research are as follows:

    • To validate our data in terms of accuracy and acceptability
    • To gain an insight in to the current market and future expectations

Data Collection Matrix

Perspective

Primary research

Secondary research

Supply-side

  • Manufacturers
  • Technology distributors and wholesalers
  • Company reports and publications
  • Government publications
  • Independent investigations
  • Economic and demographic data

Demand-side

  • End-user surveys
  • Consumer surveys
  • Mystery shopping
  • Case studies
  • Reference customers


Industry Analysis Matrix

Qualitative analysis

Quantitative analysis

  • Industry landscape and trends
  • Market dynamics and key issues
  • Technology landscape
  • Market opportunities
  • Porter’s analysis and PESTEL analysis
  • Competitive landscape and component benchmarking
  • Policy and regulatory scenario
  • Market revenue estimates and forecast up to 2030
  • Market revenue estimates and forecasts up to 2030, by technology
  • Market revenue estimates and forecasts up to 2030, by application
  • Market revenue estimates and forecasts up to 2030, by type
  • Market revenue estimates and forecasts up to 2030, by component
  • Regional market revenue forecasts, by technology
  • Regional market revenue forecasts, by application
  • Regional market revenue forecasts, by type
  • Regional market revenue forecasts, by component


What questions do you have? Get quick response from our industry experts. Request a Free Consultation
gvr icn

GET A FREE SAMPLE

gvr icn

This FREE sample includes data points, ranging from trend analyses to estimates and forecasts. See for yourself.

gvr icn

NEED A CUSTOM REPORT?

We can customize every report - free of charge - including purchasing stand-alone sections or country-level reports, as well as offer affordable discounts for start-ups & universities. Contact us now

Certified Icon

We are GDPR and CCPA compliant! Your transaction & personal information is safe and secure. For more details, please read our privacy policy.