
- Home
- »
- Automotive & Transportation
- »
-
Car Sharing Market Size, Share & Trends Report, 2026-2033GVR Report cover

Car Sharing Market (2026 - 2033)
Size, Share & Trends Analysis Report By Booking Mode (Online, Offline), By Fuel, By Vehicle (Hatchback, Sedan, SUV), By Application (Corporate, Individual), By Type (Round-trip, One-way), By Region, And Segment Forecasts
Market Size, 2025
$12.0BMarket Estimate, 2026
$14.2BMarket Forecast, 2033
$46.5BCAGR, 2026–2033
18.5%Car Sharing Market Summary
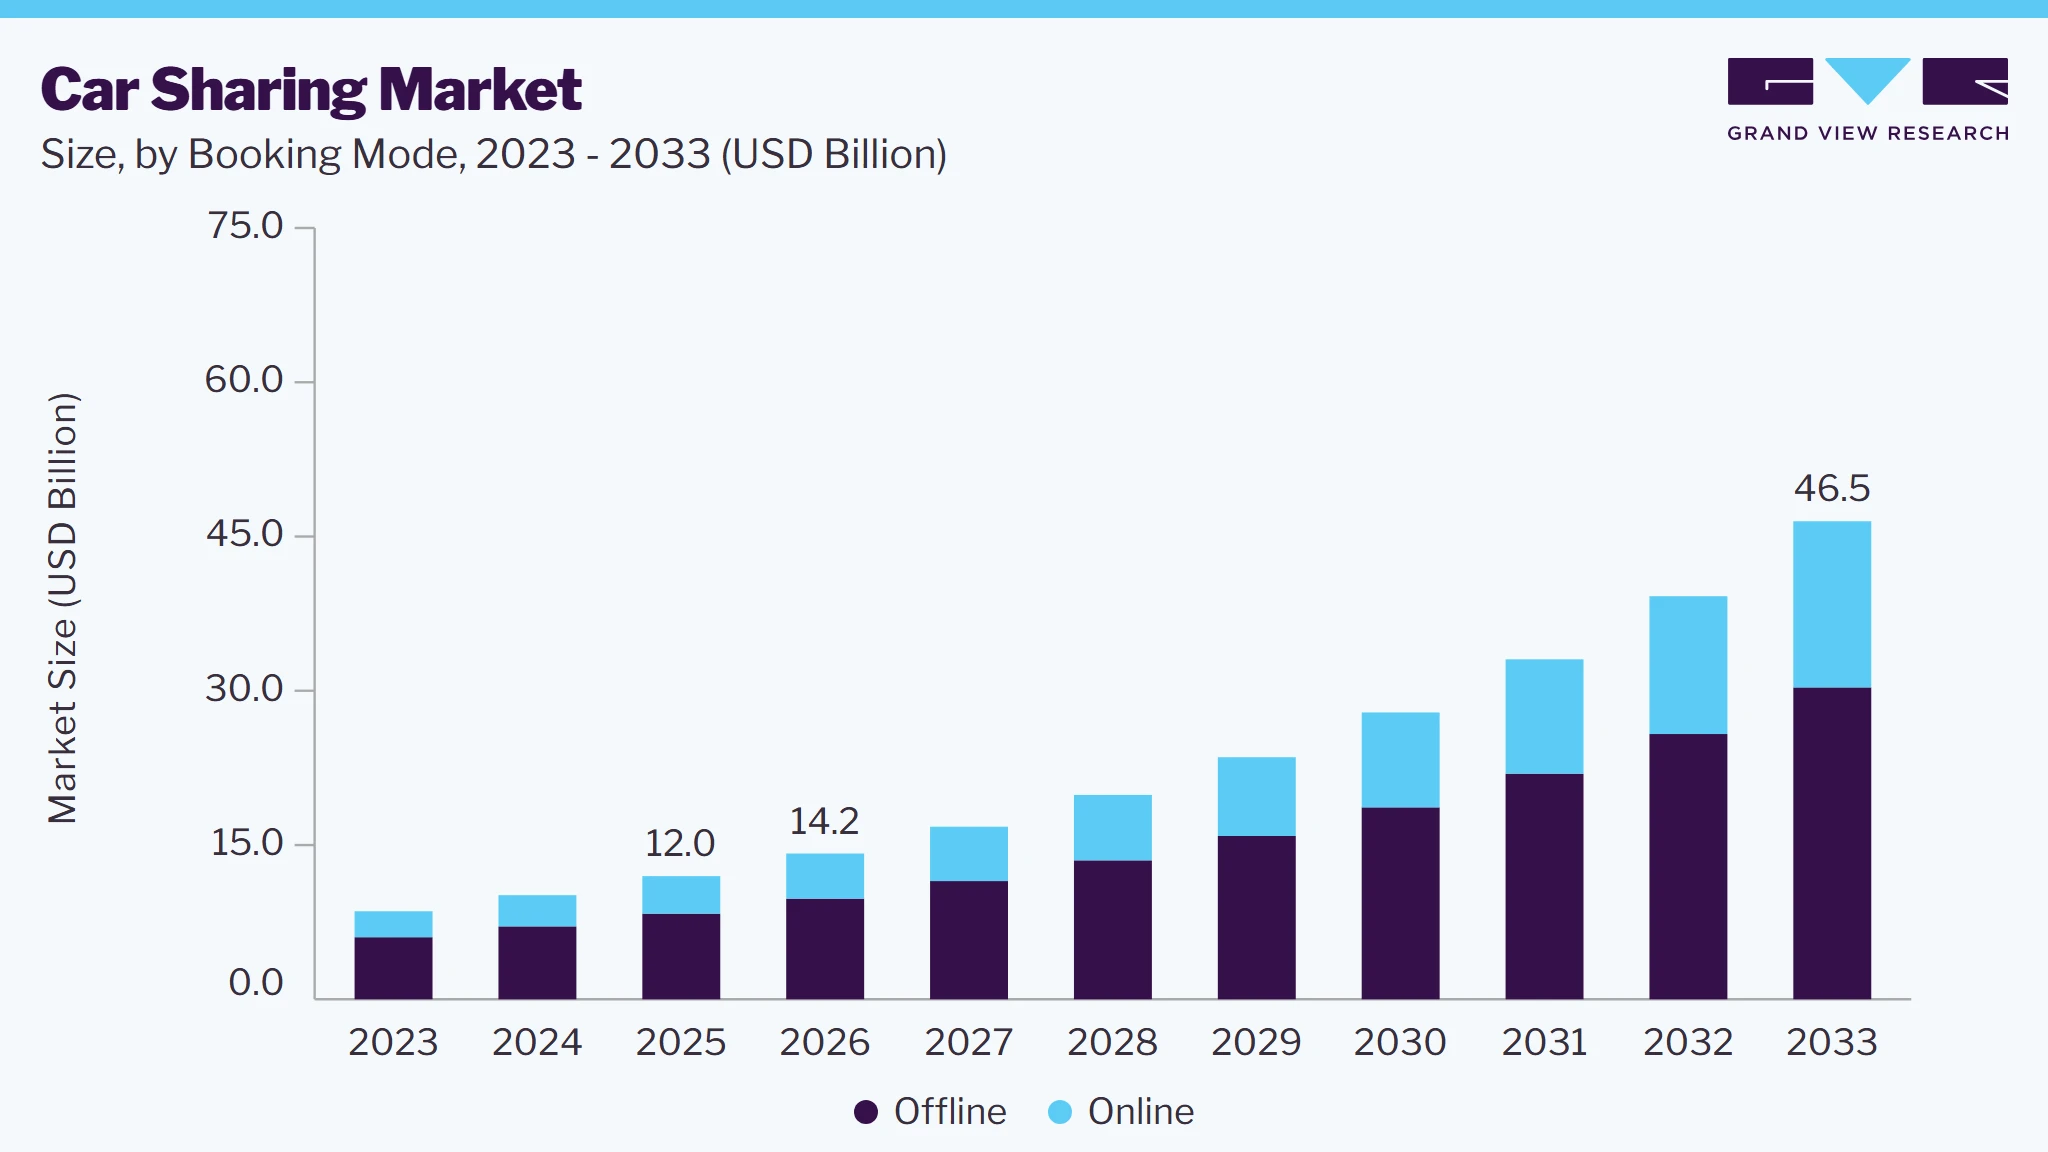
The global car sharing market size was valued at USD 12.0 billion in 2025 and is projected to grow from USD 14.2 billion in 2026 to USD 46.5 billion by 2033, at a CAGR of 18.5% from 2026 to 2033. North America dominated the market, accounting for a revenue share of 30.3% in 2025. Consumers are increasingly moving beyond traditional hourly or daily car sharing toward monthly subscriptions, prepaid packages, and longer-duration vehicle access, offering greater flexibility without the financial commitment of ownership.
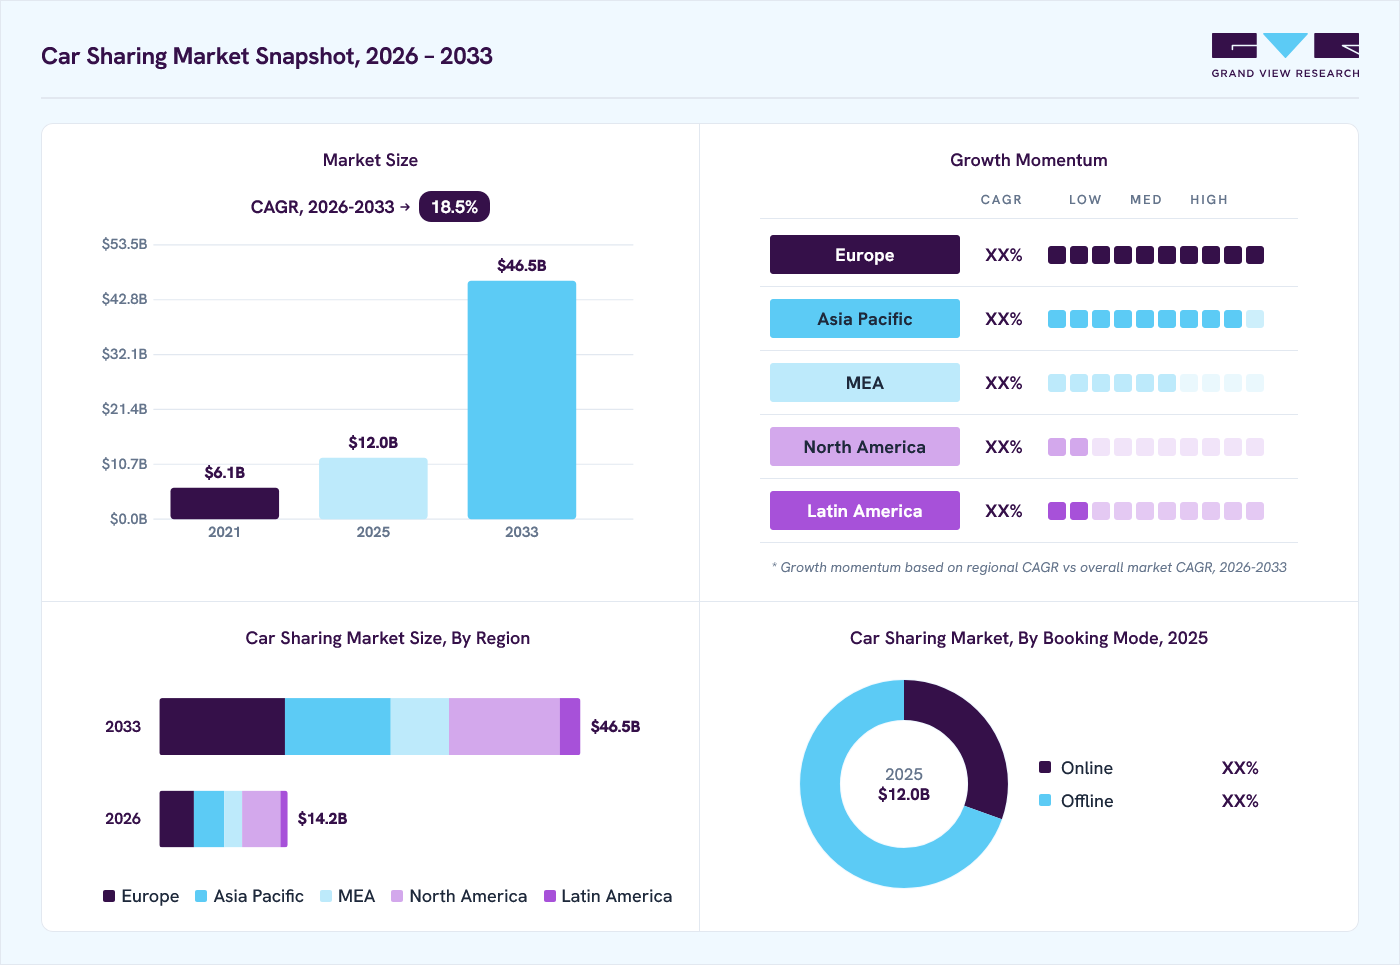 Source: Grand View Research, IR Documents, Primary Interviews, Paid DatabasesTo learn more about this report,
 Download Free Sample Report
 Key Market Trends & Insights
- By booking mode: Offline segment dominated the market, with a revenue share of 69.5% in 2025.
- By fuel: Gasoline/diesel (ICE) segment dominated the market, with a revenue share of 52.8% in 2025.
- By vehicle: Hatchback segment dominated the market, with a revenue share of 37.7% in 2025.
- By application: Corporate segment held the largest market share of 50.8% in 2025.
- By type: Round-trip segment held the largest market share of 32.0% in 2025.
Regional Highlights
- Largest regional market: North America (30.3% revenue share, 2025)
- Fastest-growing regional market: Europe (highest CAGR, 2026-2033)
- By country: The U.S. held the largest market share in 2025
Market Size & Forecast
- Market size in 2025: USD 12.0 Billion
- Estimated market size in 2026: USD 14.2 Billion
- Projected market size by 2033: USD 46.5 Billion
- CAGR (2026-2033): 18.5%
Three ways to get this report
Buy it, customize it, or ask a question.Ask an Analyst
A direct answer, usually in 1 working day
- AccessReport author, directly
- Reply timeWithin 1 working day
- No sales callDirect answer only
- FormatEmail reply
- CostFree, no cost
Get the Full Report
What the study covers
- FormatsPDF · Excel · Dashboard
- Timeline2026–2033 annual, 2025 base
- Coverage20+ countries, 5 regions
- Companies10+ key players profiled
Customize the Report
20% free customization
- IncludeCountries, segments, points
- TailorTo your product definition
- ExtendDeeper competitor detail
- OrA fully bespoke study
- Turnaround5–10 working days
The rapid urbanization and rising population density in major cities are driving demand for flexible, cost-effective mobility solutions such as car sharing. Rising vehicle purchase prices, insurance, fuel, maintenance, and parking expenses are making private vehicle ownership less attractive, particularly among younger urban consumers. Car-sharing services provide access to vehicles without the long-term financial commitment associated with ownership. Parking constraints and congestion in densely populated cities further strengthen the value proposition of shared vehicles. Moreover, research indicates that car-sharing households can have lower vehicle ownership than comparable households, supporting continued adoption of shared mobility models.
 To learn more about this report, Download Free Sample Report
 The increasing smartphone penetration, digital payments, connected vehicles, and mobile applications are significantly supporting the expansion of the market. Digital platforms allow consumers to locate vehicles, make reservations, authenticate themselves, unlock vehicles, complete payments, and manage trips through a single interface. This reduces booking friction and makes one-way, round-trip, and peer-to-peer car sharing more accessible to consumers. Integration with Mobility-as-a-Service platforms can further connect car sharing with public transportation and other mobility options. The International Transport Forum highlights ease of use, including payment and software interfaces, as an important factor influencing shared-mobility uptake.
Furthermore, the growing environmental concerns and efforts to reduce transportation-related emissions are encouraging governments, mobility providers, and consumers to adopt shared and electric mobility solutions. Car-sharing fleets can improve vehicle utilization while potentially reducing dependence on privately owned vehicles and the urban space required for parking. Operators are also increasingly able to incorporate BEVs and PHEVs into shared fleets, supporting the transition toward lower-emission transportation. The International Transport Forum notes that car-sharing systems using low- and zero-emission vehicles have broader public exposure. Supportive policies, the development of charging infrastructure, and corporate sustainability initiatives are expected to further strengthen this driver.
Market Dynamics
The increasing focus on fleet utilization and cost optimization is driving organizations and mobility operators toward car-sharing models that enable vehicles to be used more efficiently and reduce idle time. By pooling vehicles and allowing multiple users to access the same fleet, car-sharing providers can generate greater revenue from individual vehicles while spreading ownership and operating costs across a larger user base. The integration of telematics, GPS tracking, and fleet-management analytics further enables operators to monitor vehicle utilization, optimize vehicle allocation, and identify periods of excess capacity. For corporate users, shared fleets can reduce expenses related to vehicle procurement, maintenance, insurance, parking, and depreciation by replacing underutilized dedicated vehicles with on-demand access. Consequently, the ability to improve vehicle productivity while reducing total fleet management costs is expected to encourage wider adoption of car-sharing services across both corporate and individual applications.
Car-sharing operators incur significant expenses from vehicle acquisition, depreciation, insurance, maintenance, cleaning, parking, fuel or charging, and fleet management, which can put continuous pressure on operating margins. As vehicles are used more intensively by multiple customers, wear and tear, servicing requirements, accident-related repairs, and cleaning frequency can increase, raising the overall cost of maintaining fleet availability. These expenses become particularly challenging when vehicles experience low or uneven utilization, as fixed costs continue to accumulate even when vehicles generate limited revenue. Operators, therefore, need sufficiently high utilization and efficient fleet management to spread vehicle and operating costs across a larger number of trips. Consequently, rising maintenance, insurance, depreciation, and operational expenses can restrict fleet expansion, increase service prices, and make it more difficult for car-sharing providers to achieve sustainable profitability.
Integration of car-sharing services with mobility-as-a-service (MaaS) platforms presents a significant opportunity to create seamless, multimodal transportation solutions. MaaS platforms can combine car sharing with public transportation, ride-hailing, bike sharing, parking, and other mobility services through a single digital interface. This enables users to plan, book, and pay for different modes of transportation on a single platform, improving convenience and accessibility. As cities increasingly invest in smart transportation infrastructure, car-sharing operators can integrate their fleets into MaaS ecosystems to expand their customer reach and vehicle utilization. This integration can also enable personalized mobility packages, subscription-based services, and real-time route optimization, creating additional revenue opportunities for operators.
Market Concentration & Characteristics
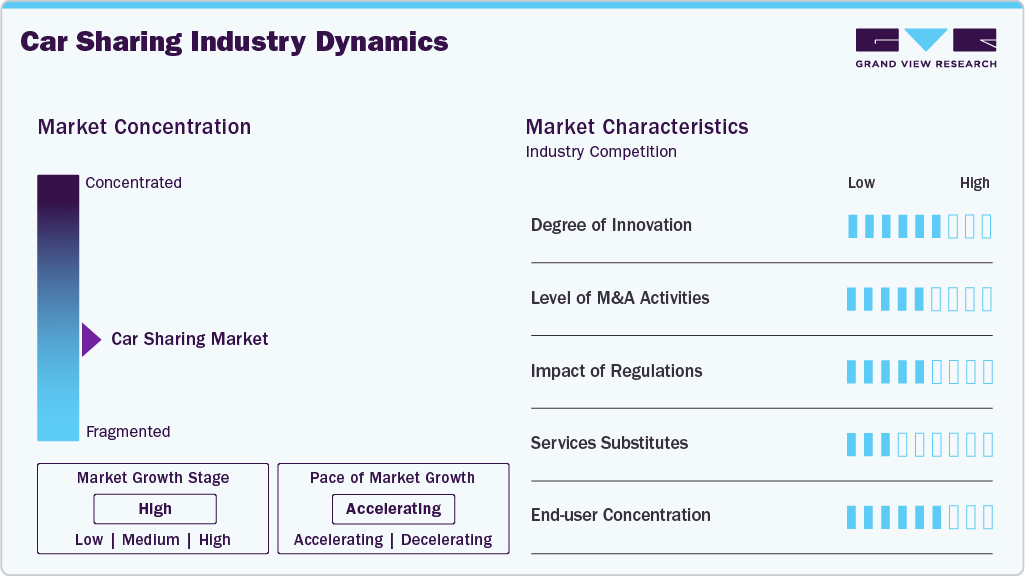
The market demonstrates a high degree of innovation, particularly through mobile-based booking, digital vehicle access, telematics, connected-car technologies, dynamic pricing, and AI-enabled fleet management. Operators are increasingly using technology to improve vehicle utilization, optimize fleet distribution, enhance customer experience, and reduce operational costs. The adoption of digital keys and real-time vehicle tracking is becoming an important competitive differentiator. Furthermore, EV integration and emerging vehicle-to-grid applications are creating additional avenues for technological innovation.
 To learn more about this report, Download Free Sample Report
 The threat from service substitutes is moderate, as consumers can choose among private vehicle ownership, traditional car rentals, ride-hailing taxis, public transportation, bike- and scooter-sharing, and other shared-mobility options. The attractiveness of these alternatives varies depending on trip distance, pricing, convenience, vehicle availability, and the quality of public transportation in a particular location. Public transit can be particularly competitive for frequent urban trips, while ride-hailing and traditional rentals can substitute for different car-sharing use cases. Therefore, operators need competitive pricing, convenient access, and differentiated digital experiences to retain customers.
Analyst Perspective
The market sits at the intersection of rising mobility costs, increasing urban transportation constraints, and the shift from vehicle ownership toward on-demand access. The competitive opportunity is expanding beyond conventional station-based services as P2P, free-floating, corporate sharing, and digitally managed fleets broaden the addressable user base. The central competitive moat, however, rests with operators that can combine high vehicle availability, dense network coverage, efficient fleet utilization, seamless app-based booking, and competitive pricing while maintaining viable unit economics. As operators integrate EVs, telematics, dynamic pricing, and multimodal mobility services, the market is shifting toward technology-enabled platforms where fleet productivity and recurring usage determine long-term revenue potential.
Booking Mode Insights
The offline segment led the market in 2025, accounting for 69.5% of global revenue. The segment is supported by customers who prefer direct interaction, particularly in markets where digital adoption and app-based mobility services remain comparatively limited. Physical rental counters, dedicated service centers, telephone reservations, and on-site vehicle access remain relevant for tourists, occasional users, and customers requiring assistance with vehicle selection or documentation. Offline channels also support users with limited access to digital payment methods or mobile applications. Their continued presence is particularly relevant across traditional car-rental networks and locations with established physical mobility infrastructure.
The online segment is anticipated to be the fastest-growing segment during the forecast period, driven by the increasing use of mobile applications and web-based platforms for vehicle discovery, reservation, payment, and trip management. Digital booking provides real-time visibility of vehicle availability, pricing, location, and rental duration, reducing the time required to access shared vehicles. Integration of digital wallets, automated identity verification, and connected-vehicle access further simplifies the booking process. Growing smartphone penetration and preference for contactless mobility services continue to support online bookings across urban markets.
Fuel Insights
The gasoline/diesel (ICE) segment led the market in 2025, accounting for 52.8% of global revenue, driven by the large installed base of conventional vehicles in major car-sharing markets. Lower upfront fleet costs and the established availability of refueling infrastructure enable operators to maintain broad vehicle coverage. ICE vehicles also support longer-distance and intercity trips where charging infrastructure remains limited. Continued demand from users requiring familiar vehicle options sustains the segment, particularly in markets with slower EV penetration.
The electric (BEV/PHEV) segment is projected to be the fastest-growing segment during the forecast period, driven by stricter vehicle-emission standards, government incentives, and the expansion of charging infrastructure. Car-sharing operators are adding electric vehicles to meet sustainability targets and reduce fleet emissions and operating costs. Growing consumer familiarity with EVs and improvements in battery range are also supporting adoption. Integration of charging networks with digital fleet-management platforms further improves the operational efficiency of electric car-sharing fleets.
Vehicle Insights
The hatchback segment led the market in 2025, accounting for 37.7% of global revenue. Hatchbacks are well-suited to car-sharing services because their compact dimensions enable easy maneuverability in congested urban areas and simplify parking in space-constrained locations. Their comparatively lower acquisition, maintenance, and operating costs enable operators to maintain economical pricing for frequent short-duration bookings. Fuel-efficient hatchbacks also support high vehicle utilization across daily commuting and short-distance trips. Their cabin and cargo capacity provide sufficient practicality for individual users and small groups. These factors support strong demand for hatchbacks in urban-focused car-sharing fleets.
The SUV segment is projected to be the fastest-growing segment during the forecast period, as users increasingly seek greater passenger capacity, luggage space, ground clearance, and driving comfort. They are particularly suited to family trips, group travel, airport transfers, weekend travel, and longer-distance journeys where vehicle space is a key consideration. The broader range of use cases enables SUVs to serve both individual and leisure-oriented bookings. Rising consumer preference for larger vehicles is also driving their adoption in shared mobility fleets. Consequently, SUVs are becoming an important revenue-generating vehicle category within car-sharing services.
Application Insights
The corporate segment led the market with the largest revenue share of 50.8% in 2025, as organizations seek to optimize fleet utilization and control employee mobility expenses. Shared vehicles allow multiple employees to access a common fleet for business travel, rather than maintaining dedicated vehicles for individual users. This model supports centralized booking, vehicle scheduling, usage tracking, and expense management through digital platforms. It also provides companies with greater flexibility in managing fluctuating business-trip requirements and reduces the underutilization of corporate vehicles.
The individual segment is projected to experience significant growth during the forecast period, supported by demand for flexible, on-demand access to vehicles without the financial commitments associated with ownership. Car sharing is particularly relevant in urban areas where parking constraints, congestion, and high vehicle ownership costs influence mobility choices. Digital platforms simplify vehicle discovery, reservation, access, and payment, improving convenience for short-duration and occasional trips. The availability of different vehicle categories and pricing models further supports usage across commuting, leisure, and personal travel requirements.
Type Insights
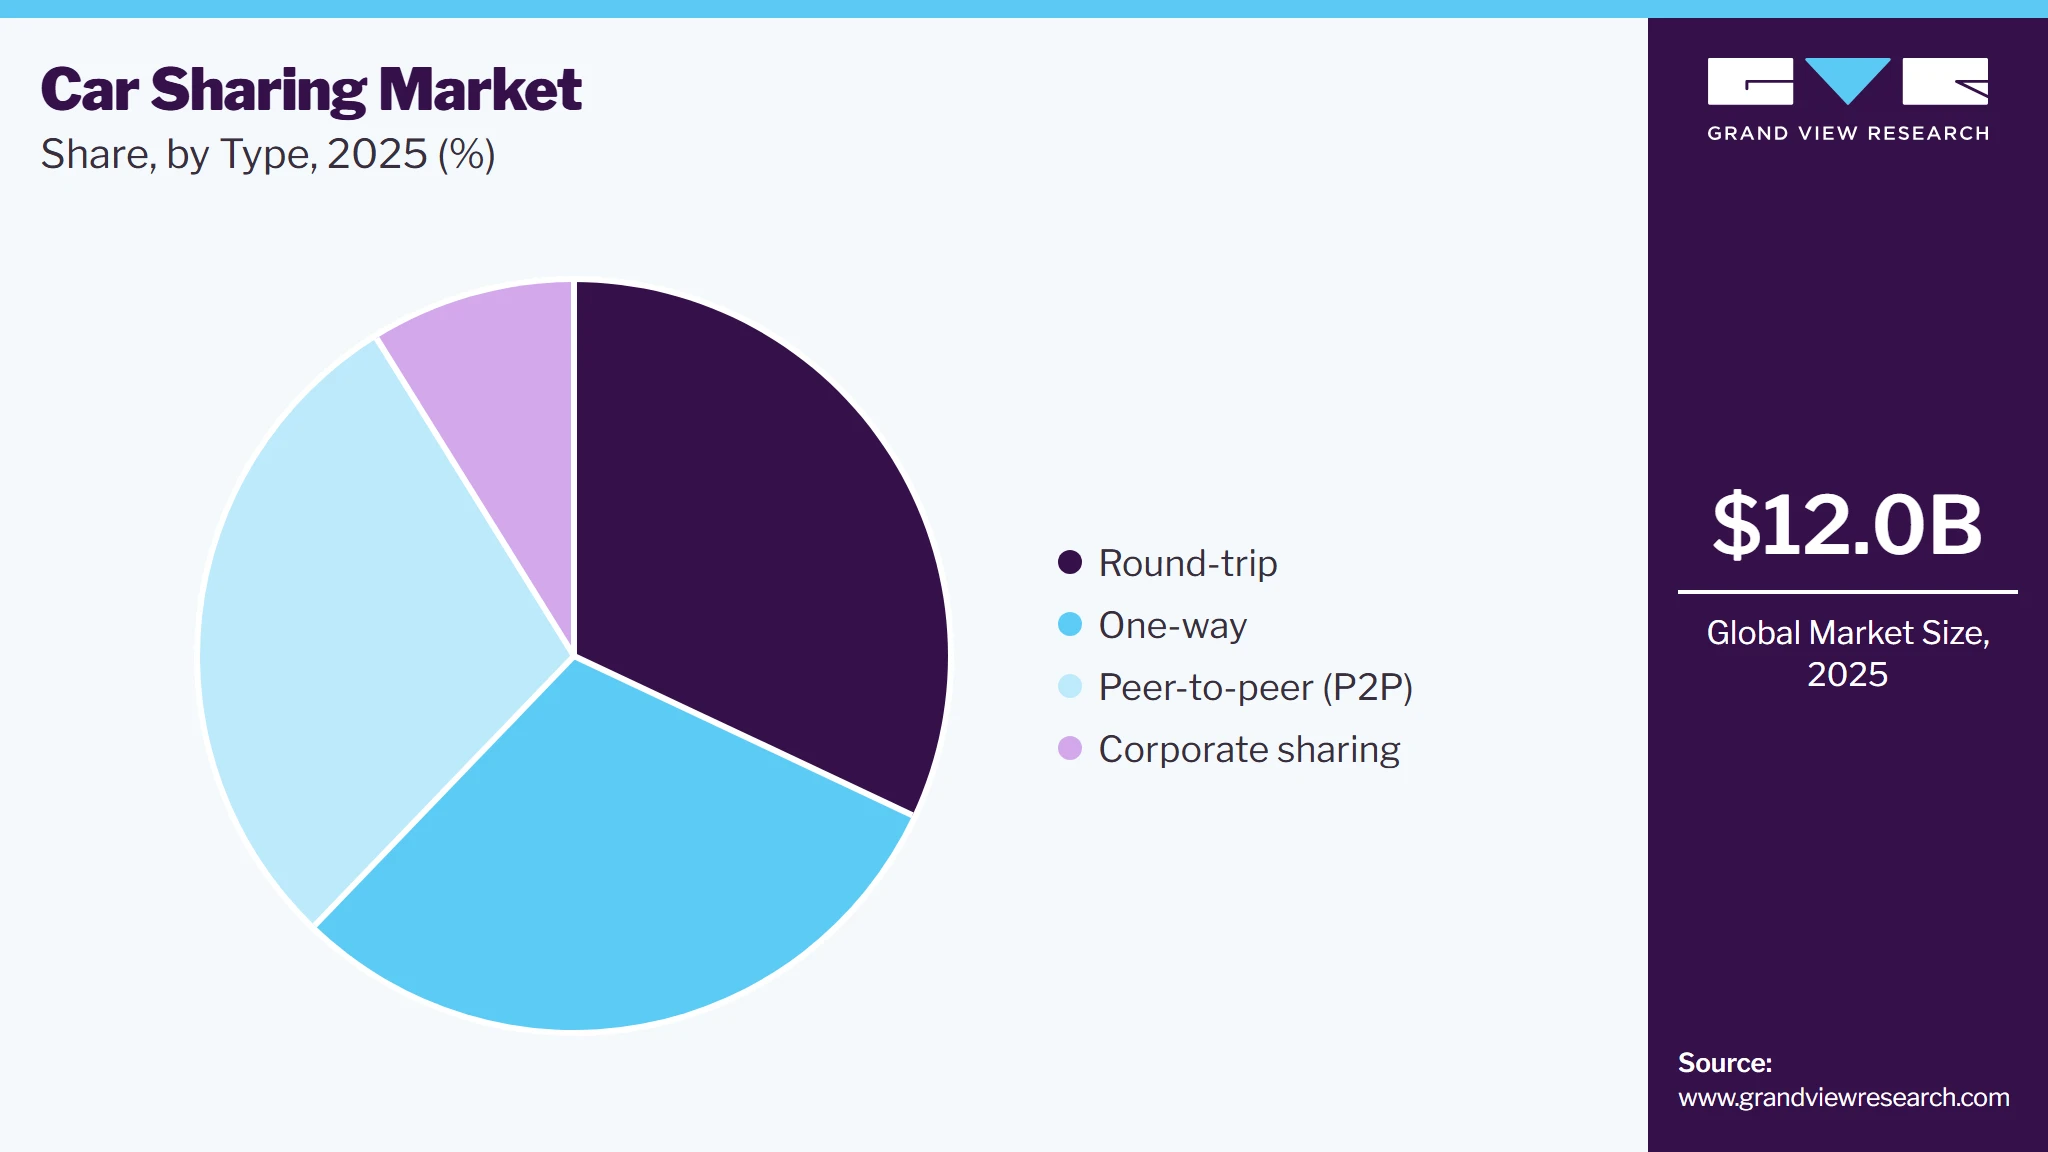
The round-trip segment led the market with the largest revenue share of 32.0% in 2025. Round-trip car sharing remains a significant model for users who require vehicles for planned, time-defined journeys. The model allows customers to reserve a vehicle for a specific duration and return it to the designated station or location, providing predictable access and pricing. It is particularly relevant for errands, business trips, leisure activities, and longer-duration urban journeys. Fixed pickup and return locations also simplify fleet scheduling, maintenance, and vehicle redistribution for operators. The structured operating model supports consistent utilization in residential communities, corporate campuses, universities, and transport hubs.
 To learn more about this report, Download Free Sample Report
 The one-way segment is anticipated to exhibit the fastest CAGR over the forecast period. One-way car sharing is driven by increasing demand for flexible, point-to-point transportation that allows users to pick up a vehicle at one location and return it at another without following a fixed route. Rapid urbanization, traffic congestion, and limited parking availability are encouraging commuters to seek alternatives to private vehicle ownership for short urban trips. The expansion of app-based booking and digital payment systems is making vehicle locating, reservation, and access more convenient, supporting frequent one-way usage.
Regional Insights
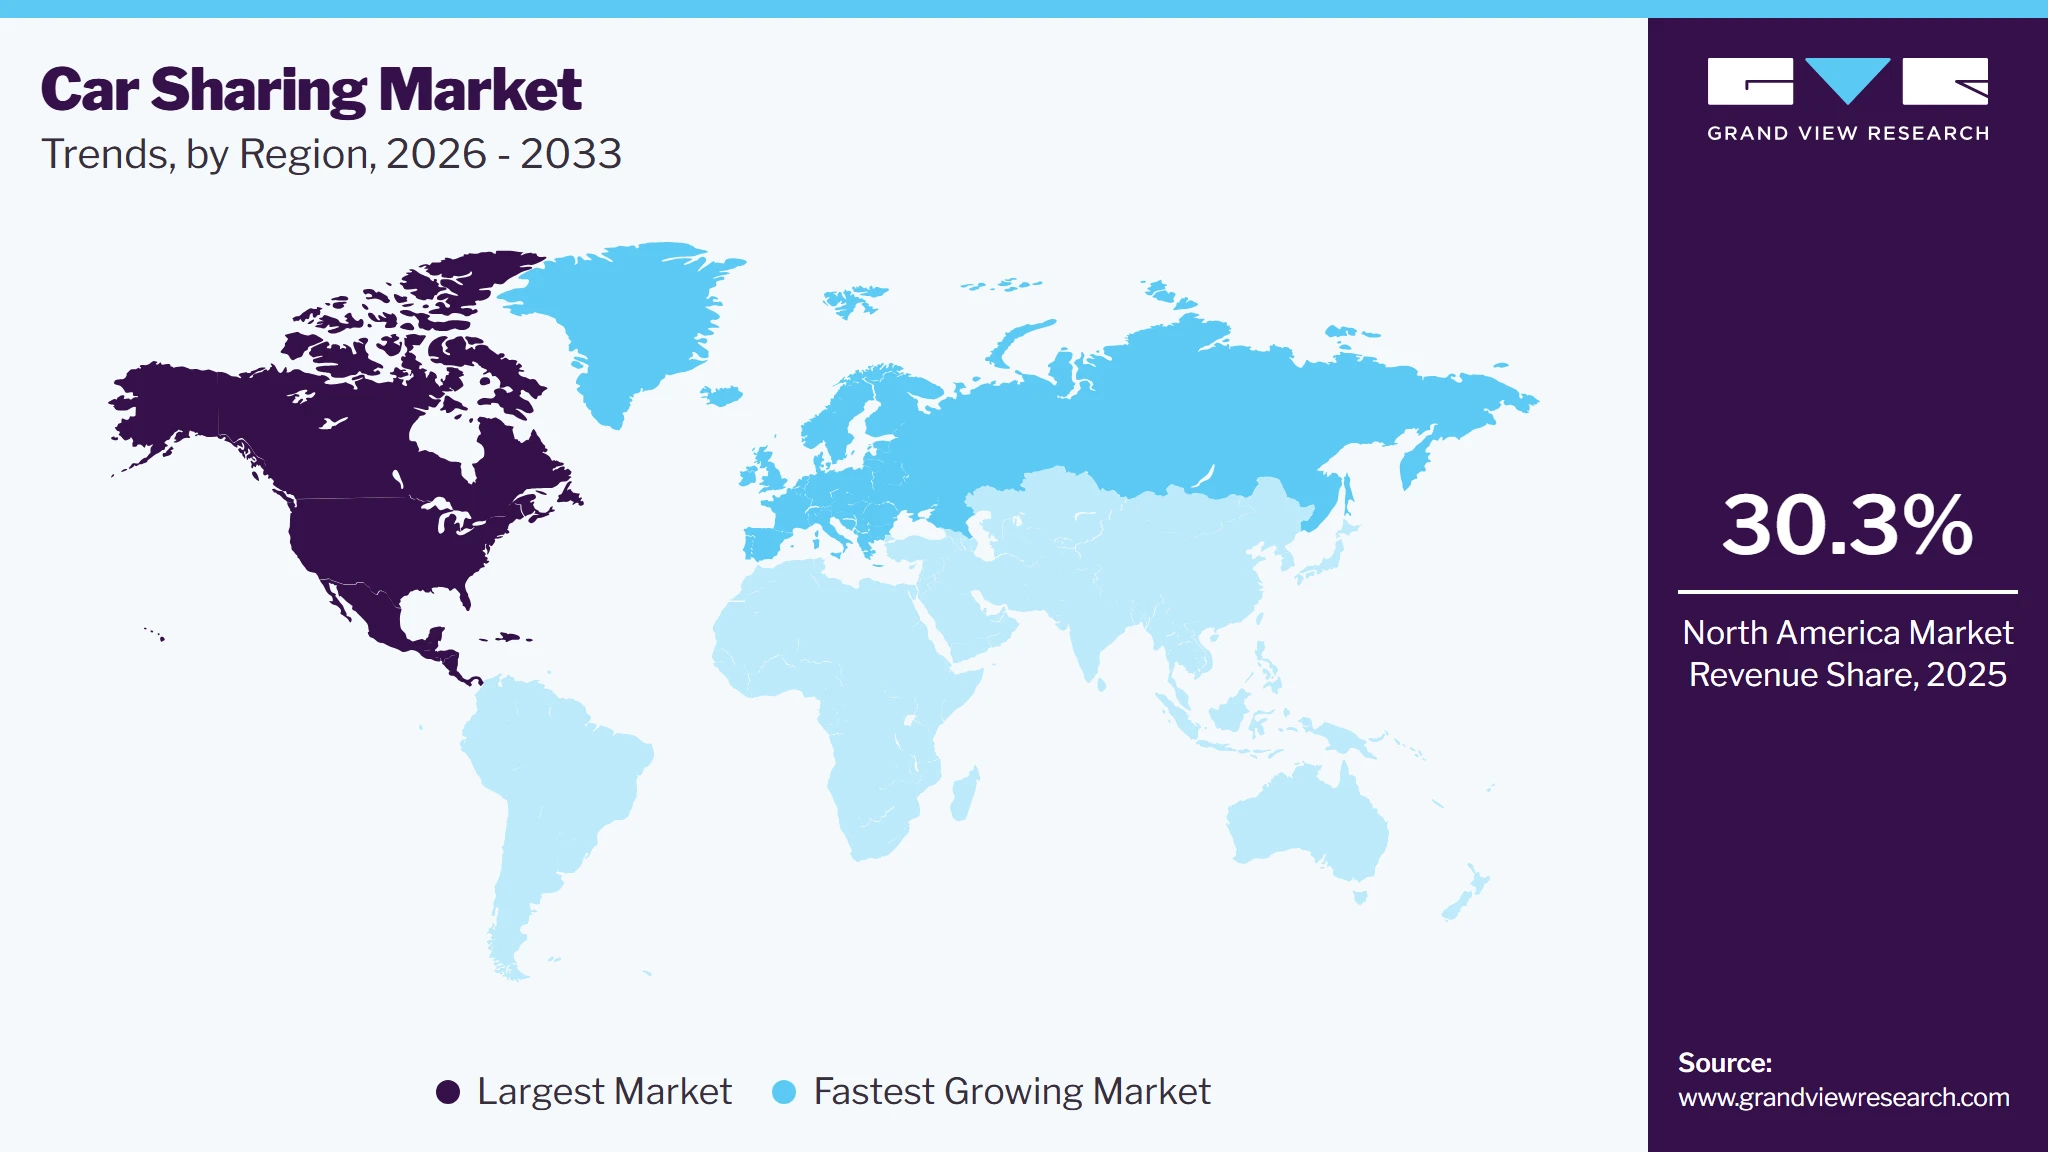
The car sharing industry in North America dominated the global market with the largest revenue share of 30.3% in 2025. High private vehicle ownership and rising costs associated with vehicle ownership are encouraging consumers to consider shared access for occasional and urban travel. Increasing congestion and parking constraints in major metropolitan areas are creating demand for flexible alternatives to personally owned vehicles. The expansion of peer-to-peer platforms is broadening access to shared vehicles by connecting privately owned cars with users through digital marketplaces. Corporate mobility programs and shared fleets are also supporting utilization during business and commuter travel.
 To learn more about this report, Download Free Sample Report
 U.S. Car Sharing Market Trends
The car sharing industry in the U.S. is driven strongly by high dependence on automobiles combined with increasing urban congestion creating demand for alternatives to private vehicle ownership in major metropolitan areas. Rising parking costs and limited availability in dense cities are improving the value proposition of short-duration vehicle access. Peer-to-peer car sharing is expanding the supply of vehicles beyond conventional operator-owned fleets, allowing privately owned vehicles to serve additional mobility demand. Corporate and university mobility programs are also creating recurring demand for shared vehicles among employees and students. Increasing deployment of connected-vehicle technologies and data-driven transportation planning is supporting more efficient management of shared fleets and mobility services.
Europe Car Sharing Market Trends
The car sharing industry in Europe is projected to register the fastest CAGR over the forecast period. The European market is driven by the integration of car sharing with public transportation that is acting as a major driver of demand, as European cities increasingly develop multimodal mobility systems. More of the EU population lives in urban areas, creating substantial demand for efficient solutions to congestion, accessibility, and urban emissions. Low- and zero-emission zones and other urban vehicle-access restrictions are encouraging users to consider shared and lower-emission mobility options. The expansion of sustainable urban mobility plans across European cities is also supporting the integration of shared vehicles into wider transport networks. Digital mobility platforms that connect car sharing with public transport further improve the convenience of multimodal journeys.
Asia Pacific Car Sharing Market Trends
The car sharing industry in Asia Pacific is fueled by the rapid expansion of metropolitan populations and increasing demand for flexible transportation across densely populated urban centers. High traffic congestion and limited road capacity are encouraging users to consider shared vehicles for short-distance and occasional journeys. Rising smartphone penetration and digital payment adoption are simplifying vehicle discovery, booking, and access through mobile platforms. The growing integration of shared mobility with public transit is also supporting first- and last-mile connectivity in major cities. Increasing adoption of electric vehicles and related charging infrastructure is creating additional scope for electrified car-sharing fleets across developed and emerging APAC markets.
Key Car Sharing Company Insights
Some of the key players in the market include cambio Mobilitatsservice GmbH & Co. KG, Zoomcar Holdings, Inc., BlaBlaCar, Mobility Genossenschaft, and others.
-
Zoomcar operates a technology-enabled car-sharing marketplace that connects vehicle owners with users seeking self-drive vehicles. Its platform supports daily bookings and longer-duration subscriptions, providing users with flexible vehicle access without a driver. Zoomcar's services include vehicle discovery, online booking, digital access, payment facilitation, vehicle delivery, and on-road assistance. The company also provides a host platform through which vehicle owners can list their cars and generate rental income. Its technology infrastructure incorporates host and guest verification, vehicle usage and location tracking, and support services.
-
BlaBlaCar operates a digital carpooling platform that connects drivers with passengers traveling along similar routes. The platform enables drivers to publish trips, specify departure and arrival points, set available seats, and share travel costs with passengers. Users can search and book rides through the website or mobile application, with options for instant booking or driver approval depending on the trip. BlaBlaCar incorporates verified profiles, reviews, and identity checks to support trust between drivers and passengers. Its services include conventional carpooling as well as door-to-door options through its Zen service.
Key Car Sharing Companies:
The following key companies have been profiled for this study on the car sharing market.
-
cambio Mobilitatsservice GmbH & Co. KG
-
Communauto Inc.
-
Free2move SE
-
Getaround, Inc.
-
BlaBlaCar
-
Mobility Genossenschaft
-
Sixt SE
-
Turo Inc.
-
Zipcar, Inc.
-
Zoomcar Holdings, Inc.
Competitive Benchmarking
Category
Operating Strategies
Competitive Edge
Weakness
Established Players (Mobility Genossenschaft; Turo Inc.; Sixt SE; Zipcar, Inc.; Communauto Inc.)
- Mature operators generally combine fleet-based, station-based, free-floating, P2P, and corporate models to serve multiple usage occasions and customer groups.
- Expansion strategies focus on network density, fleet optimization, digital booking, strategic partnerships, geographic coverage, and integration with broader mobility services.
- Established players benefit from larger vehicle networks, established customer bases, operational expertise, parking relationships, and stronger brand recognition.
- Integrated digital platforms, telematics, keyless access, fleet-management capabilities, and diversified mobility offerings provide additional competitive differentiation.
- Larger operating networks create higher fleet, maintenance, insurance, parking, and vehicle redistribution costs, particularly in low-utilization markets.
- Mature operators also face complexity in scaling across cities with different regulations, parking conditions, consumer preferences, and operating economics.
Emerging Players (Zoomcar Holdings, Inc.; BlaBlaCar)
- Emerging companies primarily use asset-light digital platforms, P2P models, self-drive services, and app-based booking to expand vehicle access without relying entirely on company-owned fleets.
- Their strategies emphasize rapid market entry, localized expansion, flexible pricing, digital customer acquisition, and technology-enabled vehicle management.
- These players benefit from lower physical infrastructure requirements and technology-led operating models, enabling flexible adaptation to changing customer requirements.
- P2P and marketplace structures can provide broader vehicle variety and supply flexibility while allowing owners to monetize underutilized vehicles.
- Emerging operators generally have smaller fleet networks, lower geographic coverage, and less established customer relationships than mature competitors.
- Dependence on host participation, fleet availability, regulatory approvals, and customer trust can create supply consistency and service-quality challenges during expansion.
Recent Developments
-
In August 2026, Zoomcar and Uber announced a partnership that brings Uber Intercity chauffeur-driven rides to the Zoomcar app. The partnership allows travelers to compare and book both self-drive and chauffeur-driven options for one-way and round-trip journeys. The service gives users more flexibility when planning road trips. The companies also plan to expand the integrated service to additional cities.
-
In June 2026, BlaBlaCar announced an expansion into 20 new countries across Latin America, Europe, Southeast Asia, and North Africa, increasing its geographic presence to 41 countries. The expansion responds to rising living costs, higher fuel prices, climate concerns, and growing demand for cost-sharing mobility solutions. The company is using artificial intelligence to support market localization and operational scaling across the new markets.
-
In December 2023, Zipcar introduced an electric vehicle (EV) initiative across several U.S. cities, including Boston, Chicago, New York City, San Francisco, and Los Angeles. The initiative involved working with cities, universities, and commercial and residential partners to expand access to shared EVs. Zipcar also applied fleet management technology to coordinate EV charging while keeping vehicles available to members.
Car Sharing Market Report Scope
Report Attribute
Details
Market size in 2025
USD 12.0 billion
Estimated market size in 2026
USD 14.2 billion
Projected market size by 2033
USD 46.5 billion
Growth rate
CAGR of 18.5% from 2026 to 2033
Base Year
2025
Actual data
2021 - 2025
Forecast period
2026 - 2033
Quantitative units
Revenue in USD billion and CAGR from 2026 to 2033
Report coverage
Revenue forecast, company ranking, competitive landscape, growth factors, and trends
Segments covered
Booking mode, fuel, vehicle, application, type, and region
Regional scope
North America; Europe; Asia Pacific; Latin America; MEA
Country scope
U.S.; Canada; Mexico; UK; Germany; France; China; India; Japan; South Korea; Australia; Brazil; Saudi Arabia; South Africa; UAE
Key companies profiled
cambio Mobilitatsservice GmbH & Co. KG; Communauto Inc.; Free2move SE; Getaround, Inc.; BlaBlaCar; Mobility Genossenschaft; Sixt SE; Turo Inc.; Zipcar, Inc.; Zoomcar Holdings, Inc.
Customization scope
Free report customization (equivalent up to 8 analysts working days) with purchase. Addition or alteration to country, regional & segment scope.
Pricing and purchase options
Avail customized purchase options to meet your exact research needs. Explore purchase options
Global Car Sharing Market Report Segmentation
This report forecasts revenue growth at global, regional, and country levels and provides an analysis of the latest industry trends in each of the sub-segments from 2021 to 2033. For this study, Grand View Research has segmented the global car sharing market report based on booking mode, fuel, vehicle, application, type, and region.
-
Booking Mode Outlook (Revenue, USD Billion, 2021 - 2033)
-
Online
-
Offline
-
-
Fuel Outlook (Revenue, USD Billion, 2021 - 2033)
-
Gasoline/diesel (ICE)
-
Electric (BEV/PHEV)
-
Hybrid
-
-
Vehicle Outlook (Revenue, USD Billion, 2021 - 2033)
-
Hatchback
-
Sedan
-
SUV
-
Others
-
-
Application Outlook (Revenue, USD Billion, 2021 - 2033)
-
Corporate
-
Individual
-
-
Type Outlook (Revenue, USD Billion, 2021 - 2033)
-
Round-trip
-
One-way
-
Peer-to-peer (P2P)
-
Corporate sharing
-
-
Regional Outlook (Revenue, USD Billion, 2021 - 2033)
-
North America
-
U.S.
-
Canada
-
Mexico
-
-
Europe
-
UK
-
Germany
-
France
-
-
Asia Pacific
-
China
-
India
-
Japan
-
Australia
-
South Korea
-
-
Latin America
-
Brazil
-
-
MEA
-
UAE
-
South Africa
-
KSA
-
-
Research Methodology
The car sharing market figures in this report are based on a proven research process that combines executive interviews with secondary research from proprietary databases, company filings, and recognized regulatory and institutional sources. Market size is built through value-chain sizing-reconciling supply-side and demand-side estimates-and triangulated with bottom-up and top-down approaches. Every estimate passes multiple levels of expert validation before publication, with each car sharing segment quantified using the revenue-capture definitions in the table below.
Segment Definition
Segment - Booking Mode
Revenue capture definition
Online
Revenue generated through digital booking channels, including mobile applications and websites, where users select vehicles, confirm reservations, and complete payments electronically. This segment captures booking-related transaction revenue processed through online platforms.
Offline
Revenue generated through physical or non-digital booking channels, such as service counters, telephone reservations, or operator-assisted bookings. It covers transactions completed without direct use of an online booking platform.
Segment - Fuel
Revenue capture definition
Gasoline/diesel (ICE)
Revenue generated from car-sharing trips using vehicles powered by conventional gasoline or diesel internal-combustion engines, including booking, usage, and associated service fees.
Electric (BEV/PHEV)
Revenue derived from shared battery-electric and plug-in hybrid vehicles, covering trip charges, booking fees, and other user payments associated with electric vehicle usage.
Hybrid
Revenue earned through car-sharing services using non-plug-in hybrid vehicles, encompassing vehicle-use charges, reservation fees, and related service income.
Segment - Vehicle
Revenue capture definition
Hatchback
Revenue generated from shared hatchbacks through short-duration bookings, daily rentals, and urban mobility trips. Their lower operating and rental costs support frequent use for commuting, errands, and short-distance travel.
Sedan
Revenue capture comes from bookings for sedans used in business travel, personal trips, and longer urban journeys. Higher comfort and passenger capacity support comparatively higher pricing for extended or premium bookings.
SUV
SUV revenue is generated through rentals for group travel, leisure trips, and journeys requiring greater passenger or luggage capacity. Higher rental rates and longer booking durations contribute to revenue generation within this segment.
Others
This segment captures revenue from vehicle categories such as MPVs, luxury cars, and specialty vehicles offered through car-sharing platforms. Revenue is primarily derived from use cases requiring specific seating capacity, vehicle features, or travel requirements.
Segment - Application
Revenue capture definition
Corporate
Revenue generated from car-sharing services used by businesses for employee mobility, client visits, field operations, and corporate travel. It includes fees from corporate accounts, vehicle usage, subscriptions, and business-specific mobility programs.
Individual
Revenue earned from private users booking shared vehicles for personal transportation, errands, leisure, and short-distance travel. It primarily comprises booking fees, usage charges, memberships, subscriptions, and other consumer payments.
Segment - Type
Revenue capture definition
Round-trip
Revenue is generated through time-based vehicle reservations, with users paying for the vehicle for the duration of a trip and returning it to the designated location. Pricing commonly includes hourly or daily usage fees, along with applicable mileage and service charges.
Corporate sharing
Revenue comes from contracts or usage-based arrangements with businesses that provide shared vehicles for employees or operational requirements. Monetization typically includes subscription fees, fleet-access charges, usage-based billing, and corporate account services.
One-way
Operators capture revenue by charging users for point-to-point vehicle usage, where the vehicle can be returned to a different approved location. Earnings primarily come from trip duration, distance-based charges, and applicable booking or service fees.
Peer-to-peer (P2P)
Revenue is captured through transaction commissions or service fees charged on bookings between private vehicle owners and users. Platforms may also generate income from insurance, protection plans, payment processing, and other ancillary services.
Estimation Model
Layer Name
Key Questions
Description
Supply Layer
What vehicle supply is available for sharing?
Identify the addressable shared-vehicle fleet across operators, P2P platforms, corporate programs, and relevant vehicle categories. This establishes the vehicle base available to serve car-sharing demand.
Utilization Layer
How much is the available fleet used?
Apply fleet utilization and active-use rates to estimate the proportion of available vehicles generating service activity. Utilization reflects the share of fleet capacity occupied by customer bookings.
Transaction Layer
How many revenue-generating bookings occur?
Apply booking frequency, average trip duration, and active-user conversion assumptions to estimate annual revenue-generating transactions across round-trip, one-way, P2P, and corporate services.
Monetization Layer
How much revenue is generated?
Apply average revenue per booking, hour, or trip to the estimated transaction volume and aggregate usage fees, mileage charges, booking fees, subscriptions, and applicable service charges to derive total market revenue.
Delivered Customizations
This report has been delivered with the following In-depth customizations
CLIENT REQUEST
CUSTOMIZATION DELIVERED
VALUE ADDS
Market Entry & Expansion Assessment
Regional demand sizing and forecasting
Customer segmentation and buying behavior analysis
Competitive landscape benchmarking
Regulatory and distribution channel assessment
Identified high-growth market opportunities
Supported go-to-market strategy development
Highlighted investment priorities and risks
Enabled data-driven expansion planning
Channel Partner & Distribution Study
Dealer/distributor network analysis
Channel performance benchmarking
Margin and profitability assessment
Route-to-market evaluation
Optimized channel strategy
Identified distribution gaps
Improved partner engagement approach
Enhanced market penetration planning
Customer & End-User Insights Study
Consumer awareness and adoption analysis
Purchase decision journey mapping
Satisfaction and loyalty assessment
Usage pattern and pain-point evaluation
Revealed key adoption drivers and barriers
Supported customer-centric product development
Improved targeting and engagement strategy
Identified opportunities for retention and upselling
About the Author(s)
Automotive & Transportation Research Team
Technology · Automotive & TransportationThis report was authored by the automotive & transportation research team at Grand View Research - comprising two research analysts, one senior research analyst, and one industry expert - with specialized expertise in the automotive & transportation segment of the technology industry. All findings are based on proprietary technology databases, executive interviews, and regulatory analysis, subject to internal peer review prior to publication.
Last Updated:
Speak to Analyst

Customize this report to your needs - add regions, segments, or data points, with 20% free customization.
Or view our licence options:


ISO 9001:2015 & 27001:2022 Certified
We are GDPR and CCPA compliant! Your transaction & personal information is safe and secure. For more details, please read our privacy policy.


