GVR Report cover U.S. Imaging Services Market Size, Share & Trends Report

U.S. Imaging Services Market Size, Share & Trends Analysis Report By Modality (X-ray, Mammography, Nuclear Medicine Scans, Ultrasound, MRI Scans), By End-use (Hospitals, Diagnostic Imaging Centers), And Segment Forecasts, 2023 - 2030

  • Report ID: GVR-4-68038-625-7
  • Number of Report Pages: 60
  • Format: PDF, Horizon Databook
  • Historical Range: 2018 - 2020
  • Forecast Period: 2023 - 2030 
  • Industry: Healthcare

U.S. Imaging Services Market Size & Trends

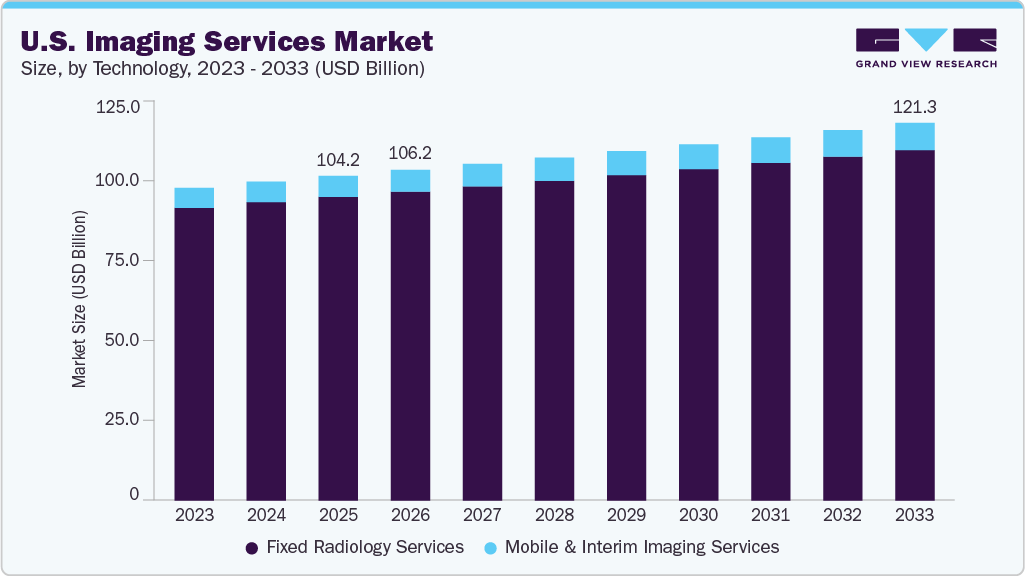
The U.S. imaging services market size was valued at USD 144.8 billion in 2023 and is expected to grow at a compound annual growth rate (CAGR) of 4.25% from 2024 to 2030. The major factors attributed to the growth include the increasing prevalence of cancer and cardiac disorders coupled with growing awareness about medical imaging technology. For instance, according to National Center for Health Statistics, in 2023, almost 1,958,310 new cancer cases and 609,820 cancer deaths are estimated to occur in the United States. In addition, the development of various technologies for enhancing medical imaging services is anticipated to boost market growth in the coming years.

U.S. Medical Imaging Services Market size and growth rate, 2023 - 2030

Medical imaging is the preferred diagnostic technique as it provides vital information with speed, safety, and accuracy. Imaging services involve different imaging modalities such as X-ray, ultrasound, nuclear medicines scans, MRI, and CT scans which are non-invasive techniques used for diagnosing various diseases easily. Additionally, these imaging services help in early diagnosis of the disease, which helps in positive treatment outcomes. The development of various technologies for enhancing medical imaging services is anticipated to boost the market growth in the coming years. Furthermore, the rapidly increasing aging population and high incidence of cancer are factors expected to drive market growth. Growing funding to support ongoing research activities and rising private-public initiatives related to medical imaging are factors likely to propel the overall market growth.

Contrast-enhanced ultrasound and lung CT scans have been extensively used in assessing COVID-19 patients during the first and second waves of the ongoing pandemic. These modalities were also used along with magnetic resonance imaging during clinical trials of COVID-19 vaccines. However, the overall procedural volume declined due to cancellation and delaying of planned hospital visits. The unavailability of skilled radiologists for non-COVID operations was one of the major factors causing the sudden market decline. Restrictions to visit hospitals and imaging centers drastically reduced regular imaging procedures including scheduled mammography screenings. The market is expected to witness growth in 2021 with the adoption of ambulatory imaging centers and teleradiology services.

Medical imaging helps in the early and accurate diagnosis of diseases, which helps in providing effective disease treatment. Therefore, to control the growing disease burden, a large number of medical professionals are using medical imaging devices in imaging services before performing surgeries. The growing prevalence of cancer and cardiovascular diseases is expected to drive the need for medical imaging services. According to WHO, Cardiovascular diseases (CVDs) are the major cause of death globally, taking approximately 17.9 million lives each year. Additionally, as per the Centers for Disease Control & Prevention, in the United States, every year about 805,000 people have a heart attack and about 1 in 20 adults aged 20 and older have coronary artery disease (about 5%).

In interventional radiology, healthcare professionals use medical imaging systems to guide minimally invasive surgical procedures that treat, diagnose, and cure several conditions. Imaging modalities include CT, fluoroscopy, ultrasound, and MRI. Minimally invasive surgeries offer numerous benefits such as faster recovery time, smaller incisions, reduced scarring and pain, increased accuracy & shorter hospital stays compared to open surgery techniques, which is expected to fuel the imaging services market.

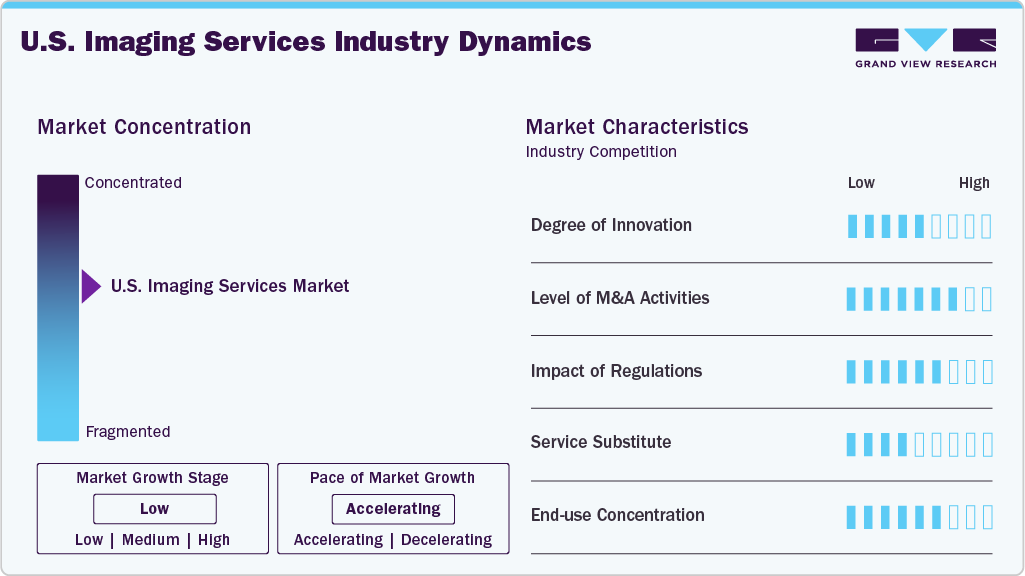
Market Concentration & Characteristics

The market growth stage is moderate, and pace of the market growth is accelerating. The U.S. imaging services market is characterized by a low to moderate degree of growth. Key driving factors include increasing prevalence of chronic disorders, rising awareness about medical imaging techniques, and growing number of outpatient settings with imaging services. However, high cost of medical imaging services, dearth of skilled radiologists operating medical imaging equipment may hamper the market in the forecast period.

The key players in the U.S. imaging services market are utilizing strategies such as new product launches, mergers & acquisitions, business expansion, partnerships & collaborations, and implementing other effective strategies to maintain their position in the market. For instance, In April 2023, Unilabs partnered with SmartSoft Healthcare for enhancing the lumbar spine MRI reading and reporting. This partnership demonstrated the expansion of AI in the field of diagnostic imaging services for improving the efficiency and accuracy,

U.S. Imaging Services Market Concentration & Characteristics

Degree of Innovation: The degree of innovation in the U.S. Imaging Services Market constantly evolves as new technologies and techniques are developed and adopted. The market has seen significant growth in recent years due to the increasing demand for diagnostic imaging services and the implementation of advanced imaging technologies such as MRI, CT, and PET-CT. Additionally, there has been a rise in the use of artificial intelligence and machine learning algorithms in medical imaging, which is expected further to enhance the degree of innovation in the industry.

Partnerships & Collaboration: The U.S. imaging services market is witnessing a high level of partnerships and collaboration. Companies are considering expanding their service offerings and reaching wide customers through this strategy. Companies can combine their strengths and expertise to provide better customer solutions and services. Additionally, partnerships and collaborations can help companies to reduce costs and increase efficiency, as they can share resources and knowledge. Due to the rising demand for imaging services, more partnerships and collaborations are expected. For instance, in November 2022, RadNet, Inc. acquired a majority stake of 75% in Heart & Lung Imaging Limited. This London-based company aims to enhance the outcomes of lung cancer patients through early detection and precise diagnosis.

Impact of Regulation: Stringent regulations control the U.S. imaging services market to ensure patient safety, privacy, proper handling, and disposal of medical equipment. Regulatory authorities such as the Food and Drug Administration (U.S. FDA) and the Centers for Medicare and Medicaid Services (CMS) play a significant role in the imaging services market. Laws such as the Affordable Care Act and the Medicare Access and CHIP Reauthorization Act (MACRA) also impact the industry by promoting value-based care and driving the adoption of new technologies. The U.S. imaging services market operates in a heavily regulated environment, with numerous laws and regulations impacting the industry at the federal and state levels.

Service Substitutes: The medical imaging services market poses a low threat from direct substitutes. However, services such as telemedicine and remote monitoring offer convenient and cost-effective options for patients who are not able to undergo traditional medical imaging procedures. The market is highly competitive, with companies competing on factors such as price, quality of services, and geographic coverage

Regional Expansion: In terms of geographical expansion, several imaging centers in the U.S. have been expanding to other states and regions to cater to a larger patient population. This expansion has helped improve access to imaging services and provide better patient care. Around 18,000 imaging centers are present in the U.S. as of January 2022. Additionally, the presence of well-established healthcare infrastructure, availability of insurance and reimbursement scenarios, and awareness of early disease diagnosis are some of the factors fueling the market growth.

Modality Insights

Based on modality, the market is segmented into X-rays, CT scans, nuclear medicine scans, MRI scans, ultrasound, and mammography. Nuclear medicine scans held the largest share of 24.29% in 2023. Rising awareness levels among physicians and clinical researchers regarding the benefits of nuclear imaging scans coupled with increasing application areas such as cases in oncology, and neurological diseases are the factors driving the market.

Moreover, the magnetic resonance imaging segment is expected to grow at the highest CAGR of 4.59% over the forecast period, owing to the factors such as the increasing geriatric population, technological advancements such as introduction of the hybrid MRI equipment, high-field MRI, superconducting (SC) magnets, and installation of software, availability of universal health coverage, and growing burden on chronic diseases are fueling the market’s growth.

End-use Insights

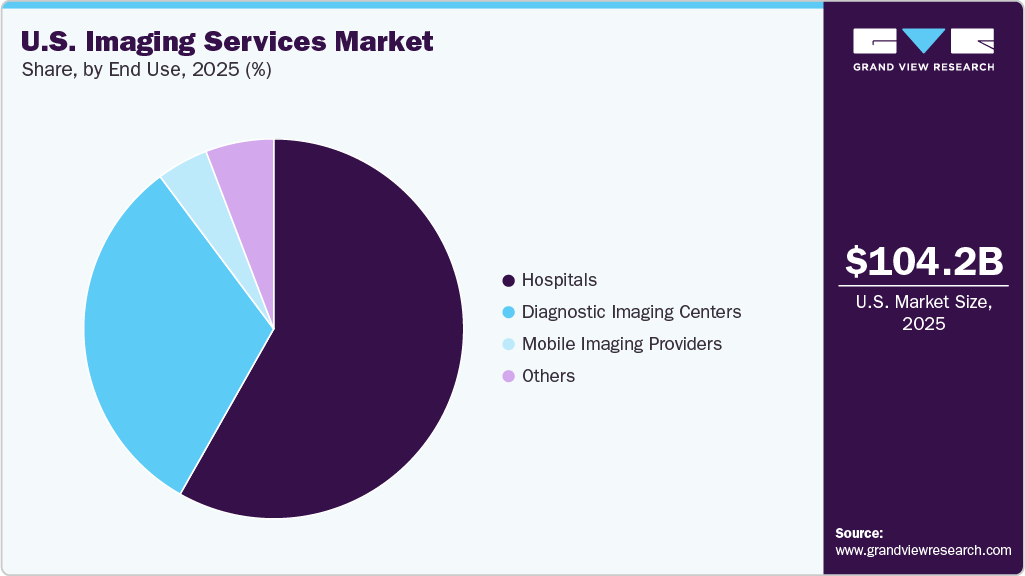
Based on end-use, the market is segmented into diagnostic imaging centers, hospitals, and others. Others include imaging centers for specific modalities such as MRI, CT scan, and other outpatient settings. Hospitals held the largest share of 38.67% in 2023, owing to the increasing prevalence of various conditions such as cancer and cardiac disorders. According to the National Cancer Institute, in 2023, roughly 2.0 million people will be diagnosed with cancer and an estimated 609,820 people are expected to die due to cancer in the United States. As per the Centers for Disease Control and Prevention (CDC), in 2020, about 382,820 million adults in the U.S. were died due to heart disease.

U.S. Imaging Services Market share and size, 2022

Furthermore, the availability of multiple imaging modalities in single facility and reimbursement policies for the imaging procedures are also expected to impact the overall market growth. Congress and the Centers for Medicare & Medicaid Services (CMS) have come up with policies affecting advanced diagnostic imaging services such as CT, MRI, PET/CT, and nuclear procedures. Medicare covers imaging services through different payment systems such as Hospital Outpatient Prospective Payment System (HOPPS), Physician Fee Schedule (PFS), and Inpatient Prospective Payment System.

Others segment is also expected to grow at a significant CAGR during the forecast period. The need for medical imaging services is increasing, hence, hospitals are opening healthcare centers in outpatient settings to meet this growing demand at low-cost. Hospitals have provided MRI services in an outpatient setting such as in strip malls and shopping centers. This is aimed to ease access to imaging services for patients. Additionally, the service cost in such outpatient settings is low, thus, expected to drive its growth during the forecast period.  

Key Companies & Market Share Insights

The U.S. imaging services market is highly competitive and has several key players. The major market players are focused on forming a partnership to enhance imaging services and patient care, taking advantage of important cooperation activities, and exploring mergers & acquisitions. For instance, in March 2023, Medtronic and NVIDIA stated that they have entered into a partnership to accelerate the expansion of AI in the healthcare system and convey new AI-based solutions into patient care. Also, apart from Medtronic, the company is aiming for more such AI or metaverse-driven partnerships to advance medical imaging & medical devices, as per NVIDIA's GTC 2023 conference.

Key U.S. Imaging Services Companies:

  • Radnet, Inc.
  • Alliance Medical
  • Inhealth Group
  • Sonic Healthcare
  • Dignity Health
  • Medica Group
  • Global Diagnostics
  • Novant Health
  • Concord Medical Services Holdings Limited
  • Center for Diagnostic Imaging, Inc.
  • Unilabs
  • Healius Limited
  • Simonmed Imaging

Recent Development

  • In February 2023, Radnet, Inc. introduced an enhanced breast cancer detection program in New Jersey and New York. This imaging service network will benefit patients with an enhanced screening mammography service for cancer detection

  • In November 2022, Radent, Inc. collaborated with Google Health for initiating improvements in lung cancer screening with CT imaging as an AI solution. This helped in developing and validating appropriate lung cancer diagnosis through imaging screening services

  • In May 2022, Alliance Medical collaborated with GE Healthcare for developing a digital solution to enhance hospital productivity within the radiology department. The Imaging Growth is a solution of GE Healthcare that tend to access real-time data of Alliance Medical for predicting and suggesting opportunities to optimize scheduling

  • In January 2022, a partnership was formed between Novant Health and Aidoc for incorporating an imaging AI platform to make advancement in treatments for patients, and overcome constraint in resources

  • In December 2021, Centre for Diagnostic Imaging, now known as Rayus Radiology, partnered with the US Speedskating, US Bobsled and Skeleton, and US Ski and Snowboard teams. The purpose is to provide medical imaging services to these teams for supporting the health and well-being of athletes

  • In June 2021, Medica Group Plc completed its virtual desktop infrastructure (VDI), and successfully met all the requirements essential for image viewing services. This helped reporters in carrying out interpretations of different medical imaging modalities

U.S. Imaging Services Market Report Scope


Report Attribute

Details

Revenue forecast in 2030

USD 192.9 billion

Growth Rate

CAGR of 4.25% from 2024 to 2030

Actual period

2018 - 2022

Forecast period

2024 - 2030

Quantitative units

Revenue in USD billion and CAGR from 2024 to 2030

Report coverage

Revenue forecast, company ranking, competitive landscape, growth factors, and trends

Segments covered

Modality, end-use

Regional scope

U.S.

Key companies profiled

Radnet, Inc.; Alliance Medical; Inhealth Group; Sonic Healthcare; Dignity Health; Medica Group; Global Diagnostics; Novant Health; Concord Medical Services Holdings Limited; Center for Diagnostic Imaging, Inc.; Unilabs; Healius Limited; Simonmed Imaging

Customization scope

Free report customization (equivalent up to 8 analysts working days) with purchase. Addition or alteration to country, regional & segment scope

Pricing and purchase options

Avail customized purchase options to meet your exact research needs. Explore purchase options


U.S. Imaging Services Market Report Segmentation

This report forecasts revenue growth at the country level and provides an analysis of the latest industry trends in each of the sub-segments from 2018 to 2030. For this study, Grand View Research has segmented the U.S. imaging services market report based on modality and end-use:

  • Modality Outlook (Revenue, USD Billion, 2018 - 2030)

    • X-rays

    • CT scans

    • Nuclear medicine scans

    • MRI scans

    • Ultrasound

    • Mammography

  • End-use Outlook (Revenue, USD Billion, 2018 - 2030)

    • Hospitals

    • Diagnostic imaging centers

    • Others

Frequently Asked Questions About This Report

Table of Contents

Chapter 1. U.S. Imaging Services Market: Methodology and Scope
                   1.1. Market Segmentation & Scope
                       1.1.1. Modality
                       1.1.2. End-Use
                   1.2. Research Methodology
                   1.3. Information Procurement
                       1.3.1. Purchased database
                       1.3.2. GVR’s internal database
                       1.3.3. Secondary sources
                       1.3.4. Primary research
                       1.3.5. Details of primary research
                   1.4. Information or Data Analysis
                       1.4.1. Data analysis models
                   1.5. Market Formulation & Validation
                   1.6. Model Details
                       1.6.1. Commodity flow analysis (Model 1)
                           1.6.1.1. Approach 1: Commodity flow approach
                       1.6.2. Volume price analysis (Model 2)
                           1.6.2.1. Approach 2: Volume price analysis
                   1.7. List of Secondary Sources
                   1.8. List of Primary Sources
                   1.9. Objectives
                       1.9.1. Objective 1
                       1.9.2. Objective 2
Chapter 2. U.S. Imaging Services Market: Executive Summary
                   2.1. Market Outlook
                   2.2. Segment Outlook
                       2.2.1. Modality outlook
                       2.2.2. End-use outlook
                   2.3. Competitive Insights
Chapter 3. U.S. Imaging Services Market: Variables, Trends & Scope
                   3.1. Market Lineage Outlook
                       3.1.1. Parent market outlook
                       3.1.2. Related/ancillary market outlook
                   3.2. Penetration & Growth Prospect Mapping
                   3.3. Industry Value Chain Analysis
                       3.3.1. Reimbursement framework
                   3.4. Market Dynamics
                       3.4.1. Market driver analysis
                           3.4.1.1. Increasing prevalence of cancer and cardiac disorders
                           3.4.1.2. Growing number of outpatient settings with imaging services
                           3.4.1.3. Growing awareness of medical imaging
                       3.4.2. Market restraint analysis
                           3.4.2.1. High cost of MRI services
                           3.4.2.2. Side effects of imaging modalities
                       3.4.3. Industry challenges
                   3.5. U.S. Imaging Services Market Analysis Tools
                       3.5.1. Industry Analysis - Porter’s
                           3.5.1.1. Supplier power
                           3.5.1.2. Buyer power
                           3.5.1.3. Substitution threat
                           3.5.1.4. Threat of new entrant
                           3.5.1.5. Competitive rivalry
                       3.5.2. PESTEL Analysis
                           3.5.2.1. Political landscape
                           3.5.2.2. Technological landscape
                           3.5.2.3. Economic landscape
                       3.5.3. Major Deals & Strategic Alliances Analysis
                       3.5.4. Market Entry Strategies
Chapter 4. Modality Estimates & Trend Analysis
                   4.1. Definitions and Scope
                       4.1.1. X-rays
                       4.1.2. CT scans
                       4.1.3. Nuclear medicine scans
                       4.1.4. MRI scans
                       4.1.5. Ultrasound
                       4.1.6. Mammography
                   4.2. Modality Market Share, 2021 & 2030
                   4.3. Segment Dashboard
                   4.4. U.S. Imaging Services Market by Modality Outlook
                   4.5. Market Size & Forecasts and Trend Analyses, 2018 to 2030 for the following
                       4.5.1. X-rays
                           4.5.1.1. Market estimates and forecast 2018 - 2030 (Revenue in USD Billion)
                       4.5.2. CT scans
                           4.5.2.1. Market estimates and forecast, 2018 - 2030 (Revenue in USD Billion)
                       4.5.3. Nuclear medicine scans
                           4.5.3.1. Market estimates and forecast, 2018 - 2030 (Revenue in USD Billion)
                       4.5.4. MRI scans
                           4.5.4.1. Market estimates and forecast, 2018 - 2030 (Revenue in USD Billion)
                       4.5.5. Ultrasound
                           4.5.5.1. Market estimates and forecast, 2018 - 2030 (Revenue in USD Billion)
                       4.5.6. Mammography
                           4.5.6.1. Market estimates and forecast, 2018 - 2030 (Revenue in USD Billion)
Chapter 5. End-use Estimates & Trend Analysis
                   5.1. Definitions and Scope
                       5.1.1. Hospitals
                       5.1.2. Diagnostic imaging centers
                       5.1.3. Others
                   5.2. End-Use Market Share, 2021 & 2030
                   5.3. Segment Dashboard
                   5.4. U.S. Imaging Services Market by End-Use Outlook
                   5.5. Market Size & Forecasts and Trend Analyses, 2018 to 2030 for the following
                       5.5.1. Hospitals
                           5.5.1.1. Market estimates and forecast, 2018 - 2030 (Revenue in USD Billion)
                       5.5.2. Diagnostic imaging centers
                           5.5.2.1. Market estimates and forecast, 2018 - 2030 (Revenue in USD Billion)
                       5.5.3. Others
                           5.5.3.1. Market estimates and forecast, 2018 - 2030 (Revenue in USD Billion)
Chapter 6. Competitive Landscape
                   6.1. Recent Developments & Impact Analysis, By Key Market Participants
                   6.2. Company/Competition Categorization
                       6.2.1. Innovators
                       6.2.2. Market Leaders
                       6.2.3. Emerging Players
                   6.3. Public Companies
                       6.3.1. Company market position analysis (Revenue, geographic presence, product portfolio, key serviceable industries, key alliances)
                       6.3.2. Company Market Share/Ranking, by region
                       6.3.3. Competitive Dashboard Analysis
                           6.3.3.1. Market Differentiators
                           6.3.3.2. Synergy Analysis: Major Deals and Strategic Alliances
                   6.4. Private Companies
                       6.4.1. List of key emerging companies/technology disruptors/innovators
                       6.4.2. Funding Outlook
                       6.4.3. Regional Network Map
                       6.4.4. Company market position analysis (geographic presence, product portfolio, key alliance, industry experience)
                   6.5. Supplier Ranking
                   6.6. Key company profiled
                       6.6.1. Radnet, Inc.
                           6.6.1.1. Company overview
                           6.6.1.2. Financial performance
                           6.6.1.3. Product benchmarking
                           6.6.1.4. Strategic initiatives
                       6.6.2. Sonic Healthcare
                           6.6.2.1. Company overview
                           6.6.2.2. Financial performance
                           6.6.2.3. Product benchmarking
                           6.6.2.4. Strategic initiatives
                       6.6.3. Dignity Health
                           6.6.3.1. Company overview
                           6.6.3.2. Financial performance
                           6.6.3.3. Product benchmarking
                           6.6.3.4. Strategic initiatives
                       6.6.4. Novant Health
                           6.6.4.1. Company overview
                           6.6.4.2. Financial performance
                           6.6.4.3. Product benchmarking
                           6.6.4.4. Strategic initiatives
                       6.6.5. Alliance Medical
                           6.6.5.1. Company overview
                           6.6.5.2. Financial performance
                           6.6.5.3. Product benchmarking
                           6.6.5.4. Strategic initiatives
                       6.6.6. Inhealth Group
                           6.6.6.1. Company overview
                           6.6.6.2. Financial performance
                           6.6.6.3. Product benchmarking
                           6.6.6.4. Strategic initiatives
                       6.6.7. Medica Group
                           6.6.7.1. Company overview
                           6.6.7.2. Financial performance
                           6.6.7.3. Product benchmarking
                           6.6.7.4. Strategic initiatives
                       6.6.8. Global Diagnostics
                           6.6.8.1. Company overview
                           6.6.8.2. Financial performance
                           6.6.8.3. Product benchmarking
                           6.6.8.4. Strategic initiatives
                       6.6.9. Concord Medical Services Holdings Limited
                           6.6.9.1. Company overview
                           6.6.9.2. Financial performance
                           6.6.9.3. Product benchmarking
                           6.6.9.4. Strategic initiatives
                       6.6.10. Center for Diagnostic Imaging, Inc.
                           6.6.10.1. Company overview
                           6.6.10.2. Financial performance
                           6.6.10.3. Product benchmarking
                           6.6.10.4. Strategic initiatives
                       6.6.11. Unilabs
                           6.6.11.1. Company overview
                           6.6.11.2. Financial performance
                           6.6.11.3. Product benchmarking
                           6.6.11.4. Strategic initiatives
                       6.6.12. Healius Limited
                           6.6.12.1. Company overview
                           6.6.12.2. Financial performance
                           6.6.12.3. Product benchmarking
                           6.6.12.4. Strategic initiatives
                       6.6.13. Simonmed Imaging
                           6.6.13.1. Company overview
                           6.6.13.2. Financial performance
                           6.6.13.3. Product benchmarking
                           6.6.13.4. Strategic initiatives


List of Tables

Table 1 List of Abbreviations
Table 2 U.S. imaging services market, by modality 2018 - 2030 (USD Billion)
Table 3 U.S. imaging services market, by end-use 2018 - 2030 (USD Billion)


List of Figures

Fig. 1 Market research process
Fig. 2 Data triangulation techniques
Fig. 3 Primary research pattern
Fig. 4 Market research approaches
Fig. 5 Value-chain-based sizing & forecasting
Fig. 6 QFD modeling for market share assessment
Fig. 7 Market formulation & validation
Fig. 8 U.S. imaging services systems: market outlook
Fig. 9 U.S. imaging services market competitive insights
Fig. 10 Parent market outlook
Fig. 11 Related/ancillary market outlook
Fig. 12 Penetration and growth prospect mapping
Fig. 13 Industry value chain analysis
Fig. 14 U.S. imaging services market driver impact
Fig. 15 U.S. imaging services market restraint impact
Fig. 16 U.S. imaging services market strategic initiatives analysis
Fig. 17 U.S. imaging services market: modality movement analysis
Fig. 18 U.S. imaging services market: modality outlook and key takeaways
Fig. 19 X-ray market estimates and forecast, 2018 - 2030
Fig. 20 CT scans market estimates and forecast, 2018 - 2030
Fig. 21 Nuclear medicine scans market estimates and forecast, 2018 - 2030
Fig. 22 MRI scans market estimates and forecast, 2018 - 2030
Fig. 23 Ultrasound market estimates and forecast, 2018 - 2030
Fig. 24 Mammography market estimates and forecast, 2018 - 2030
Fig. 25 U.S. imaging services: end-use movement analysis
Fig. 26 U.S. imaging services: end-use outlook and key takeaways
Fig. 27 Hospitals estimates and forecast, 2018 - 2030
Fig. 28 Diagnostic imaging centers estimates and forecast, 2018 - 2030
Fig. 29 Others estimates and forecast, 2018 - 2030
Fig. 30 Participant categorization- U.S. imaging services market
Fig. 31 Market share of key market players- U.S. imaging services market

What questions do you have? Get quick response from our industry experts. Request a Free Consultation

Market Segmentation

  • U.S. Imaging Services Modality Outlook (Revenue, USD Billion, 2018 - 2030)
    • X-rays
    • CT scans
    • Nuclear medicine scans
    • MRI scans
    • Ultrasound
    • Mammography
  • U.S. Imaging Services End-use Outlook (Revenue, USD Billion, 2018 - 2030)
    • Hospitals
    • Diagnostic imaging centers
    • Others

U.S. Imaging Services Market Dynamics

Driver: Increasing Prevalence of Cancer and Cardiac Disorders

The growing prevalence of cancer and cardiovascular diseases is expected to drive the need for medical imaging services. Medical imaging helps in early and accurate diagnosis of diseases, which helps in providing effective disease treatment. According to the National Cancer Institute at NIH, in 2018, around 1,735,350 new cases of cancer were diagnosed in the U.S. Therefore, to control the growing disease burden, a large number of medical professionals are using medical imaging devices in imaging services before performing surgeries. Medical professionals rely on preoperative MRI and CT scans in imaging services to visualize and determine the margins of tumors during surgeries. The burden of cardiovascular diseases is increasing, which is expected to drive the demand for medical imaging services. A large number of people die due to heart diseases in the U.S. According to the CDC, around 655,000 people in the U.S. die each year due to cardiovascular diseases. Coronary artery disease and heart attack are the most common heart problems in the U.S.

Driver: Growing Number of Outpatient Settings with Imaging Services

Imaging centers are medical facilities dedicated to performing imaging services. These centers use advanced techniques and high-tech equipment to produce accurate & clear images of bones, arteries, organs, blood vessels, nervous system, and soft tissues. High-definition images provide exact information that allows doctors or healthcare professionals to precisely diagnose variety of conditions. This helps doctors recommend effective and appropriate treatments. Imaging services can be performed on children & adults and can be done in several different ways. Imaging centers offer MRI, CT scan, nuclear medicine, & ultrasound systems for treatment and diagnosis of several diseases. Outpatient imaging center offers services in several suitable locations making them easily accessible. Moreover, such centers also have extended hours of operation to enable convenient and faster appointments. Furthermore, outpatient centers often have smaller, more connected staff teams, who can offer personalized care to patients. Thus, increasing preference toward outpatient imaging settings is likely to fuel the imaging services market.

Restraint: Increasing Cost of MRI Devices

Innovation and R&D result in an increase in the cost of MRI systems. Some states of the U.S. may face challenges in adopting MRI systems owing to low disposable income, high costs of products, and the presence of limited facilities & resources. The high cost of MRI systems prevents patients from gaining access because it increases their healthcare expenditure. Thus, despite the availability of these devices, the high cost may prevent their installation, and limit sales.

What Does This Report Include?

This section will provide insights into the contents included in this U.S. imaging services market report and help gain clarity on the structure of the report to assist readers in navigating smoothly.

U.S. imaging services market qualitative analysis

  • Industry overview

  • Industry trends

  • Market drivers and restraints

  • Market size

  • Growth prospects

  • Porter’s analysis

  • PESTEL analysis

  • Key market opportunities prioritized

  • Competitive landscape

    • Company overview

    • Financial performance

    • Product benchmarking

    • Latest strategic developments

U.S. imaging services market quantitative analysis

  • Market size, estimates, and forecast from 2018 to 2030

  • Market estimates and forecast for product segments up to 2030

  • Regional market size and forecast for product segments up to 2030

  • Market estimates and forecast for application segments up to 2030

  • Regional market size and forecast for application segments up to 2030

  • Company financial performance

What questions do you have? Get quick response from our industry experts. Request a Free Consultation

Research Methodology

A three-pronged approach was followed for deducing the U.S. imaging services market estimates and forecasts. The process has three steps: information procurement, analysis, and validation. The whole process is cyclical, and steps repeat until the estimates are validated. The three steps are explained in detail below:

Information procurement: Information procurement is one of the most extensive and important stages in our research process, and quality data is critical for accurate analysis. We followed a multi-channel data collection process for U.S. imaging services market to gather the most reliable and current information possible.

  • We buy access to paid databases such as Hoover’s and Factiva for company financials, industry information, white papers, industry journals, SME journals, and more.
  • We tap into Grand View’s proprietary database of data points and insights from active and archived monitoring and reporting.
  • We conduct primary research with industry experts through questionnaires and one-on-one phone interviews.
  • We pull from reliable secondary sources such as white papers and government statistics, published by organizations like WHO, NGOs, World Bank, etc., Key Opinion Leaders (KoL) publications, company filings, investor documents, and more.
  • We purchase and review investor analyst reports, broker reports, academic commentary, government quotes, and wealth management publications for insightful third-party perspectives.

Analysis: We mine the data collected to establish baselines for forecasting, identify trends and opportunities, gain insight into consumer demographics and drivers, and so much more. We utilized different methods of U.S. imaging services market data depending on the type of information we’re trying to uncover in our research.

  • Market Research Efforts: Bottom-up Approach for estimating and forecasting demand size and opportunity, top-down Approach for new product forecasting and penetration, and combined approach of both Bottom-up and Top-down for full coverage analysis.

  • Value-Chain-Based Sizing & Forecasting: Supply-side estimates for understanding potential revenue through competitive benchmarking, forecasting, and penetration modeling.

  • Demand-side estimates for identifying parent and ancillary markets, segment modeling, and heuristic forecasting.

  • Qualitative Functional Deployment (QFD) Modelling for market share assessment.

Market formulation and validation: We mine the data collected to establish baselines for forecasting, identify trends and opportunities, gain insight into consumer demographics and drivers, and so much more. We utilize different methods of data analysis depending on the type of information we’re trying to uncover in our research.

  • Market Formulation: This step involves the finalization of market numbers. This step on an internal level is designed to manage outputs from the Data Analysis step.

  • Data Normalization: The final market estimates and forecasts are then aligned and sent to industry experts, in-panel quality control managers for validation.

  • This step also entails the finalization of the report scope and data representation pattern.

  • Validation: The process entails multiple levels of validation. All these steps run in parallel, and the study is forwarded for publishing only if all three levels render validated results.

U.S. Imaging Services Market Categorization:

The U.S. imaging services market was categorized into three segments, namely modality (X-rays, CT scans, Nuclear medicine scans, MRI scans, Ultrasound, Mammography), end-use (Hospitals, Diagnostic imaging centers).

Segment Market Methodology:

The U.S. imaging services market was segmented into modality, end-use. The demand at a segment level was deduced using a funnel method. Concepts like the TAM, SAM, SOM, etc., were put into practice to understand the demand. We at GVR deploy three methods to deduce market estimates and determine forecasts. These methods are explained below:

Market research approaches: Bottom-up

  • Demand estimation of each product across countries/regions summed up to from the total market.

  • Variable analysis for demand forecast.

  • Demand estimation via analyzing paid database, and company financials either via annual reports or paid database.

  • Primary interviews for data revalidation and insight collection.

Market research approaches: Top-down

  • Used extensively for new product forecasting or analyzing penetration levels.

  • Tool used invoice product flow and penetration models Use of regression multi-variant analysis for forecasting Involves extensive use of paid and public databases.

  • Primary interviews and vendor-based primary research for variable impact analysis.

Market research approaches: Combined

  • This is the most common method. We apply concepts from both the top-down and bottom-up approaches to arrive at a viable conclusion.

Regional Market Methodology:

The U.S. imaging services market was analyzed at a regional level. The global was divided into U.S, keeping in focus variables like consumption patterns, export-import regulations, consumer expectations, etc. These regions were further divided into one countries, namely, the U.S.

All three above-mentioned market research methodologies were applied to arrive at regional-level conclusions. The regions were then summed up to form the global market.

U.S. imaging services market companies & financials:

The U.S. imaging services market was analyzed via companies operating in the sector. Analyzing these companies and cross-referencing them to the demand equation helped us validate our assumptions and conclusions. Key market players analyzed include:

  • RadNet, Inc., RadNet, Inc. is among the leaders in outpatient imaging. The company evolves its medical imaging business through a combination of organic growth and acquisitions. It provides standardized policies & procedures, training programs to physicians. The company sells computerized systems that display, store, distribute, and retrieve digital images through its subsidiary eRAD, Inc. The company has its regional networks in New York, Delaware, California, Florida, and Maryland. It operates in about 334 locations and has over 500 radiologists.

  • Alliance Medical, Alliance Medical is among the leading providers of medical imaging services in Europe. The company combines innovative imaging technologies and service excellence to improve patient care & support independent and NHS sector organizations with its ongoing imaging requirements. It operates across Europe including Ireland, Germany, Spain, Italy, and the Netherlands. It provides medical imaging services to over 400,000 patients in the UK every year.

  • InHealth Group, InHealth Group is one of the UK’s largest specialist providers of healthcare and diagnostic solutions. The company provides a wide range of healthcare solutions across the UK and treats over 3 million patients each year. The company is a market leader in the provision of expert diagnostic imaging solutions to Medico-Legal markets and Private Medical Insurance. Its venture team invests in emerging technologies and services globally to improve patient outcomes. It delivers its imaging service solutions to over 850 locations.

  • Sonic Healthcare Ltd., Sonic Healthcare Limited is an international healthcare provider with specialist operations in radiology/diagnostic imaging, general practice medicine, laboratory medicine/pathology, and corporate medical services. The company aims to be one of the world’s leading healthcare providers, with operating centers in Europe, Australasia, and North America. It employs around 1,500 radiologists & pathologists and over 10,000 radiographers, sonographers, medical scientists, nurses, & technicians.

  • Dignity Health, Dignity Health delivers excellent care to diverse communities across 21 states in the U.S. It is the fifth-largest health system in the U.S. and the largest hospital provider in California. The company is dedicated to delivering affordable, high-quality, healthcare services in an empathetic environment that meets every patient's mental & physical needs. The company provides diagnostic imaging services in Northern Santa Barbara County, San Luis Obispo County, and Ventura County.

  • Medica Group Plc, Medica Group is among the market leaders in teleradiology that provides hospital radiology departments with independent support to address severe capacity issues in both non-urgent & urgent reporting pathways. The company offers three primary services: elective, specialist, and nighthawk services. Its specialist services include CT, Positron Emission Tomography (PET) & nuclear medicine, MR prostate, CT cone beam, DXA, CT colonography, and audit.

  • Global Diagnostic Imaging, Global Diagnostic Imaging provides qualified wide-ranging enterprise workflow solutions and imaging services directly to offices, laboratories, and hospitals. The company has highly experienced and qualified cardiologists, sonographers, and radiologists, supported by the latest digital equipment specializing in MRI, ultrasound & CT procedures, and diagnostic interpretation.

  • Novant Health, Novant Health is a four-state integrated network of outpatient centers, physician clinics, and hospitals. It offers routine imaging services at various locations including all its medical centers and several outpatient imaging centers. The company’s imaging facilities are staffed by board-certified & certified technologists and fellowship-trained radiologists to confirm high-quality imaging and accurate reports. The company’s outpatient imaging centers provide flexible scheduling, comprising same-day or next-day appointments.

  • Healius Ltd., Healius Ltd. through its Healthcare Imaging Services (HIS) offers services to radiologists to help them focus on delivering quality care. The company presently manages around 140 sites in Australia. The company employs highly trained teams of sonographers, radiographers, nuclear medicine technologists, center support staff, corporate staff, and nurses. It operates through its own brand and specialty brands, including health scan, bridge road imaging, Mid North Coast Diagnostic Imaging, & Queensland Diagnostic Imaging.

  • Concord Medical Services Holdings Ltd., Concord Medical Services Holdings Ltd. operates as one of the largest networks of diagnostic and radiotherapy imaging centers in China. It operates a network of about 60 centers with over 41 hospital partners, covering about 19 provinces and 34 cities & administrative regions in China as of 2017. Its cooperative centers are equipped with primary units of medical equipment, including a head gamma knife system, linear accelerator, MRI scanner, PET-CT scanner, and gamma knife system.

Value chain-based sizing & forecasting

Supply Side Estimates

  • Company revenue estimation via referring to annual reports, investor presentations, and Hoover’s.

  • Segment revenue determination via variable analysis and penetration modeling.

  • Competitive benchmarking to identify market leaders and their collective revenue shares.

  • Forecasting via analyzing commercialization rates, pipelines, market initiatives, distribution networks, etc.

Demand side estimates

  • Identifying parent markets and ancillary markets

  • Segment penetration analysis to obtain pertinent

  • revenue/volume

  • Heuristic forecasting with the help of subject matter experts

  • Forecasting via variable analysis

U.S. Imaging Services Market Report Objectives:

  • Understanding market dynamics (in terms of drivers, restraints, & opportunities) in the countries.

  • Understanding trends & variables in the individual countries & their impact on growth and using analytical tools to provide high-level insights into the market dynamics and the associated growth pattern.

  • Understanding market estimates and forecasts (with the base year as 2023, historic information from 2018 to 2022, and forecast from 2024 to 2030). Regional estimates & forecasts for each category are available and are summed up to form the global market estimates.

U.S. Imaging Services Market Report Assumptions:

  • The report provides market value for the base year 2023 and a yearly forecast till 2030 in terms of revenue/volume or both. The market for each of the segment outlooks has been provided on region & country basis for the above-mentioned forecast period.

  • The key industry dynamics, major technological trends, and application markets are evaluated to understand their impact on the demand for the forecast period. The growth rates were estimated using correlation, regression, and time-series analysis.

  • We have used the bottom-up approach for market sizing, analyzing key regional markets, dynamics, & trends for various products and end-users. The total market has been estimated by integrating the country markets.

  • All market estimates and forecasts have been validated through primary interviews with the key industry participants.

  • Inflation has not been accounted for to estimate and forecast the market.

  • Numbers may not add up due to rounding off.

  • Europe consists of EU-8, Central & Eastern Europe, along with the Commonwealth of Independent States (CIS).

  • Asia Pacific includes South Asia, East Asia, Southeast Asia, and Oceania (Australia & New Zealand).

  • Latin America includes Central American countries and the South American continent

  • Middle East includes Western Asia (as assigned by the UN Statistics Division) and the African continent.

Primary Research

GVR strives to procure the latest and unique information for reports directly from industry experts, which gives it a competitive edge. Quality is of utmost importance to us, therefore every year we focus on increasing our experts’ panel. Primary interviews are one of the critical steps in identifying recent market trends and scenarios. This process enables us to justify and validate our market estimates and forecasts to our clients. With more than 8,000 reports in our database, we have connected with some key opinion leaders across various domains, including healthcare, technology, consumer goods, and the chemical sector. Our process starts with identifying the right platform for a particular type of report, i.e., emails, LinkedIn, seminars, or telephonic conversation, as every report is unique and requires a differentiated approach.

We send out questionnaires to different experts from various regions/ countries, which is dependent on the following factors:

  • Report/Market scope: If the market study is global, we send questionnaires to industry experts across various regions, including North America, Europe, Asia Pacific, Latin America, and MEA.

  • Market Penetration: If the market is driven by technological advancements, population density, disease prevalence, or other factors, we identify experts and send out questionnaires based on region or country dominance.

The time to start receiving responses from industry experts varies based on how niche or well-penetrated the market is. Our reports include a detailed chapter on the KoL opinion section, which helps our clients understand the perspective of experts already in the market space.

What questions do you have? Get quick response from our industry experts. Request a Free Consultation
gvr icn

GET A FREE SAMPLE

gvr icn

This FREE sample includes data points, ranging from trend analyses to estimates and forecasts. See for yourself.

gvr icn

NEED A CUSTOM REPORT?

We can customize every report - free of charge - including purchasing stand-alone sections or country-level reports, as well as offer affordable discounts for start-ups & universities. Contact us now

Certified Icon

We are GDPR and CCPA compliant! Your transaction & personal information is safe and secure. For more details, please read our privacy policy.