GVR Report cover Polylactic Acid Market Size, Share & Trends Report

Polylactic Acid Market Size, Share & Trends Analysis Report By Raw Material (Corn Starch, Sugarcane, Cassava), By Application (Rigid thermoform, Films & sheets, Bottles), By End-use, By Region, And Segment Forecasts, 2024 - 2030

  • Report ID: GVR-2-68038-669-1
  • Number of Pages: 135
  • Format: Electronic (PDF)

Polylactic Acid Market Size & Trends

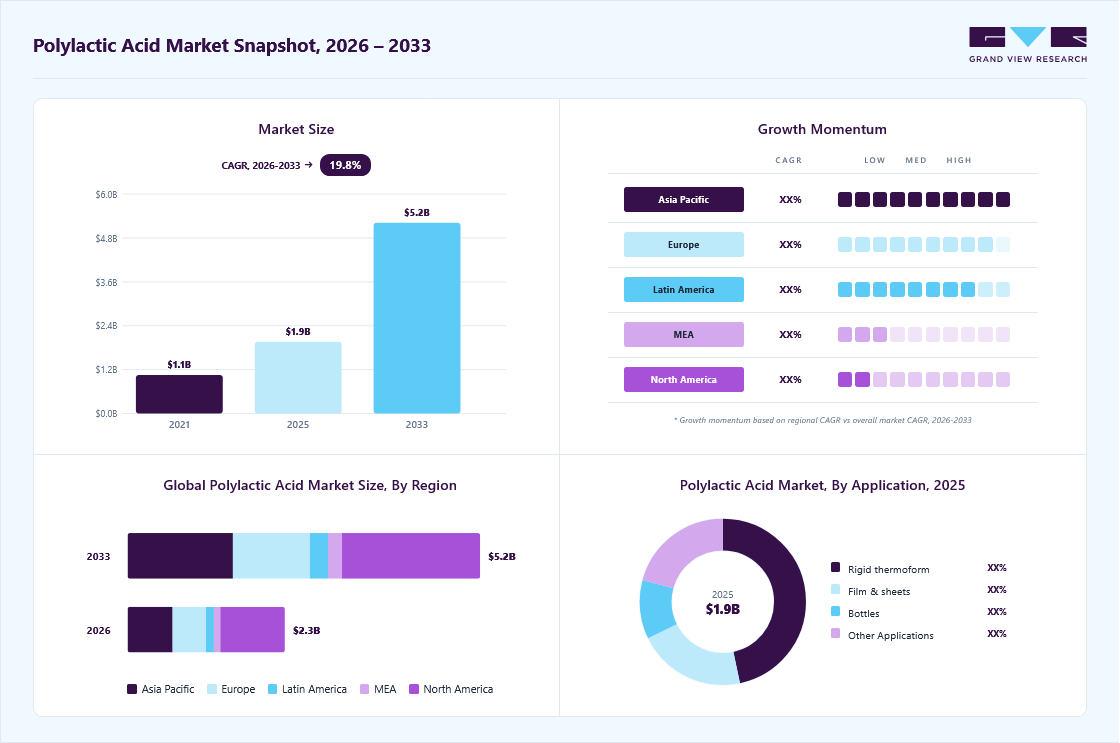
The global polylactic acid market size was estimated at USD 713.22 million in 2023 and is expected to grow at a compound annual growth rate (CAGR) of 21.4% from 2024 to 2030. The growth of the PLA market is mainly driven by the growing demand for polylactic acid (pla) biodegradable resin in packaging across emerging economies such as China, India, Italy, and others. Bioplastics are environmentally friendly alternatives to traditional plastics, notably in flexible and rigid packaging applications, because they are bio-based, compostable, and biodegradable in nature. Bioplastics are materials in which all the carbon is derived from renewable Raw Materials such as algae, corn, sugarcane, bacteria, potatoes, seashells, and starch.

U.S. Polylactic Acid market size and growth rate, 2023 - 2030

The growing transition toward developing energy-efficient vehicles and electric vehicles has pushed global automotive manufacturing companies toward including plastics in automotive components to reduce the overall weight of a vehicle. Thermoplastic plastic manufacturers are collaborating to develop plastics suitable for use in the automotive industry, which, in turn, is expected to drive the overall market growth.

As of 2022, the U.S. was one of the major countries exporting large amounts of polylactic acid to other countries while other countries are exporting very small amounts of polylactic acid as compared to the U.S. Due to the availability of raw materials and the presence of major PLA manufacturers, the country experiences rapid expansion. The increasing food processing business is expected to stimulate demand for packaging materials, resulting in PLA demand in the country. Increasing demand for packaged food and ready-to-eat meals is significantly boosting the growth of the U.S. food processing market.

The favorable government laws and regulations implemented in the U.S. related to the applicationion of polylactic acid, along with the easy availability of raw materials for the synthesis of this acid in the country, are projected to boost the growth of the market in the U.S. from 2023 to 2030. The increased applicationion of polylactic acid in the country resulted to its increased usage in the packaging and healthcare industries in the U.S. Other significant factors contributing to the country's market growth include increased consumer awareness of the use of bioplastics and the presence of key enterprises in the country.

PLA packaging provides an environment-friendly solution and helps in enhancing the appearance of the final product. PLA packaging has become an essential part of green packaging of various food products, which is likely to improve its growth prospects over the forecast period. The increasing utilization of bio-based plastics in flexible packaging is expected to fuel the growth of the polylactic acid market. Growing demand for food, on account of increasing global population, is one of the key trends augmenting the market growth.

However, the polylactic acid pricing as compared to conventional polymers, including polypropylene (PP), polyethylene (PE), polyvinyl chloride (PVC), polyethylene terephthalate (PET), and polystyrene (PS), is one of the key factors restraining the growth of the global PLA market. One of the major cost factors is the raw material used in the fermentation process. Advancements in glucose fermentation have lowered the production costs of lactic acid and PLA

Market Concentration & Characteristics

The global polylactic acid market is fairly fragmented in nature with the presence of various key players such as TotalEnergies Corbion bv, NatureWorks LLC, JIANGSU SUPLA BIOPLASTICS CO., LTD., Futerro, COFCO, Jiangxi Keyuan Biopharm Co.,Ltd., Shanghai Tong-jie-liang Biomaterials Co.,LTD., Zhejiang Hisun Biomaterials Co., Ltd.. as well as a few medium and small regional players operating in different parts of the world. The global players face intense competition from each other as well as from the regional players who have strong distribution networks and good knowledge about suppliers & regulations.

Polylactic Acid Market Concentration & Characteristics

The companies in the market compete on the basis of application quality offered and the technology used for the applicationion of plastics. Major players, in particular, compete on the basis of application development capability and new technologies used in application formulation. Established players such as BASF SE are investing in research & development activities to formulate new and advanced plastics compounds, which gives them a competitive edge over the other players.

To maintain strong and healthy competitive environment across the marketspace, the global polylactic acid companies have implemented various strategic initiatives such as acquisition & merger, new application launch, applicationion expansion, and various others. In April 2023, NatureWorks and Jabil joined forces to provide new Ingeo PLA-based powder for selective laser sintering 3D printing platforms. The new Jabil PLA 3110P application, advertised as a cost-effective alternative to the current PA-12, has a lower sintering temperature and an 89% lower carbon footprint.

Raw Material Insights

Corn starch dominated the raw material segmentation in 2023 with a market revenue share of above 64.0%. Since corn starch is readily available and is inexpensive, many PLA manufacturers utilize corn starch for the processing of polylactic acid. Furthermore, increasing environmental hazard due to the utilization of virgin plastics has increased the demand for bio-based plastics such as polylactic acid from various end-use industries such as automotive, packaging, electrical & electronics, and others.

Followed by sugarcane with a market revenue share of above 26.0% in 2023. Since various end-use industries are shifting towards sustainability and adopting circular economy, the demand for bio-based plastics such as polylactic acid (PLA) has increased tremendously. Hence various bio-based plastic manufacturers have adopted distinctive raw materials such as sugarcane for the manufacturing of PLA.

Furthermore, attributes such as high tensile strength and resistance towards thermal conditions are due to the fibrous properties of sugarcane bagasse. Additionally, as an alternative to corn starch, PLA is additionally manufactured using cassava. Cassava’s starch content is provides high yield and diversified adaptability to climatic changes, hence is utilized for the manufacturing of PLA.

Application Insights

Rigid thermoform dominated the application segmentation in 2023 with a market revenue share of above 44.0%. PLA posses high thermoforming attributes, which implies that on exposure to high temperature conditions, PLA can be transformed into complex geometric designs without compromising its structural integrity. Hence, this makes its ideally suitable for variety of applications that require precise and intricate shapes.

Followed by films & sheets with a market revenue share of above 20.0% in 2023. PLA provides high clarity, durability & strength, and enhanced barrier attributes, hence making it highly suitable for the manufacturing of films & sheets to be utilized across various packaging applications. Furthermore, the ease of printability on the surface of the end-application has increased the demand for PLA-based films & sheets across the advertisement & branding industry.

Additionally, PLA is witnessed rise in demand from bottle manufacturers since it is manufactured using renewable reRaw Materials such as corn starch, sugarcane, and cassava. Furthermore, unlike traditional plastics, PLA is free of bisphenol-A (BPA) which is a component associated with serious health risks and concerns. However, since PLA doesn’t contain BPA, it is highly utilized across the food & beverage industry for the manufacturing of bottles.

End-use Insights

Packaging sub-segment dominated the end-use segmentation in 2023 with a market revenue share above 36.0%. PLA is widely utilized in packaging end-use such as food & beverage packaging, personal care packaging, and household care applications. The inclination of consumers toward sustainable packaging and the rising landfill issue across the globe is compelling manufacturers to use polylactic acid in packaging. In addition, a strict ban on single-use plastics in many countries, such as the UK, Zimbabwe, Taiwan, New Zealand, and several states of the U.S. (such as New York, California, and Hawaii), is significantly driving the demand for PLA in packaging end-use.

Global Polylactic Acid market share and size, 2022

The demand for polylactic acid in the agriculture sector is expected to grow significantly on account of the increasing focus on reducing environmental pollution and providing a conducive environment for composting. Biodegradable applications are increasingly being utilized in nurseries and gardening owing to their superior properties such as propelling the growth of plant seedlings and preventing fruit rotting of fruit rotting. This is expected to influence the expansion and increase the penetration of PLA in agriculture sector.

In automotive industry, polylactic acid is used in various applications such as under the hood components and interior parts. PLA is very effective owing to its characteristic for reducing the carbon footprint due to its high bio-content. It offers impact resistance, UV resistance, high gloss and excellent colorability, and dimensional stability. These factors make it an alternative to traditional plastics such as Polylactic Acid, polyethylene terephthalate, polyamide, acrylonitrile butadiene styrene, and polybutylene terephthalate and are preferred for automotive interiors and engine compartments.

Regional Insights

North America dominated the market and held a revenue share of over 41.0% in 2023. The North American market is expected to be driven by the growing demand for bioplastics. Furthermore, the regional market is characterized by a strong demand for sustainable applications, which has resulted in a rising demand for sustainability in packaging. The overall demand for bioplastics in North America is also expected to be spurred by initiatives for promoting environment-friendly applications by the U.S. Department of Agriculture.

Polylactic Acid Market Trends, by Region, 2023 - 2030

The growing demand for textiles in the region is expected to result in increased consumption of polylactic acid. Moreover, the increasing demand for technical textiles on account of their use in a broad range of end-use, including agriculture, transportation, construction, and medical, is expected to augment the demand for polylactic acid over the forecast period.

The PLA market in Mexico is expected to witness substantial growth over the forecast period owing to the rising demand from the packaging end-use sector for various applications such as bags, cups, lids, cutlery, straws, and containers, among others. These aforementioned applications are environment-friendly, sustainable, and compostable. Therefore, the growing demand for green and sustainable packaging solutions is projected to augment the demand for PLA in the Mexican market.

Key Companies & Market Share Insights

Key companies are adopting several organic and inorganic growth strategies, such as capacity expansion, mergers & acquisitions, and joint ventures, to maintain and expand their market share.

  • In October 2023, NatureWorks LLC, a PLA manufacturer announced it’s commencement of PLA facility in Thailand. The company announced that the applicationion facility will be completely functional by 2025 with a applicationion capacity of 75 kilotons per annum.

  • In April 2023, NatureWorks LLC, introduced their new PLA biopolymer Ingeo 6500D for non-wovens. The tensile strength of the newly introduced application provides enhanced processing for converters, boosting low basis weight fabric applicationion on the latest generation of spunbound equipment.

Key Polylactic Acid Companies:

  • TotalEnergies Corbion bv
  • NatureWorks LLC
  • JIANGSU SUPLA BIOPLASTICS CO., LTD.
  • Futerro
  • COFCO
  • Jiangxi Keyuan Biopharm Co.,Ltd.
  • Shanghai Tong-jie-liang Biomaterials Co.,LTD.
  • Zhejiang Hisun Biomaterials Co., Ltd.
  • BASF SE
  • Danimer Scientific
  • Mitsubishi Chemical America, Inc.
  • UNITIKA LTD.

Recent Developments

  • In May 2023, TotalEnergies Corbion collaborated with Bluepha Co. Ltd for making advanced sustainable biomaterials solutions in China. This is possible by combining polyhydroxyalkanoates (PHA) of Bluepha® with Luminy® polylactic acid technology

  • In May 2023, TotalEnergies Corbion announced an agreement with Xiamen Changsu Industrial Pte Ltd. For making advancements in the polylactic acid market. Both companies will operate together for market promotion, research and development, and product development of the latest applications and technologies of biaxially oriented polylactic acid (BOPLA)

  • In April 2023, NatureWorks LLC declared its collaboration with Jabil Inc. to provide the latest polylactic acid-based powder for particular laser sintering 3D printing platforms

  • In December 2022, Futerro initiated plans to set up an integrated biorefinery in Normandy for the production and recycling of polylactic acid. The purpose is to make a generous contribution towards the achievement of a green economy, thus creating a transition from fossil carbon to carbon from biomass

  • In November 2022, NatureWorks LLC collaborated with CJ Biomaterials to develop a novel biopolymer solution with the use of polylactic acid technology. This intended to replace fossil fuel plastics from compostable food service ware and packaging to personal care, and other end products

Polylactic Acid Market Report Scope

Report Attribute

Details

Market size value in 2024

USD 842.05 million

Revenue forecast in 2030

USD 2,772.93 million

Growth rate

CAGR of 21.4% from 2024 to 2030

Historical data

2018 - 2023

Forecast period

2024 - 2030

Quantitative Units

Volume in kilotons, revenue in USD million, and CAGR from 2024 to 2030

Report coverage

Volume forecast, revenue forecast, competitive landscape, growth factors, and trends

Segments covered

Raw material, application, end-use, and region

Regional scope

North America; Europe; Asia Pacific; Central & South America; Middle East & Africa

Country scope

U.S.; Canada; Mexico; Germany; UK; France; Italy; Spain; Netherlands; Turkey; China; India; Japan; South Korea; Singapore; Malaysia; Indonesia; Philippines; Thailand; Vietnam; Australia; Brazil; Argentina; Saudi Arabia; United Arab Emirates (UAE); South Africa

Key companies profiled

TotalEnergies Corbion bv; NatureWorks LLC; JIANGSU SUPLA BIOPLASTICS CO., LTD.; Futerro; COFCO; Jiangxi Keyuan Biopharm Co.,Ltd.; Shanghai Tong-jie-liang Biomaterials Co.,LTD.; Zhejiang Hisun Biomaterials Co., Ltd.; BASF SE; Danimer Scientific; Mitsubishi Chemical America, Inc.; UNITIKA LTD.

Customization scope

Free report customization (equivalent up to 8 analysts working days) with purchase. Addition or alteration to country, regional & segment scope.

Pricing and purchase options

Avail customized purchase options to meet your exact research needs. Explore purchase options


Global Polylactic Acid Market Report Segmentation

This report forecasts revenue and volume growth at the global, regional, and country levels and provides an analysis of the latest industry trends and opportunities in each of the sub-segments from 2018 to 2030. For this study, Grand View Research has segmented the global Polylactic Acid market report based on raw material, application, end-use, and region:

Global Polylactic Acid Market Report Segmentation

  • Raw Material Outlook (Volume, Kilotons; Revenue, USD Million, 2018 - 2030)

    • Corn starch

    • Sugarcane

    • Cassava

    • Others

  • Application Outlook (Volume, Kilotons; Revenue, USD Million, 2018 - 2030)

    • Rigid thermoform

    • Film & sheets

    • Bottles

    • Others

  • End-use Outlook (Volume, Kilotons; Revenue, USD Million, 2018 - 2030)

    • Packaging

    • Agriculture

    • Automotive & transportation

    • Electronics

    • Textile

    • Consumer goods

    • Bio-medical

    • Others

  • Regional Outlook (Volume, Kilotons; Revenue, USD Billion, 2018 - 2030)

    • North America

      • U.S.

      • Canada

      • Mexico

    • Europe

      • Germany

      • UK

      • France

      • Italy

      • Spain

      • Netherlands

      • Turkey

    • Asia Pacific

      • China

      • India

      • Japan

      • South Korea

      • Singapore

      • Malaysia

      • Indonesia

      • Philippines

      • Thailand

      • Vietnam

      • Australia

    • Central & South America

      • Brazil

      • Argentina

    • Middle East & Africa

      • Saudi Arabia

      • United Arab Emirates (UAE)

      • South Africa

Frequently Asked Questions About This Report

Table of Contents

Chapter 1. Polylactic Acid Market: Methodology and Scope
                    1.1. Market Segmentation & Scope
                    1.2. Market Definition
                    1.3. Information Procurement
                        1.3.1. Purchased Database
                        1.3.2. GVR’s Internal Database
                        1.3.3. Secondary Raw Materials & Third-Party Perspectives
                        1.3.4. Primary Research
                    1.4. Information Analysis
                        1.4.1. Data Analysis Models
                    1.5. Market Formulation & Data Visualization
                    1.6. Data Validation & Publishing
Chapter 2. Polylactic Acid Market: Executive Summary
                    2.1. Market Snapshot, 2023
                    2.2. Segment Snapshot, 2023
                    2.3. Competitive Landscape Snapshot
Chapter 3. Polylactic Acid Market: Variables, Trends & Scope
                    3.1. Global Bioplastics Market Outlook
                    3.2. Industry Value Chain Analysis
                        3.2.1. Raw Material Trends
                    3.3. Regulatory Framework
                    3.4. Market Dynamics
                        3.4.1. Market Driver Analysis
                        3.4.2. Market Restraint Analysis
                        3.4.3. Industry Opportunity Analysis
                        3.4.4. Industry Challenges Analysis
                    3.5. Porter’s Five Forces Analysis
                        3.5.1. Supplier Power
                        3.5.2. Buyer Power
                        3.5.3. Substitution Threat
                        3.5.4. Threat from New Entrant
                        3.5.5. Competitive Rivalry
                    3.6. PESTEL Analysis
                        3.6.1. Political Landscape
                        3.6.2. Economic Landscape
                        3.6.3. Social Landscape
                        3.6.4. Technological Landscape
                        3.6.5. Environmental Landscape
                        3.6.6. Legal Landscape
                    3.7. East European Geopolitical Implication of the Industry Overview
                    3.8. Impact of COVID-19 on Polylactic Acid market
Chapter 4. Polylactic Acid Market: Raw Material Outlook Estimates & Forecasts
                    4.1. Polylactic Acid Market: Raw Material Movement Analysis, 2023 & 2030
                    4.2. Corn Starch
                        4.2.1. Polylactic Acid market estimates and forecast, by corn starch, 2018 - 2030 (Kilotons) (USD Million)
                    4.3. Sugarcane
                        4.3.1. Polylactic Acid market estimates and forecast, by sugarcane, 2018 - 2030 (Kilotons) (USD Million)
                    4.4. Cassava
                        4.4.1. Polylactic Acid market estimates and forecast, by cassava, 2018 - 2030 (Kilotons) (USD Million)
                    4.5. Others
                        4.5.1. Polylactic Acid market estimates and forecast, by others, 2018 - 2030 (Kilotons) (USD Million)
Chapter 5. Polylactic Acid Market: Application Outlook Estimates & Forecasts
                    5.1. Polylactic Acid Market: Application Movement Analysis, 2023 & 2030
                    5.2. Rigid Thermoform
                        5.2.1. Polylactic Acid market estimates and forecast, by rigid thermoform, 2018 - 2030 (Kilotons) (USD Million)
                    5.3. Films & sheets
                        5.3.1. Polylactic Acid market estimates and forecast, by films & sheets, 2018 - 2030 (Kilotons) (USD Million)
                    5.4. Bottles
                        5.4.1. Polylactic Acid market estimates and forecast, by bottles, 2018 - 2030 (Kilotons) (USD Million)
                    5.5. Others
                        5.5.1. Polylactic Acid market estimates and forecast, by others, 2018 - 2030 (Kilotons) (USD Million)
Chapter 6. Polylactic Acid Market: End-use Outlook Estimates & Forecasts
                    6.1. Polylactic Acid Market: End-use Movement Analysis, 2023 & 2030
                    6.2. Packaging
                        6.2.1. Polylactic Acid market estimates and forecast, by packaging, 2018 - 2030 (Kilotons) (USD Million)
                    6.3. Agriculture
                        6.3.1. Polylactic Acid market estimates and forecast, by agriculture, 2018 - 2030 (Kilotons) (USD Million)
                    6.4. Automotive & transport
                        6.4.1. Polylactic Acid market estimates and forecast, by automotive & transport, 2018 - 2030 (Kilotons) (USD Million)
                    6.5. Electronics
                        6.5.1. Polylactic Acid market estimates and forecast, by electronics, 2018 - 2030 (Kilotons) (USD Million)
                    6.6. Textile
                        6.6.1. Polylactic Acid market estimates and forecast, by textile, 2018 - 2030 (Kilotons) (USD Million)
                    6.7. Consumer goods
                        6.7.1. Polylactic Acid market estimates and forecast, by consumer goods, 2018 - 2030 (Kilotons) (USD Million)
                    6.8. Bio-medical
                        6.8.1. Polylactic Acid market estimates and forecast, by bio-medical, 2018 - 2030 (Kilotons) (USD Million)
                    6.9. Others
                        6.9.1. Polylactic Acid market estimates and forecast, by others, 2018 - 2030 (Kilotons) (USD Million)
Chapter 7. Polylactic Acid Market Regional Outlook Estimates & Forecasts
                    7.1. Regional Movement Analysis & Market Share, 2023 & 2030
                    7.2. Polylactic Acid Market: Regional Movement Analysis, 2023 & 2030
                    7.3. North America
                        7.3.1. North America Market estimates and forecast, 2018 - 2030 (Kilotons) (USD Million)
                        7.3.2. North America Market estimates and forecast, by Raw Material, 2018 - 2030 (Kilotons) (USD Million)
                        7.3.3. North America Market estimates and forecast, by application, 2018 - 2030 (Kilotons) (USD Million)
                        7.3.4. North America Market estimates and forecast, by end-use, 2018 - 2030 (Kilotons) (USD Million)
                        7.3.5. U.S.
                            7.3.5.1. U.S. Market estimates and forecast, 2018 - 2030 (Kilotons) (USD Million)
                            7.3.5.2. U.S. Market estimates and forecast, by Raw Material, 2018 - 2030 (Kilotons) (USD Million)
                            7.3.5.3. U.S. Market estimates and forecast, by application, 2018 - 2030 (Kilotons) (USD Million)
                            7.3.5.4. U.S. Market estimates and forecast, by end-use, 2018 - 2030 (Kilotons) (USD Million)
                        7.3.6. Canada
                            7.3.6.1. Canada Market estimates and forecast, 2018 - 2030 (Kilotons) (USD Million)
                            7.3.6.2. Canada Market estimates and forecast, by Raw Material, 2018 - 2030 (Kilotons) (USD Million)
                            7.3.6.3. Canada Market estimates and forecast, by application, 2018 - 2030 (Kilotons) (USD Million)
                            7.3.6.4. Canada Market estimates and forecast, by end-use, 2018 - 2030 (Kilotons) (USD Million)
                        7.3.7. Mexico
                            7.3.7.1. Mexico Market estimates and forecast, 2018 - 2030 (Kilotons) (USD Million)
                            7.3.7.2. Mexico Market estimates and forecast, by Raw Material, 2018 - 2030 (Kilotons) (USD Million)
                            7.3.7.3. Mexico Market estimates and forecast, by application, 2018 - 2030 (Kilotons) (USD Million)
                            7.3.7.4. Mexico Market estimates and forecast, by end-use, 2018 - 2030 (Kilotons) (USD Million)
                    7.4. Europe
                        7.4.1. Europe Market estimates and forecast, 2018 - 2030 (Kilotons) (USD Million)
                        7.4.2. Europe Market estimates and forecast, by Raw Material, 2018 - 2030 (Kilotons) (USD Million)
                        7.4.3. Europe Market estimates and forecast, by application, 2018 - 2030 (Kilotons) (USD Million)
                        7.4.4. Europe Market estimates and forecast, by end-use, 2018 - 2030 (Kilotons) (USD Million)
                        7.4.5. Germany
                            7.4.5.1. Germany Market estimates and forecast, 2018 - 2030 (Kilotons) (USD Million)
                            7.4.5.2. Germany Market estimates and forecast, by Raw Material, 2018 - 2030 (Kilotons) (USD Million)
                            7.4.5.3. Germany Market estimates and forecast, by application, 2018 - 2030 (Kilotons) (USD Million)
                            7.4.5.4. Germany Market estimates and forecast, by end-use, 2018 - 2030 (Kilotons) (USD Million)
                        7.4.6. France
                            7.4.6.1. France Market estimates and forecast, 2018 - 2030 (Kilotons) (USD Million)
                            7.4.6.2. France Market estimates and forecast, by Raw Material, 2018 - 2030 (Kilotons) (USD Million)
                            7.4.6.3. France Market estimates and forecast, by application, 2018 - 2030 (Kilotons) (USD Million)
                            7.4.6.4. France Market estimates and forecast, by end-use, 2018 - 2030 (Kilotons) (USD Million)
                        7.4.7. UK
                            7.4.7.1. UK Market estimates and forecast, 2018 - 2030 (Kilotons) (USD Million)
                            7.4.7.2. UK Market estimates and forecast, by Raw Material, 2018 - 2030 (Kilotons) (USD Million)
                            7.4.7.3. UK Market estimates and forecast, by application, 2018 - 2030 (Kilotons) (USD Million)
                            7.4.7.4. UK Market estimates and forecast, by end-use, 2018 - 2030 (Kilotons) (USD Million)
                        7.4.8. Italy
                            7.4.8.1. Italy Market estimates and forecast, 2018 - 2030 (Kilotons) (USD Million)
                            7.4.8.2. Italy Market estimates and forecast, by Raw Material, 2018 - 2030 (Kilotons) (USD Million)
                            7.4.8.3. Italy Market estimates and forecast, by application, 2018 - 2030 (Kilotons) (USD Million)
                            7.4.8.4. Italy Market estimates and forecast, by end-use, 2018 - 2030 (Kilotons) (USD Million)
                        7.4.9. France
                            7.4.9.1. France Market estimates and forecast, 2018 - 2030 (Kilotons) (USD Million)
                            7.4.9.2. France Market estimates and forecast, by Raw Material, 2018 - 2030 (Kilotons) (USD Million)
                            7.4.9.3. France Market estimates and forecast, by application, 2018 - 2030 (Kilotons) (USD Million)
                            7.4.9.4. France Market estimates and forecast, by end-use, 2018 - 2030 (Kilotons) (USD Million)
                        7.4.10. Spain
                            7.4.10.1. Spain Market estimates and forecast, 2018 - 2030 (Kilotons) (USD Million)
                            7.4.10.2. Spain Market estimates and forecast, by Raw Material, 2018 - 2030 (Kilotons) (USD Million)
                            7.4.10.3. Spain Market estimates and forecast, by application, 2018 - 2030 (Kilotons) (USD Million)
                            7.4.10.4. Spain Market estimates and forecast, by end-use, 2018 - 2030 (Kilotons) (USD Million)
                        7.4.11. Netherlands
                            7.4.11.1. Netherlands Market estimates and forecast, 2018 - 2030 (Kilotons) (USD Million)
                            7.4.11.2. Netherlands Market estimates and forecast, by Raw Material, 2018 - 2030 (Kilotons) (USD Million)
                            7.4.11.3. Netherlands Market estimates and forecast, by application, 2018 - 2030 (Kilotons) (USD Million)
                            7.4.11.4. Netherlands Market estimates and forecast, by end-use, 2018 - 2030 (Kilotons) (USD Million)
                        7.4.12. Turkey
                            7.4.12.1. Turkey Market estimates and forecast, 2018 - 2030 (Kilotons) (USD Million)
                            7.4.12.2. Turkey Market estimates and forecast, by Raw Material, 2018 - 2030 (Kilotons) (USD Million)
                            7.4.12.3. Turkey Market estimates and forecast, by application, 2018 - 2030 (Kilotons) (USD Million)
                            7.4.12.4. Turkey Market estimates and forecast, by end-use, 2018 - 2030 (Kilotons) (USD Million)
                    7.5. Asia Pacific
                        7.5.1. Asia Pacific Market estimates and forecast, 2018 - 2030 (Kilotons) (USD Million)
                        7.5.2. Asia Pacific Market estimates and forecast, by Raw Material, 2018 - 2030 (Kilotons) (USD Million)
                        7.5.3. Asia Pacific Market estimates and forecast, by application, 2018 - 2030 (Kilotons) (USD Million)
                        7.5.4. Asia Pacific Market estimates and forecast, by end-use, 2018 - 2030 (Kilotons) (USD Million)
                        7.5.5. China
                            7.5.5.1. China Market estimates and forecast, 2018 - 2030 (Kilotons) (USD Million)
                            7.5.5.2. China Market estimates and forecast, by Raw Material, 2018 - 2030 (Kilotons) (USD Million)
                            7.5.5.3. China Market estimates and forecast, by application, 2018 - 2030 (Kilotons) (USD Million)
                            7.5.5.4. China Market estimates and forecast, by end-use, 2018 - 2030 (Kilotons) (USD Million)
                        7.5.6. India
                            7.5.6.1. India Market estimates and forecast, 2018 - 2030 (Kilotons) (USD Million)
                            7.5.6.2. India Market estimates and forecast, by Raw Material, 2018 - 2030 (Kilotons) (USD Million)
                            7.5.6.3. India Market estimates and forecast, by application, 2018 - 2030 (Kilotons) (USD Million)
                            7.5.6.4. India Market estimates and forecast, by end-use, 2018 - 2030 (Kilotons) (USD Million)
                        7.5.7. Japan
                            7.5.7.1. Japan Market estimates and forecast, 2018 - 2030 (Kilotons) (USD Million)
                            7.5.7.2. Japan Market estimates and forecast, by Raw Material, 2018 - 2030 (Kilotons) (USD Million)
                            7.5.7.3. Japan Market estimates and forecast, by application, 2018 - 2030 (Kilotons) (USD Million)
                            7.5.7.4. Japan Market estimates and forecast, by end-use, 2018 - 2030 (Kilotons) (USD Million)
                        7.5.8. South Korea
                            7.5.8.1. South Korea Market estimates and forecast, 2018 - 2030 (Kilotons) (USD Million)
                            7.5.8.2. South Korea Market estimates and forecast, by Raw Material, 2018 - 2030 (Kilotons) (USD Million)
                            7.5.8.3. South Korea Market estimates and forecast, by end-use, 2018 - 2030 (Kilotons) (USD Million)
                            7.5.8.4. South Korea Market estimates and forecast, by application, 2018 - 2030 (Kilotons) (USD Million)
                        7.5.9. Malaysia
                            7.5.9.1. Malaysia Market estimates and forecast, 2018 - 2030 (Kilotons) (USD Million)
                            7.5.9.2. Malaysia Market estimates and forecast, by Raw Material, 2018 - 2030 (Kilotons) (USD Million)
                            7.5.9.3. Malaysia Market estimates and forecast, by application, 2018 - 2030 (Kilotons) (USD Million)
                            7.5.9.4. Malaysia Market estimates and forecast, by application, 2018 - 2030 (Kilotons) (USD Million)
                        7.5.10. Thailand
                            7.5.10.1. Thailand Market estimates and forecast, 2018 - 2030 (Kilotons) (USD Million)
                            7.5.10.2. Thailand Market estimates and forecast, by Raw Material, 2018 - 2030 (Kilotons) (USD Million)
                            7.5.10.3. Thailand Market estimates and forecast, by application, 2018 - 2030 (Kilotons) (USD Million)
                            7.5.10.4. Thailand Market estimates and forecast, by end-use, 2018 - 2030 (Kilotons) (USD Million)
                        7.5.11. Indonesia
                            7.5.11.1. Indonesia Market estimates and forecast, 2018 - 2030 (Kilotons) (USD Million)
                            7.5.11.2. Indonesia Market estimates and forecast, by Raw Material, 2018 - 2030 (Kilotons) (USD Million)
                            7.5.11.3. Indonesia Market estimates and forecast, by application, 2018 - 2030 (Kilotons) (USD Million)
                            7.5.11.4. Indonesia Market estimates and forecast, by end-use, 2018 - 2030 (Kilotons) (USD Million)
                        7.5.12. Philippines
                            7.5.12.1. Philippines Market estimates and forecast, 2018 - 2030 (Kilotons) (USD Million)
                            7.5.12.2. Philippines Market estimates and forecast, by Raw Material, 2018 - 2030 (Kilotons) (USD Million)
                            7.5.12.3. Philippines Market estimates and forecast, by application, 2018 - 2030 (Kilotons) (USD Million)
                            7.5.12.4. Philippines Market estimates and forecast, by end-use, 2018 - 2030 (Kilotons) (USD Million)
                        7.5.13. Vietnam
                            7.5.13.1. Vietnam Market estimates and forecast, 2018 - 2030 (Kilotons) (USD Million)
                            7.5.13.2. Vietnam Market estimates and forecast, by Raw Material, 2018 - 2030 (Kilotons) (USD Million)
                            7.5.13.3. Vietnam Market estimates and forecast, by application, 2018 - 2030 (Kilotons) (USD Million)
                            7.5.13.4. Vietnam Market estimates and forecast, by end-use, 2018 - 2030 (Kilotons) (USD Million)
                        7.5.14. Australia
                            7.5.14.1. Australia Market estimates and forecast, 2018 - 2030 (Kilotons) (USD Million)
                            7.5.14.2. Australia Market estimates and forecast, by Raw Material, 2018 - 2030 (Kilotons) (USD Million)
                            7.5.14.3. Australia Market estimates and forecast, by application, 2018 - 2030 (Kilotons) (USD Million)
                            7.5.14.4. Australia Market estimates and forecast, by application, 2018 - 2030 (Kilotons) (USD Million)
                    7.6. Central & South America
                        7.6.1. Central & South America Market estimates and forecast, 2018 - 2030 (Kilotons) (USD Million)
                        7.6.2. Central & South America Market estimates and forecast, by Raw Material, 2018 - 2030 (Kilotons) (USD Million)
                        7.6.3. Central & South America Market estimates and forecast, by application, 2018 - 2030 (Kilotons) (USD Million)
                        7.6.4. Central & South America Market estimates and forecast, by end-use, 2018 - 2030 (Kilotons) (USD Million)
                        7.6.5. Brazil
                            7.6.5.1. Brazil Market estimates and forecast, 2018 - 2030 (Kilotons) (USD Million)
                            7.6.5.2. Brazil Market estimates and forecast, by Raw Material, 2018 - 2030 (Kilotons) (USD Million)
                            7.6.5.3. Brazil Market estimates and forecast, by application, 2018 - 2030 (Kilotons) (USD Million)
                            7.6.5.4. Brazil Market estimates and forecast, by end-use, 2018 - 2030 (Kilotons) (USD Million)
                        7.6.6. Argentina
                            7.6.6.1. Argentina Market estimates and forecast, 2018 - 2030 (Kilotons) (USD Million)
                            7.6.6.2. Argentina Market estimates and forecast, by Raw Material, 2018 - 2030 (Kilotons) (USD Million)
                            7.6.6.3. Argentina Market estimates and forecast, by application, 2018 - 2030 (Kilotons) (USD Million)
                            7.6.6.4. Argentina Market estimates and forecast, by end-use, 2018 - 2030 (Kilotons) (USD Million)
                    7.7. Middle East & Africa
                        7.7.1. Middle East & Africa Market estimates and forecast, 2018 - 2030 (Kilotons) (USD Million)
                        7.7.2. Middle East & Africa Market estimates and forecast, by Raw Material, 2018 - 2030 (Kilotons) (USD Million)
                        7.7.3. Middle East & Africa Market estimates and forecast, by application, 2018 - 2030 (Kilotons) (USD Million)
                        7.7.4. Middle East & Africa Market estimates and forecast, by end-use, 2018 - 2030 (Kilotons) (USD Million)
                        7.7.5. Saudi Arabia
                            7.7.5.1. Saudi Arabia Market estimates and forecast, 2018 - 2030 (Kilotons) (USD Million)
                            7.7.5.2. Saudi Arabia Market estimates and forecast, by Raw Material, 2018 - 2030 (Kilotons) (USD Million)
                            7.7.5.3. Saudi Arabia Market estimates and forecast, by application, 2018 - 2030 (Kilotons) (USD Million)
                            7.7.5.4. Saudi Arabia Market estimates and forecast, by end-use, 2018 - 2030 (Kilotons) (USD Million)
                        7.7.6. United Arab Emirates (UAE)
                            7.7.6.1. United Arab Emirates (UAE) Market estimates and forecast, 2018 - 2030 (Kilotons) (USD Million)
                            7.7.6.2. United Arab Emirates (UAE) Market estimates and forecast, by Raw Material, 2018 - 2030 (Kilotons) (USD Million)
                            7.7.6.3. United Arab Emirates (UAE) Market estimates and forecast, by application, 2018 - 2030 (Kilotons) (USD Million)
                            7.7.6.4. United Arab Emirates (UAE) Market estimates and forecast, by end-use, 2018 - 2030 (Kilotons) (USD Million)
                        7.7.7. South Africa
                            7.7.7.1. South Africa Market estimates and forecast, 2018 - 2030 (Kilotons) (USD Million)
                            7.7.7.2. South Africa Market estimates and forecast, by Raw Material, 2018 - 2030 (Kilotons) (USD Million)
                            7.7.7.3. South Africa Market estimates and forecast, by application, 2018 - 2030 (Kilotons) (USD Million)
                            7.7.7.4. South Africa Market estimates and forecast, by end-use, 2018 - 2030 (Kilotons) (USD Million)
Chapter 8. Competitive Landscape
                    8.1. Recent Developments & Impact Analysis, By Key Market Participants
                    8.2. Company Categorization
                    8.3. Company Market Share/Position Analysis, 2023
                    8.4. Company Heat Map Analysis
                    8.5. Strategy Mapping
                        8.5.1. Expansion
                        8.5.2. Mergers & Acquisition
                        8.5.3. Partnerships & Collaborations
                        8.5.4. New Application Launches
                        8.5.5. Research And Development
                    8.6. Company Profiles
                        8.6.1. TotalEnergies Corbion bv
                            8.6.1.1. Participant’s overview
                            8.6.1.2. Financial performance
                            8.6.1.3. Application benchmarking
                            8.6.1.4. Recent developments
                        8.6.2. NatureWork LLC
                            8.6.2.1. Participant’s overview
                            8.6.2.2. Financial performance
                            8.6.2.3. Application benchmarking
                            8.6.2.4. Recent developments
                        8.6.3. JIANGSU SUPLA BIOPLASTICS CO., LTD.
                            8.6.3.1. Participant’s overview
                            8.6.3.2. Financial performance
                            8.6.3.3. Application benchmarking
                            8.6.3.4. Recent developments
                        8.6.4. Futerro
                            8.6.4.1. Participant’s overview
                            8.6.4.2. Financial performance
                            8.6.4.3. Application benchmarking
                            8.6.4.4. Recent developments
                        8.6.5. COFCO
                            8.6.5.1. Participant’s overview
                            8.6.5.2. Financial performance
                            8.6.5.3. Application benchmarking
                            8.6.5.4. Recent developments
                        8.6.6. Jiangxi Keyuan Biopharm Co.,Ltd.
                            8.6.6.1. Participant’s overview
                            8.6.6.2. Financial performance
                            8.6.6.3. Application benchmarking
                            8.6.6.4. Recent developments
                        8.6.7. Shanghai Tong-jie-liang Biomaterials Co.,LTD.
                            8.6.7.1. Participant’s overview
                            8.6.7.2. Financial performance
                            8.6.7.3. Application benchmarking
                            8.6.7.4. Recent developments
                        8.6.8. Zhejiang Hisun Biomaterials Co., Ltd.
                            8.6.8.1. Participant’s overview
                            8.6.8.2. Financial performance
                            8.6.8.3. Application benchmarking
                            8.6.8.4. Recent developments
                        8.6.9. BASF SE
                            8.6.9.1. Participant’s overview
                            8.6.9.2. Financial performance
                            8.6.9.3. Application benchmarking
                            8.6.9.4. Recent developments
                        8.6.10. Danimer Scientific
                            8.6.10.1. Participant’s overview
                            8.6.10.2. Financial performance
                            8.6.10.3. Application benchmarking
                            8.6.10.4. Recent developments
                        8.6.11. Danimer Scientific
                            8.6.11.1. Participant’s overview
                            8.6.11.2. Financial performance
                            8.6.11.3. Application benchmarking
                            8.6.11.4. Recent developments
                        8.6.12. UNITIKA LTD
                            8.6.12.1. Participant’s overview
                            8.6.12.2. Financial performance
                            8.6.12.3. Application benchmarking
                            8.6.12.4. Recent developments


List of Tables

Table 1 Polylactic Acid Market estimates and forecasts, 2018 - 2030 (Kilotons) (USD Million)
Table 2 Polylactic Acid Market estimates and forecasts, by corn starch, 2018 - 2030 (Kilotons) (USD Million)
Table 3 Polylactic Acid Market estimates and forecasts, by sugarcane, 2018 - 2030 (Kilotons) (USD Million)
Table 4 Polylactic Acid Market estimates and forecasts, by cassava, 2018 - 2030 (Kilotons) (USD Million)
Table 5 Polylactic Acid Market estimates and forecasts, by others, 2018 - 2030 (Kilotons) (USD Million)
Table 6 Polylactic Acid Market estimates and forecasts, by rigid thermoform, 2018 - 2030 (Kilotons) (USD Million)
Table 7 Polylactic Acid Market estimates and forecasts, by films & sheets, 2018 - 2030 (Kilotons) (USD Million)
Table 8 Polylactic Acid Market estimates and forecasts, in bottles, 2018 - 2030 (Kilotons) (USD Million)
Table 9 Polylactic Acid Market estimates and forecasts, in others, 2018 - 2030 (Kilotons) (USD Million)
Table 10 Polylactic Acid Market estimates and forecasts, in packaging, 2018 - 2030 (Kilotons) (USD Million)
Table 11 Polylactic Acid Market estimates and forecasts, in agriculture, 2018 - 2030 (Kilotons) (USD Million)
Table 12 Polylactic Acid Market estimates and forecasts, in automotive & transportation, 2018 - 2030 (Kilotons) (USD Million)
Table 13 Polylactic Acid Market estimates and forecasts, in electronics, 2018 - 2030 (Kilotons) (USD Million)
Table 14 Polylactic Acid Market estimates and forecasts, in textile, 2018 - 2030 (Kilotons) (USD Million)
Table 15 Polylactic Acid Market estimates and forecasts, in consumer goods, 2018 - 2030 (Kilotons) (USD Million)
Table 16 Polylactic Acid Market estimates and forecasts, in bio-medical, 2018 - 2030 (Kilotons) (USD Million)
Table 17 Polylactic Acid Market estimates and forecasts, in others, 2018 - 2030 (Kilotons) (USD Million)
Table 18 North America Polylactic Acid Market estimates and forecasts, 2018 - 2030 (Kilotons) (USD Million)
Table 19 North America Polylactic Acid Market estimates and forecasts, by Raw Material, 2018 - 2030 (Kilotons) (USD Million)
Table 20 North America Polylactic Acid Market estimates and forecasts, by application, 2018 - 2030 (Kilotons) (USD Million)
Table 21 North America Polylactic Acid Market estimates and forecasts, by end-use, 2018 - 2030 (Kilotons) (USD Million)
Table 22 U.S. Polylactic Acid Market estimates and forecasts, 2018 - 2030 (Kilotons) (USD Million)
Table 23 U.S. Polylactic Acid Market estimates and forecasts, by Raw Material, 2018 - 2030 (Kilotons) (USD Million)
Table 24 U.S. Polylactic Acid Market estimates and forecasts, by application, 2018 - 2030 (Kilotons) (USD Million)
Table 25 U.S. Polylactic Acid Market estimates and forecasts, by end-use, 2018 - 2030 (Kilotons) (USD Million)
Table 26 Canada Polylactic Acid Market estimates and forecasts, 2018 - 2030 (Kilotons) (USD Million)
Table 27 Canada Polylactic Acid Market estimates and forecasts, by Raw Material, 2018 - 2030 (Kilotons) (USD Million)
Table 28 Canada Polylactic Acid Market estimates and forecasts, by application, 2018 - 2030 (Kilotons) (USD Million)
Table 29 Canada Polylactic Acid Market estimates and forecasts, by end-use, 2018 - 2030 (Kilotons) (USD Million)
Table 30 Mexico Polylactic Acid Market estimates and forecasts, 2018 - 2030 (Kilotons) (USD Million)
Table 31 Mexico Polylactic Acid Market estimates and forecasts, by Raw Material, 2018 - 2030 (Kilotons) (USD Million)
Table 32 Mexico Polylactic Acid Market estimates and forecasts, by application, 2018 - 2030 (Kilotons) (USD Million)
Table 33 Mexico Polylactic Acid Market estimates and forecasts, by end-use, 2018 - 2030 (Kilotons) (USD Million)
Table 34 Europe Polylactic Acid Market estimates and forecasts, 2018 - 2030 (Kilotons) (USD Million)
Table 35 Europe Polylactic Acid Market estimates and forecasts, by Raw Material, 2018 - 2030 (Kilotons) (USD Million)
Table 36 Europe Polylactic Acid Market estimates and forecasts, by application, 2018 - 2030 (Kilotons) (USD Million)
Table 37 Europe Polylactic Acid Market estimates and forecasts, by end-use, 2018 - 2030 (Kilotons) (USD Million)
Table 38 Germany Polylactic Acid Market estimates and forecasts, 2018 - 2030 (Kilotons) (USD Million)
Table 39 Germany Polylactic Acid Market estimates and forecasts, by Raw Material, 2018 - 2030 (Kilotons) (USD Million)
Table 40 Germany Polylactic Acid Market estimates and forecasts, by application, 2018 - 2030 (Kilotons) (USD Million)
Table 41 Germany Polylactic Acid Market estimates and forecasts, by end-use, 2018 - 2030 (Kilotons) (USD Million)
Table 42 UK Polylactic Acid Market estimates and forecasts, 2018 - 2030 (Kilotons) (USD Million)
Table 43 UK Polylactic Acid Market estimates and forecasts, by Raw Material, 2018 - 2030 (Kilotons) (USD Million)
Table 44 UK Polylactic Acid Market estimates and forecasts, by application, 2018 - 2030 (Kilotons) (USD Million)
Table 45 UK Polylactic Acid Market estimates and forecasts, by end-use, 2018 - 2030 (Kilotons) (USD Million)
Table 46 France Polylactic Acid Market estimates and forecasts, 2018 - 2030 (Kilotons) (USD Million)
Table 47 France Polylactic Acid Market estimates and forecasts, by Raw Material, 2018 - 2030 (Kilotons) (USD Million)
Table 48 France Polylactic Acid Market estimates and forecasts, by application, 2018 - 2030 (Kilotons) (USD Million)
Table 49 France Polylactic Acid Market estimates and forecasts, by end-use, 2018 - 2030 (Kilotons) (USD Million)
Table 50 Italy Polylactic Acid Market estimates and forecasts, 2018 - 2030 (Kilotons) (USD Million)
Table 51 Italy Polylactic Acid Market estimates and forecasts, by Raw Material, 2018 - 2030 (Kilotons) (USD Million)
Table 52 Italy Polylactic Acid Market estimates and forecasts, by application, 2018 - 2030 (Kilotons) (USD Million)
Table 53 Italy Polylactic Acid Market estimates and forecasts, by end-use, 2018 - 2030 (Kilotons) (USD Million)
Table 54 Spain Polylactic Acid Market estimates and forecasts, 2018 - 2030 (Kilotons) (USD Million)
Table 55 Spain Polylactic Acid Market estimates and forecasts, by Raw Material, 2018 - 2030 (Kilotons) (USD Million)
Table 56 Spain Polylactic Acid Market estimates and forecasts, by application, 2018 - 2030 (Kilotons) (USD Million)
Table 57 Spain Polylactic Acid Market estimates and forecasts, by end-use, 2018 - 2030 (Kilotons) (USD Million)
Table 58 Netherlands Polylactic Acid Market estimates and forecasts, 2018 - 2030 (Kilotons) (USD Million)
Table 59 Netherlands Polylactic Acid Market estimates and forecasts, by Raw Material, 2018 - 2030 (Kilotons) (USD Million)
Table 60 Netherlands Polylactic Acid Market estimates and forecasts, by application, 2018 - 2030 (Kilotons) (USD Million)
Table 61 Netherlands Polylactic Acid Market estimates and forecasts, by end-use, 2018 - 2030 (Kilotons) (USD Million)
Table 62 Asia Pacific Polylactic Acid Market estimates and forecasts, 2018 - 2030 (Kilotons) (USD Million)
Table 63 Asia Pacific Polylactic Acid Market estimates and forecasts, by Raw Material, 2018 - 2030 (Kilotons) (USD Million)
Table 64 Asia Pacific Polylactic Acid Market estimates and forecasts, by application, 2018 - 2030 (Kilotons) (USD Million)
Table 65 Asia Pacific Polylactic Acid Market estimates and forecasts, by end-use, 2018 - 2030 (Kilotons) (USD Million)
Table 66 China Polylactic Acid Market estimates and forecasts, 2018 - 2030 (Kilotons) (USD Million)
Table 67 China Polylactic Acid Market estimates and forecasts, by Raw Material, 2018 - 2030 (Kilotons) (USD Million)
Table 68 China Polylactic Acid Market estimates and forecasts, by application, 2018 - 2030 (Kilotons) (USD Million)
Table 69 China Polylactic Acid Market estimates and forecasts, by end-use, 2018 - 2030 (Kilotons) (USD Million)
Table 70 India Polylactic Acid Market estimates and forecasts, 2018 - 2030 (Kilotons) (USD Million)
Table 71 India Polylactic Acid Market estimates and forecasts, by Raw Material, 2018 - 2030 (Kilotons) (USD Million)
Table 72 India Polylactic Acid Market estimates and forecasts, by application, 2018 - 2030 (Kilotons) (USD Million)
Table 73 India Polylactic Acid Market estimates and forecasts, by end-use, 2018 - 2030 (Kilotons) (USD Million)
Table 74 Japan Polylactic Acid Market estimates and forecasts, 2018 - 2030 (Kilotons) (USD Million)
Table 75 Japan Polylactic Acid Market estimates and forecasts, by Raw Material, 2018 - 2030 (Kilotons) (USD Million)
Table 76 Japan Polylactic Acid Market estimates and forecasts, by application, 2018 - 2030 (Kilotons) (USD Million)
Table 77 Japan Polylactic Acid Market estimates and forecasts, by end-use, 2018 - 2030 (Kilotons) (USD Million)
Table 78 South Korea Polylactic Acid Market estimates and forecasts, 2018 - 2030 (Kilotons) (USD Million)
Table 79 South Korea Polylactic Acid Market estimates and forecasts, by Raw Material, 2018 - 2030 (Kilotons) (USD Million)
Table 80 South Korea Polylactic Acid Market estimates and forecasts, by application, 2018 - 2030 (Kilotons) (USD Million)
Table 81 South Korea Polylactic Acid Market estimates and forecasts, by end-use, 2018 - 2030 (Kilotons) (USD Million)
Table 82 Singapore Polylactic Acid Market estimates and forecasts, 2018 - 2030 (Kilotons) (USD Million)
Table 83 Singapore Polylactic Acid Market estimates and forecasts, by Raw Material, 2018 - 2030 (Kilotons) (USD Million)
Table 84 Singapore Polylactic Acid Market estimates and forecasts, by application, 2018 - 2030 (Kilotons) (USD Million)
Table 85 Singapore Polylactic Acid Market estimates and forecasts, by end-use, 2018 - 2030 (Kilotons) (USD Million)
Table 86 Malaysia Polylactic Acid Market estimates and forecasts, 2018 - 2030 (Kilotons) (USD Million)
Table 87 Malaysia Polylactic Acid Market estimates and forecasts, by Raw Material, 2018 - 2030 (Kilotons) (USD Million)
Table 88 Malaysia Polylactic Acid Market estimates and forecasts, by application, 2018 - 2030 (Kilotons) (USD Million)
Table 89 Malaysia Polylactic Acid Market estimates and forecasts, by end-use, 2018 - 2030 (Kilotons) (USD Million)
Table 90 Thailand Polylactic Acid Market estimates and forecasts, 2018 - 2030 (Kilotons) (USD Million)
Table 91 Thailand Polylactic Acid Market estimates and forecasts, by Raw Material, 2018 - 2030 (Kilotons) (USD Million)
Table 92 Thailand Polylactic Acid Market estimates and forecasts, by application, 2018 - 2030 (Kilotons) (USD Million)
Table 93 Thailand Polylactic Acid Market estimates and forecasts, by end-use, 2018 - 2030 (Kilotons) (USD Million)
Table 94 Vietnam Polylactic Acid Market estimates and forecasts, 2018 - 2030 (Kilotons) (USD Million)
Table 95 Vietnam Polylactic Acid Market estimates and forecasts, by Raw Material, 2018 - 2030 (Kilotons) (USD Million)
Table 96 Vietnam Polylactic Acid Market estimates and forecasts, by application, 2018 - 2030 (Kilotons) (USD Million)
Table 97 Vietnam Polylactic Acid Market estimates and forecasts, by end-use, 2018 - 2030 (Kilotons) (USD Million)
Table 98 Indonesia Polylactic Acid Market estimates and forecasts, 2018 - 2030 (Kilotons) (USD Million)
Table 99 Indonesia Polylactic Acid Market estimates and forecasts, by Raw Material, 2018 - 2030 (Kilotons) (USD Million)
Table 100 Indonesia Polylactic Acid Market estimates and forecasts, by application, 2018 - 2030 (Kilotons) (USD Million)
Table 101 Indonesia Polylactic Acid Market estimates and forecasts, by end-use, 2018 - 2030 (Kilotons) (USD Million)
Table 102 Philippines Polylactic Acid Market estimates and forecasts, 2018 - 2030 (Kilotons) (USD Million)
Table 103 Philippines Polylactic Acid Market estimates and forecasts, by Raw Material, 2018 - 2030 (Kilotons) (USD Million)
Table 104 Philippines Polylactic Acid Market estimates and forecasts, by application, 2018 - 2030 (Kilotons) (USD Million)
Table 105 Philippines Polylactic Acid Market estimates and forecasts, by end-use, 2018 - 2030 (Kilotons) (USD Million)
Table 106 Australia Polylactic Acid Market estimates and forecasts, 2018 - 2030 (Kilotons) (USD Million)
Table 107 Australia Polylactic Acid Market estimates and forecasts, by Raw Material, 2018 - 2030 (Kilotons) (USD Million)
Table 108 Australia Polylactic Acid Market estimates and forecasts, by application, 2018 - 2030 (Kilotons) (USD Million)
Table 109 Australia Polylactic Acid Market estimates and forecasts, by end-use, 2018 - 2030 (Kilotons) (USD Million)
Table 110 Central & South America Polylactic Acid Market estimates and forecasts, 2018 - 2030 (Kilotons) (USD Million)
Table 111 Central & South America Polylactic Acid Market estimates and forecasts, by Raw Material, 2018 - 2030 (Kilotons) (USD Million)
Table 112 Central & South America Polylactic Acid Market estimates and forecasts, by application, 2018 - 2030 (Kilotons) (USD Million)
Table 113 Central & South America Polylactic Acid Market estimates and forecasts, by end-use, 2018 - 2030 (Kilotons) (USD Million)
Table 114 Brazil Polylactic Acid Market estimates and forecasts, 2018 - 2030 (Kilotons) (USD Million)
Table 115 Brazil Polylactic Acid Market estimates and forecasts, by Raw Material, 2018 - 2030 (Kilotons) (USD Million)
Table 116 Brazil Polylactic Acid Market estimates and forecasts, by application, 2018 - 2030 (Kilotons) (USD Million)
Table 117 Brazil Polylactic Acid Market estimates and forecasts, by end-use, 2018 - 2030 (Kilotons) (USD Million)
Table 118 Argentina Polylactic Acid Market estimates and forecasts, 2018 - 2030 (Kilotons) (USD Million)
Table 119 Argentina Polylactic Acid Market estimates and forecasts, by Raw Material, 2018 - 2030 (Kilotons) (USD Million)
Table 120 Argentina Polylactic Acid Market estimates and forecasts, by application, 2018 - 2030 (Kilotons) (USD Million)
Table 121 Argentina Polylactic Acid Market estimates and forecasts, by end-use, 2018 - 2030 (Kilotons) (USD Million)
Table 122 Middle East & Africa Polylactic Acid Market estimates and forecasts, 2018 - 2030 (Kilotons) (USD Million)
Table 123 Middle East & Africa Polylactic Acid Market estimates and forecasts, by Raw Material, 2018 - 2030 (Kilotons) (USD Million)
Table 124 Middle East & Africa Polylactic Acid Market estimates and forecasts, by application, 2018 - 2030 (Kilotons) (USD Million)
Table 125 Middle East & Africa Polylactic Acid Market estimates and forecasts, by end-use, 2018 - 2030 (Kilotons) (USD Million)
Table 126 Saudi Arabia Polylactic Acid Market estimates and forecasts, 2018 - 2030 (Kilotons) (USD Million)
Table 127 Saudi Arabia Polylactic Acid Market estimates and forecasts, by Raw Material, 2018 - 2030 (Kilotons) (USD Million)
Table 128 Saudi Arabia Polylactic Acid Market estimates and forecasts, by application, 2018 - 2030 (Kilotons) (USD Million)
Table 129 Saudi Arabia Polylactic Acid Market estimates and forecasts, by end-use, 2018 - 2030 (Kilotons) (USD Million)
Table 130 United Arab Emirates (UAE) Polylactic Acid Market estimates and forecasts, 2018 - 2030 (Kilotons) (USD Million)
Table 131 United Arab Emirates (UAE) Polylactic Acid Market estimates and forecasts, by Raw Material, 2018 - 2030 (Kilotons) (USD Million)
Table 132 United Arab Emirates (UAE) Polylactic Acid Market estimates and forecasts, by application, 2018 - 2030 (Kilotons) (USD Million)
Table 133 United Arab Emirates (UAE) Polylactic Acid Market estimates and forecasts, by end-use, 2018 - 2030 (Kilotons) (USD Million)
Table 134 South Africa Polylactic Acid Market estimates and forecasts, 2018 - 2030 (Kilotons) (USD Million)
Table 135 Argentina Polylactic Acid Market estimates and forecasts, by Raw Material, 2018 - 2030 (Kilotons) (USD Million)
Table 136 South Africa Polylactic Acid Market estimates and forecasts, by application, 2018 - 2030 (Kilotons) (USD Million)
Table 137 South Africa Polylactic Acid Market estimates and forecasts, by end-use, 2018 - 2030 (Kilotons) (USD Million)


List of Figures

Fig. 1 Market segmentation
Fig. 2 Information procurement
Fig. 3 Data Analysis Models
Fig. 4 Market Formulation and Validation
Fig. 5 Market snapshot, 2023 (USD Million)
Fig. 6 Segmental outlook- Raw Material, application, and application (2023, USD Million)
Fig. 7 Competitive outlook
Fig. 8 Polylactic Acid Market, 2018 - 2030 (Kilotons) (USD Million)
Fig. 9 Value chain analysis
Fig. 10 Market dynamics
Fig. 11 Porter’s Analysis
Fig. 12 PESTEL Analysis
Fig. 13 Polylactic Acid Market, by Raw Material: Key takeaways
Fig. 14 Polylactic Acid Market, by Raw Material: Market share, 2023 & 2030
Fig. 15 Polylactic Acid Market, by application: Key takeaways
Fig. 16 Polylactic Acid Market, by application: Market share, 2023 & 2030
Fig. 17 Polylactic Acid Market, by end-use: Key takeaways
Fig. 18 Polylactic Acid Market, by end-use: Market share, 2023 & 2030
Fig. 19 Polylactic Acid Market, by region: Key takeaways
Fig. 20 Polylactic Acid Market, by region: Market share, 2023 & 2030

What questions do you have? Get quick response from our industry experts. Request a Free Consultation

Market Segmentation

  • Polylactic Acid Raw Material Outlook (Volume, Kilotons; Revenue, USD Million, 2018 - 2030)
    • Corn starch
    • Sugarcane
    • Cassava
    • Others
  • Polylactic Acid Application Outlook (Volume, Kilotons; Revenue, USD Million, 2018 - 2030)
    • Rigid thermoform
    • Films & sheets
    • Bottles
    • Others
  • Polylactic Acid End-use Outlook (Volume, Kilotons; Revenue, USD Million, 2018 - 2030)
    • Packaging
    • Agriculture
    • Automotive & transport
    • Electronics
    • Textile
    • Consumer goods
    • Bio-medical
    • Others
  • Polylactic Acid Regional Outlook (Volume, Kilotons; Revenue, USD Million, 2018 - 2030)
    • North America
      • North America Polylactic Acid Market, By Raw Material
        • Corn starch
        • Sugarcane
        • Cassava
        • Others
      • North America Polylactic Acid Market, By Application
        • Rigid thermoforms
        • Films & sheets
        • Bottles
        • Others
      • North America Polylactic Acid Market, By End-use
        • Packaging
        • Agriculture
        • Automotive & transport
        • Electronics
        • Textile
        • Consumer goods
        • Bio-medical
        • Others
      • U.S.
        • U.S. Polylactic Acid Market, By Raw Material
          • Corn starch
          • Sugarcane
          • Cassava
          • Others
        • U.S. Polylactic Acid Market, By Application
          • Rigid thermoforms
          • Films & sheets
          • Bottles
          • Others
        • U.S. Polylactic Acid Market, By End-use
          • Packaging
          • Agriculture
          • Automotive & transport
          • Electronics
          • Textile
          • Consumer goods
          • Bio-medical
          • Others
      • Canada
        • Canada Polylactic Acid Market, By Raw Material
          • Corn starch
          • Sugarcane
          • Cassava
          • Others
        • Canada Polylactic Acid Market, By Application
          • Rigid thermoforms
          • Films & sheets
          • Bottles
          • Others
        • Canada Polylactic Acid Market, By End-use
          • Packaging
          • Agriculture
          • Automotive & transport
          • Electronics
          • Textile
          • Consumer goods
          • Bio-medical
          • Others
      • Mexico
        • Mexico Polylactic Acid Market, By Raw Material
          • Corn starch
          • Sugarcane
          • Cassava
          • Others
        • Mexico Polylactic Acid Market, By Application
          • Rigid thermoforms
          • Films & sheets
          • Bottles
          • Others
        • Mexico Polylactic Acid Market, By End-use
          • Packaging
          • Agriculture
          • Automotive & transport
          • Electronics
          • Textile
          • Consumer goods
          • Bio-medical
          • Others
    • Europe
      • Europe Polylactic Acid Market, By Raw Material
        • Corn starch
        • Sugarcane
        • Cassava
        • Others
      • Europe Polylactic Acid Market, By Application
        • Rigid thermoforms
        • Films & sheets
        • Bottles
        • Others
      • Europe Polylactic Acid Market, By End-use
        • Packaging
        • Agriculture
        • Automotive & transport
        • Electronics
        • Textile
        • Consumer goods
        • Bio-medical
        • Others
      • UK
        • UK Polylactic Acid Market, By Raw Material
          • Corn starch
          • Sugarcane
          • Cassava
          • Others
        • UK Polylactic Acid Market, By Application
          • Rigid thermoforms
          • Films & sheets
          • Bottles
          • Others
        • UK Polylactic Acid Market, By End-use
          • Packaging
          • Agriculture
          • Automotive & transport
          • Electronics
          • Textile
          • Consumer goods
          • Bio-medical
          • Others
      • Germany
        • Germany Polylactic Acid Market, By Raw Material
          • Corn starch
          • Sugarcane
          • Cassava
          • Others
        • Germany Polylactic Acid Market, By Application
          • Rigid thermoforms
          • Films & sheets
          • Bottles
          • Others
        • Germany Polylactic Acid Market, By End-use
          • Packaging
          • Agriculture
          • Automotive & transport
          • Electronics
          • Textile
          • Consumer goods
          • Bio-medical
          • Others
      • France
        • France Polylactic Acid Market, By Raw Material
          • Corn starch
          • Sugarcane
          • Cassava
          • Others
        • France Polylactic Acid Market, By Application
          • Rigid thermoforms
          • Films & sheets
          • Bottles
          • Others
        • France Polylactic Acid Market, By End-use
          • Packaging
          • Agriculture
          • Automotive & transport
          • Electronics
          • Textile
          • Consumer goods
          • Bio-medical
          • Others
      • Italy
        • Italy Polylactic Acid Market, By Raw Material
          • Corn starch
          • Sugarcane
          • Cassava
          • Others
        • Italy Polylactic Acid Market, By Application
          • Rigid thermoforms
          • Films & sheets
          • Bottles
          • Others
        • Italy Polylactic Acid Market, By End-use
          • Packaging
          • Agriculture
          • Automotive & transport
          • Electronics
          • Textile
          • Consumer goods
          • Bio-medical
          • Others
      • Spain
        • Spain Polylactic Acid Market, By Raw Material
          • Corn starch
          • Sugarcane
          • Cassava
          • Others
        • Spain Polylactic Acid Market, By Application
          • Rigid thermoforms
          • Films & sheets
          • Bottles
          • Others
        • Spain Polylactic Acid Market, By End-use
          • Packaging
          • Agriculture
          • Automotive & transport
          • Electronics
          • Textile
          • Consumer goods
          • Bio-medical
          • Others
      • Netherlands
        • Netherlands Polylactic Acid Market, By Raw Material
          • Corn starch
          • Sugarcane
          • Cassava
          • Others
        • Netherlands Polylactic Acid Market, By Application
          • Rigid thermoforms
          • Films & sheets
          • Bottles
          • Others
        • Netherlands Polylactic Acid Market, By End-use
          • Packaging
          • Agriculture
          • Automotive & transport
          • Electronics
          • Textile
          • Consumer goods
          • Bio-medical
          • Others
      • Turkey
        • Turkey Polylactic Acid Market, By Raw Material
          • Corn starch
          • Sugarcane
          • Cassava
          • Others
        • Turkey Polylactic Acid Market, By Application
          • Rigid thermoforms
          • Films & sheets
          • Bottles
          • Others
        • Turkey Polylactic Acid Market, By End-use
          • Packaging
          • Agriculture
          • Automotive & transport
          • Electronics
          • Textile
          • Consumer goods
          • Bio-medical
          • Others
    • Asia Pacific
      • Asia Pacific Polylactic Acid Market, By Raw Material
        • Corn starch
        • Sugarcane
        • Cassava
        • Others
      • Asia Pacific Polylactic Acid Market, By Application
        • Rigid thermoforms
        • Films & sheets
        • Bottles
        • Others
      • Asia Pacific Polylactic Acid Market, By End-use
        • Packaging
        • Agriculture
        • Automotive & transport
        • Electronics
        • Textile
        • Consumer goods
        • Bio-medical
        • Others
      • China
        • China Polylactic Acid Market, By Raw Material
          • Corn starch
          • Sugarcane
          • Cassava
          • Others
        • China Polylactic Acid Market, By Application
          • Rigid thermoforms
          • Films & sheets
          • Bottles
          • Others
        • China Polylactic Acid Market, By End-use
          • Packaging
          • Agriculture
          • Automotive & transport
          • Electronics
          • Textile
          • Consumer goods
          • Bio-medical
          • Others
      • India
        • India Polylactic Acid Market, By Raw Material
          • Corn starch
          • Sugarcane
          • Cassava
          • Others
        • India Polylactic Acid Market, By Application
          • Rigid thermoforms
          • Films & sheets
          • Bottles
          • Others
        • India Polylactic Acid Market, By End-use
          • Packaging
          • Agriculture
          • Automotive & transport
          • Electronics
          • Textile
          • Consumer goods
          • Bio-medical
          • Others
      • Japan
        • Japan Polylactic Acid Market, By Raw Material
          • Corn starch
          • Sugarcane
          • Cassava
          • Others
        • Japan Polylactic Acid Market, By Application
          • Rigid thermoforms
          • Films & sheets
          • Bottles
          • Others
        • Japan Polylactic Acid Market, By End-use
          • Packaging
          • Agriculture
          • Automotive & transport
          • Electronics
          • Textile
          • Consumer goods
          • Bio-medical
          • Others
      • South Korea
        • South Korea Polylactic Acid Market, By Raw Material
          • Corn starch
          • Sugarcane
          • Cassava
          • Others
        • South Korea Polylactic Acid Market, By Application
          • Rigid thermoforms
          • Films & sheets
          • Bottles
          • Others
        • South Korea Polylactic Acid Market, By End-use
          • Packaging
          • Agriculture
          • Automotive & transport
          • Electronics
          • Textile
          • Consumer goods
          • Bio-medical
          • Others
      • Singapore
        • Singapore Polylactic Acid Market, By Raw Material
          • Corn starch
          • Sugarcane
          • Cassava
          • Others
        • Singapore Polylactic Acid Market, By Application
          • Rigid thermoforms
          • Films & sheets
          • Bottles
          • Others
        • Singapore Polylactic Acid Market, By End-use
          • Packaging
          • Agriculture
          • Automotive & transport
          • Electronics
          • Textile
          • Consumer goods
          • Bio-medical
          • Others
      • Malaysia
        • Malaysia Polylactic Acid Market, By Raw Material
          • Corn starch
          • Sugarcane
          • Cassava
          • Others
        • Malaysia Polylactic Acid Market, By Application
          • Rigid thermoforms
          • Films & sheets
          • Bottles
          • Others
        • Malaysia Polylactic Acid Market, By End-use
          • Packaging
          • Agriculture
          • Automotive & transport
          • Electronics
          • Textile
          • Consumer goods
          • Bio-medical
          • Others
      • Indonesia
        • Indonesia Polylactic Acid Market, By Raw Material
          • Corn starch
          • Sugarcane
          • Cassava
          • Others
        • Indonesia Polylactic Acid Market, By Application
          • Rigid thermoforms
          • Films & sheets
          • Bottles
          • Others
        • Indonesia Polylactic Acid Market, By End-use
          • Packaging
          • Agriculture
          • Automotive & transport
          • Electronics
          • Textile
          • Consumer goods
          • Bio-medical
          • Others
      • Philippines
        • Philippines Polylactic Acid Market, By Raw Material
          • Corn starch
          • Sugarcane
          • Cassava
          • Others
        • Philippines Polylactic Acid Market, By Application
          • Rigid thermoforms
          • Films & sheets
          • Bottles
          • Others
        • Philippines Polylactic Acid Market, By End-use
          • Packaging
          • Agriculture
          • Automotive & transport
          • Electronics
          • Textile
          • Consumer goods
          • Bio-medical
          • Others
      • Thailand
        • Thailand Polylactic Acid Market, By Raw Material
          • Corn starch
          • Sugarcane
          • Cassava
          • Others
        • Thailand Polylactic Acid Market, By Application
          • Rigid thermoforms
          • Films & sheets
          • Bottles
          • Others
        • Thailand Polylactic Acid Market, By End-use
          • Packaging
          • Agriculture
          • Automotive & transport
          • Electronics
          • Textile
          • Consumer goods
          • Bio-medical
          • Others
      • Vietnam
        • Vietnam Polylactic Acid Market, By Raw Material
          • Corn starch
          • Sugarcane
          • Cassava
          • Others
        • Vietnam Polylactic Acid Market, By Application
          • Rigid thermoforms
          • Films & sheets
          • Bottles
          • Others
        • Vietnam Polylactic Acid Market, By End-use
          • Packaging
          • Agriculture
          • Automotive & transport
          • Electronics
          • Textile
          • Consumer goods
          • Bio-medical
          • Others
      • Australia
        • Australia Polylactic Acid Market, By Raw Material
          • Corn starch
          • Sugarcane
          • Cassava
          • Others
        • Australia Polylactic Acid Market, By Application
          • Rigid thermoforms
          • Films & sheets
          • Bottles
          • Others
        • Australia Polylactic Acid Market, By End-use
          • Packaging
          • Agriculture
          • Automotive & transport
          • Electronics
          • Textile
          • Consumer goods
          • Bio-medical
          • Others
    • Central & South America
      • Central & South America Polylactic Acid Market, By Raw Material
        • Corn starch
        • Sugarcane
        • Cassava
        • Others
      • Central & South America Polylactic Acid Market, By Application
        • Rigid thermoforms
        • Films & sheets
        • Bottles
        • Others
      • Central & South America Polylactic Acid Market, By End-use
        • Packaging
        • Agriculture
        • Automotive & transport
        • Electronics
        • Textile
        • Consumer goods
        • Bio-medical
        • Others
      • Brazil
        • Brazil Polylactic Acid Market, By Raw Material
          • Corn starch
          • Sugarcane
          • Cassava
          • Others
        • Brazil Polylactic Acid Market, By Application
          • Rigid thermoforms
          • Films & sheets
          • Bottles
          • Others
        • Brazil Polylactic Acid Market, By End-use
          • Packaging
          • Agriculture
          • Automotive & transport
          • Electronics
          • Textile
          • Consumer goods
          • Bio-medical
          • Others
      • Argentina
        • Argentina Polylactic Acid Market, By Raw Material
          • Corn starch
          • Sugarcane
          • Cassava
          • Others
        • Argentina Polylactic Acid Market, By Application
          • Rigid thermoforms
          • Films & sheets
          • Bottles
          • Others
        • Argentina Polylactic Acid Market, By End-use
          • Packaging
          • Agriculture
          • Automotive & transport
          • Electronics
          • Textile
          • Consumer goods
          • Bio-medical
          • Others
    • Middle East and Africa
      • Middle East and Africa Polylactic Acid Market, By Raw Material
        • Corn starch
        • Sugarcane
        • Cassava
        • Others
      • Middle East and Africa Polylactic Acid Market, By Application
        • Rigid thermoforms
        • Films & sheets
        • Bottles
        • Others
      • Middle East and Africa Polylactic Acid Market, By End-use
        • Packaging
        • Agriculture
        • Automotive & transport
        • Electronics
        • Textile
        • Consumer goods
        • Bio-medical
        • Others
      • Saudi Arabia
        • Saudi Arabia Polylactic Acid Market, By Raw Material
          • Corn starch
          • Sugarcane
          • Cassava
          • Others
        • Saudi Arabia Polylactic Acid Market, By Application
          • Rigid thermoforms
          • Films & sheets
          • Bottles
          • Others
        • Saudi Arabia Polylactic Acid Market, By End-use
          • Packaging
          • Agriculture
          • Automotive & transport
          • Electronics
          • Textile
          • Consumer goods
          • Bio-medical
          • Others
      • United Arab Emirates (UAE)
        • United Arab Emirates (UAE) Polylactic Acid Market, By Raw Material
          • Corn starch
          • Sugarcane
          • Cassava
          • Others
        • United Arab Emirates (UAE) Polylactic Acid Market, By Application
          • Rigid thermoforms
          • Films & sheets
          • Bottles
          • Others
        • United Arab Emirates (UAE) Polylactic Acid Market, By End-use
          • Packaging
          • Agriculture
          • Automotive & transport
          • Electronics
          • Textile
          • Consumer goods
          • Bio-medical
          • Others
      • South Africa
        • South Africa Polylactic Acid Market, By Raw Material
          • Corn starch
          • Sugarcane
          • Cassava
          • Others
        • South Africa Polylactic Acid Market, By Application
          • Rigid thermoforms
          • Films & sheets
          • Bottles
          • Others
        • South Africa Polylactic Acid Market, By End-use
          • Packaging
          • Agriculture
          • Automotive & transport
          • Electronics
          • Textile
          • Consumer goods
          • Bio-medical
          • Others

Polylactic Acid Market Dynamics

Driver: Growing Demand For Bioplastics

Bioplastics are environmentally friendly alternatives to traditional plastics, notably in flexible and rigid packaging applications, because they are bio-based, compostable, and biodegradable in nature. The rising application of bioplastics in packaging, automotive & transport, agriculture, electronics, and other applications is expected to augment the demand for polylactic acid over the forecast period. Polylactic acid was traditionally used in packaging and medical applications but is now gaining acceptance in the automotive industry. In the automotive industry, it is used in interior parts of vehicles, such as floor mats, upholstery, protective wrapping, and under-the-hood components. Bioplastics are derived from biomass, such as animals, plants, and trees, and some are derived from food waste. Their usage can help reduce the dependency on fossil-fuel-based petroleum products for plastic production and reduce carbon footprint as well. A key factor driving the growth of the flexible packaging market is increased focus on sustainable products.

Driver: Growing Demand From The Flexible Packaging Industry

PLA packaging provides an environment-friendly solution and helps in enhancing the appearance of the final product. Use of PLA packaging in green packaging of various food products is likely to improve its growth prospects over the forecast period. The growing use of bioplastics in flexible packaging is expected to fuel the growth of the polylactic acid market. Growing demand for food, on account of increasing global population, is one of the key trends augmenting the market growth. With the advancements in manufacturing technology, the usage of enhanced packaging and case-ready packaging practices are expected to benefit the polylactic acid market. Asia Pacific is projected to dominate the packaging market over the forecast period due to the flourishing food & beverage sector, particularly in China and India.

Restraint: Price Competitiveness

The premium pricing of polylactic acid as compared to conventional polymers, including polypropylene (PP), polyethylene (PE), polyvinyl chloride (PVC), polyethylene terephthalate (PET), and polystyrene (PS), is one of the key factors restraining the growth of the global PLA market. One of the major cost factors is the raw material used in the fermentation process. Furthermore, polylactic acid has certain limitations as compared to conventional plastics, i.e., it can warp and distort at relatively low temperatures. PLA does not compost fast enough for industrial composters and the residue is not composted nor does it improve the soil quality. PLA cannot be used for applications where impact resistance and toughness are critical as it is not the hardest or toughest plastic. Apart from price competitiveness, these factors are expected to have a negative impact on the market growth.

What Does This Report Include?

This section will provide insights into the contents included in this polylactic acid market report and help gain clarity on the structure of the report to assist readers in navigating smoothly.

Polylactic acid market qualitative analysis

  • Industry overview

  • Industry trends

  • Market drivers and restraints

  • Market size

  • Growth prospects

  • Porter’s analysis

  • PESTEL analysis

  • Key market opportunities prioritized

  • Competitive landscape

    • Company overview

    • Financial performance

    • Product benchmarking

    • Latest strategic developments

Polylactic acid market quantitative analysis

  • Market size, estimates, and forecast from 2018 to 2030

  • Market estimates and forecast for product segments up to 2030

  • Regional market size and forecast for product segments up to 2030

  • Market estimates and forecast for application segments up to 2030

  • Regional market size and forecast for application segments up to 2030

  • Company financial performance

What questions do you have? Get quick response from our industry experts. Request a Free Consultation

Research Methodology

A three-pronged approach was followed for deducing the polylactic acid market estimates and forecasts. The process has three steps: information procurement, analysis, and validation. The whole process is cyclical, and steps repeat until the estimates are validated. The three steps are explained in detail below:

Information procurement: Information procurement is one of the most extensive and important stages in our research process, and quality data is critical for accurate analysis. We followed a multi-channel data collection process for polylactic acid market to gather the most reliable and current information possible.

  • We buy access to paid databases such as Hoover’s and Factiva for company financials, industry information, white papers, industry journals, SME journals, and more.
  • We tap into Grand View’s proprietary database of data points and insights from active and archived monitoring and reporting.
  • We conduct primary research with industry experts through questionnaires and one-on-one phone interviews.
  • We pull from reliable secondary sources such as white papers and government statistics, published by organizations like WHO, NGOs, World Bank, etc., Key Opinion Leaders (KoL) publications, company filings, investor documents, and more.
  • We purchase and review investor analyst reports, broker reports, academic commentary, government quotes, and wealth management publications for insightful third-party perspectives.

Analysis: We mine the data collected to establish baselines for forecasting, identify trends and opportunities, gain insight into consumer demographics and drivers, and so much more. We utilized different methods of polylactic acid market data depending on the type of information we’re trying to uncover in our research.

  • Market Research Efforts: Bottom-up Approach for estimating and forecasting demand size and opportunity, top-down Approach for new product forecasting and penetration, and combined approach of both Bottom-up and Top-down for full coverage analysis.

  • Value-Chain-Based Sizing & Forecasting: Supply-side estimates for understanding potential revenue through competitive benchmarking, forecasting, and penetration modeling.

  • Demand-side estimates for identifying parent and ancillary markets, segment modeling, and heuristic forecasting.

  • Qualitative Functional Deployment (QFD) Modelling for market share assessment.

Market formulation and validation: We mine the data collected to establish baselines for forecasting, identify trends and opportunities, gain insight into consumer demographics and drivers, and so much more. We utilize different methods of data analysis depending on the type of information we’re trying to uncover in our research.

  • Market Formulation: This step involves the finalization of market numbers. This step on an internal level is designed to manage outputs from the Data Analysis step.

  • Data Normalization: The final market estimates and forecasts are then aligned and sent to industry experts, in-panel quality control managers for validation.

  • This step also entails the finalization of the report scope and data representation pattern.

  • Validation: The process entails multiple levels of validation. All these steps run in parallel, and the study is forwarded for publishing only if all three levels render validated results.

Polylactic Acid Market Categorization:

The polylactic acid market was categorized into four segments, namely raw material (Corn starch, Sugarcane, Cassava), application (Rigid thermoform, Film & sheets, Bottles), end-use (Packaging, Agriculture, Automotive & Transportation, Electronics, Textile, Consumer goods, Bio-medical), and region (North America, Europe, Asia Pacific, Central & South America, and Middle East & Africa).

Segment Market Methodology:

The polylactic acid market was segmented into raw material, application, end-use, and regions. The demand at a segment level was deduced using a funnel method. Concepts like the TAM, SAM, SOM, etc., were put into practice to understand the demand. We at GVR deploy three methods to deduce market estimates and determine forecasts. These methods are explained below:

Market research approaches: Bottom-up

  • Demand estimation of each product across countries/regions summed up to from the total market.

  • Variable analysis for demand forecast.

  • Demand estimation via analyzing paid database, and company financials either via annual reports or paid database.

  • Primary interviews for data revalidation and insight collection.

Market research approaches: Top-down

  • Used extensively for new product forecasting or analyzing penetration levels.

  • Tool used invoice product flow and penetration models Use of regression multi-variant analysis for forecasting Involves extensive use of paid and public databases.

  • Primary interviews and vendor-based primary research for variable impact analysis.

Market research approaches: Combined

  • This is the most common method. We apply concepts from both the top-down and bottom-up approaches to arrive at a viable conclusion.

Regional Market Methodology:

The polylactic acid market was analyzed at a regional level. The globe was divided into North America, Europe, Asia Pacific, Central & South America, and Middle East & Africa, keeping in focus variables like consumption patterns, export-import regulations, consumer expectations, etc. These regions were further divided into twenty-six countries, namely, the U.S.; Canada; Mexico; Germany; the UK; France; Italy; Spain; Netherlands; Turkey; China; India; Japan; South Korea; Singapore; Malaysia; Indonesia; Philippines; Thailand; Vietnam; Australia; Brazil; Argentina; Saudi Arabia; United Arab Emirates; South Africa.

All three above-mentioned market research methodologies were applied to arrive at regional-level conclusions. The regions were then summed up to form the global market.

Polylactic acid market companies & financials:

The polylactic acid market was analyzed via companies operating in the sector. Analyzing these companies and cross-referencing them to the demand equation helped us validate our assumptions and conclusions. Key market players analyzed include:

  • TotalEnergies Corbion B.V. -  TotalEnergies Corbion B.V. is a global technology leader in Poly Lactic Acid (PLA) and lactide monomers. Its product portfolio includes food products, algae ingredients products, biochemical & biomedical products, chemical products, coatings and adhesives, personal care, pharma, and bioplastic products.

  • NatureWorks LLC - NatureWorks LLC provides rigid and flexible packaging solutions; food service ware; health and personal care; durable products in home appliances, and electronic categories; automotive interior parts, clothing, 3D printing filament, and personal care & hygiene products for various end-use industries. In addition, PTT Global Chemical and Cargill jointly own the company.

  • Jiangsu Supla Bioplastics Co., Ltd. -  The company manufactures and distributes bio-based fulldegradable polylactic acid (PLA). Its product portfolio includes foaming grade Polylactic Acid (PLA), Wire Rod Grade PLA, Ejection Blowing Grade, and Injection Molding Grade for applications such as electronics, automotive, food packaging, agriculture, and others.

  • Futerro – Futerro produces Polylactic Acid (PLA), which is used across several applications such as thermoforming, fibers & nonwoven, film & coating, injection molding, bottles, molding and 3D printing. The company offers products that are compostable, recyclable, has low carbon footprint, and bio-based compared to existing oil-based products.

  • COFCO- The company specializes in the manufacturing and distribution of agricultural products and diversified food services. The company has three business segments, namely food, finance, and real estate, which are engaged in the production of grains, oil, sugars, cotton, meat, and dairy products.

  • Jiangxi Keyuan Biopharm Co., Ltd. - Jiangxi Keyuan Biopharm Co., Ltd.’s product portfolio includes chiral mandelic acid series, chiral cyanohydrins series, intermediate, and diphenyl acetonitrile such as atorvastatin. The company caters its products to various industries including adhesives, paints & coatings, medical & pharmaceutical s, food & beverages, automotive & transportation, energy, packaging & printing, and electrical & electronics.

  • Shanghai Tong-jie-liang Biomaterials Co., Ltd. - The company’s product portfolio includes biomass materials, biopolymer fibers, biobased nonwoven, biobased films, bed sheets, personal care products, and 3d Print PLA.

  • Zhejiang Hisun Biomaterials Co., Ltd. - The company’s product portfolio includes polylactic acids, plant containers, food storage bags, carton liners, cling films, coffee pods, food & beverage, tablecloths, tea bag components, and others for various end-use industries such as 3D printing, extrusion & injection blow molding, thermoforming, film and laminating, injection molding, and non-woven fabric.

Value chain-based sizing & forecasting

Supply Side Estimates

  • Company revenue estimation via referring to annual reports, investor presentations, and Hoover’s.

  • Segment revenue determination via variable analysis and penetration modeling.

  • Competitive benchmarking to identify market leaders and their collective revenue shares.

  • Forecasting via analyzing commercialization rates, pipelines, market initiatives, distribution networks, etc.

Demand side estimates

  • Identifying parent markets and ancillary markets

  • Segment penetration analysis to obtain pertinent

  • revenue/volume

  • Heuristic forecasting with the help of subject matter experts

  • Forecasting via variable analysis

Polylactic Acid Market Report Objectives:

  • Understanding market dynamics (in terms of drivers, restraints, & opportunities) in the countries.

  • Understanding trends & variables in the individual countries & their impact on growth and using analytical tools to provide high-level insights into the market dynamics and the associated growth pattern.

  • Understanding market estimates and forecasts (with the base year as 2023, historic information from 2018 to 2023, and forecast from 2024 to 2030). Regional estimates & forecasts for each category are available and are summed up to form the global market estimates.

Polylactic Acid Market Report Assumptions:

  • The report provides market value for the base year 2023 and a yearly forecast till 2030 in terms of revenue/volume or both. The market for each of the segment outlooks has been provided on region & country basis for the above-mentioned forecast period.

  • The key industry dynamics, major technological trends, and application markets are evaluated to understand their impact on the demand for the forecast period. The growth rates were estimated using correlation, regression, and time-series analysis.

  • We have used the bottom-up approach for market sizing, analyzing key regional markets, dynamics, & trends for various products and end-users. The total market has been estimated by integrating the country markets.

  • All market estimates and forecasts have been validated through primary interviews with the key industry participants.

  • Inflation has not been accounted for to estimate and forecast the market.

  • Numbers may not add up due to rounding off.

  • Europe consists of EU-8, Central & Eastern Europe, along with the Commonwealth of Independent States (CIS).

  • Asia Pacific includes South Asia, East Asia, Southeast Asia, and Oceania (Australia & New Zealand).

  • Latin America includes Central American countries and the South American continent

  • Middle East includes Western Asia (as assigned by the UN Statistics Division) and the African continent.

Primary Research

GVR strives to procure the latest and unique information for reports directly from industry experts, which gives it a competitive edge. Quality is of utmost importance to us, therefore every year we focus on increasing our experts’ panel. Primary interviews are one of the critical steps in identifying recent market trends and scenarios. This process enables us to justify and validate our market estimates and forecasts to our clients. With more than 8,000 reports in our database, we have connected with some key opinion leaders across various domains, including healthcare, technology, consumer goods, and the chemical sector. Our process starts with identifying the right platform for a particular type of report, i.e., emails, LinkedIn, seminars, or telephonic conversation, as every report is unique and requires a differentiated approach.

We send out questionnaires to different experts from various regions/ countries, which is dependent on the following factors:

  • Report/Market scope: If the market study is global, we send questionnaires to industry experts across various regions, including North America, Europe, Asia Pacific, Latin America, and MEA.

  • Market Penetration: If the market is driven by technological advancements, population density, disease prevalence, or other factors, we identify experts and send out questionnaires based on region or country dominance.

The time to start receiving responses from industry experts varies based on how niche or well-penetrated the market is. Our reports include a detailed chapter on the KoL opinion section, which helps our clients understand the perspective of experts already in the market space.

What questions do you have? Get quick response from our industry experts. Request a Free Consultation
gvr icn

GET A FREE SAMPLE

gvr icn

This FREE sample includes data points, ranging from trend analyses to estimates and forecasts. See for yourself.

gvr icn

NEED A CUSTOM REPORT?

We can customize every report - free of charge - including purchasing stand-alone sections or country-level reports, as well as offer affordable discounts for start-ups & universities. Contact us now

Certified Icon

We are GDPR and CCPA compliant! Your transaction & personal information is safe and secure. For more details, please read our privacy policy.