- Home
- »
- Next Generation Technologies
- »
-
APAC Smart Retail Market Size, Industry Analysis Report, 2020-2027GVR Report cover
![Asia Pacific Smart Retail Market Size, Share & Trends Report]()
Asia Pacific Smart Retail Market Size, Share & Trends Analysis Report By Solution, By Application (Visual Marketing, Smart Label, Smart Payment System, Intelligent System), By Country, And Segment Forecasts, 2020 - 2027
- Report ID: GVR-4-68038-204-4
- Number of Report Pages: 88
- Format: PDF, Horizon Databook
- Historical Range: 2016 - 2018
- Forecast Period: 2020 - 2027
- Industry: Technology
Report Overview
The Asia Pacific smart retail market size was estimated at USD 3.8 billion in 2019. The increasing need for better shopping experience and customer services is anticipated to be a key factor driving the market growth over the forecast period. Additionally, increasing investment in the retail industry, coupled with the declining cost of electric and electronic components, will open-up massive opportunities for the solution and component providers operating in the market.

Customer service has been evolving for the past few years, from merely addressing the queries to understanding the changing consumer behavior and preferences. The latest technologies, such as Augmented Reality (AR), Virtual Reality (VR), Artificial Intelligence (AI), and the Internet of Things (IoT), can be readily implemented in the retail industry to facilitate accurate inventory management, improve the store operations, and enhance the consumers’ shopping experience. Conventional brick-and-mortar retailers can also utilize these technologies to attract more consumers to their stores, improve customer retention, and subsequently cement their position against online retailers. For instance, some of the retail stores in China are already using AR-enabled mirrors in fitting rooms so that customers can try different clothes and styles by standing in front of these mirrors.
The physical retailer can attract and convert prospective visitors into shoppers, with the incorporation of smart retail technologies. The technology allows them to display targeted pop-ups and promotional messages on the screen in the stores specific to customer needs. Also, various retailers are investing in technology to enhance the customer shopping experience. For instance, Amazon introduced Amazon Go, a smart grocery store that uses IoT technology to offer customers an experience of shopping with no cashiers or checkout lines.
Retailers are increasingly offering various electronic payment options in line with the looming shift in consumer behavior to prefer cashless payments over cash payments. Customers are finding electronic payments more convenient than cash payments as cashless transactions eliminate the need for consumers to carry cash all the time. For instance, in China, almost one-third of the payments in stores and two-thirds of the online sales are happening through mobile wallet operators, such as WeChat Pay and Alipay. According to the Central Bank, more than 60% of China’s adults in rural areas were using digital payment options as of 2017.
One of the key challenges faced by the market includes rising concerns over cyberattacks. Cyberattacks have been on the rise lately, and the retail industry is turning out to be hackers’ primary target. Retail stores can serve as a potential source for hackers to obtain critical customer data and payment information by hacking connected devices, including POS terminals and other IoT-enabled devices. The looming cyber threats and rising concerns over the security of vital transaction data and customer data are expected to curb market growth. In 2018, the retail companies, such as Lord & Taylor and Saks Fifth Avenue, had a record-breaking 5 million debit and credit card detail stolen by the threat group JokerStash Hacking Syndicate.
Solution Insights
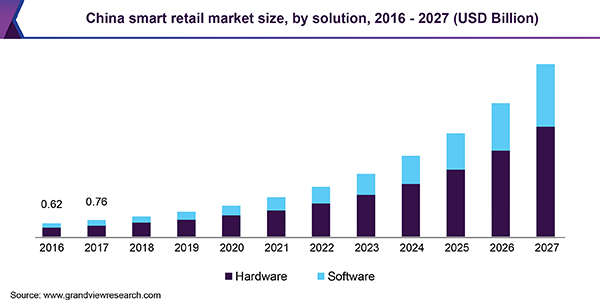
The hardware segment accounted for a dominant share in the Asia Pacific smart retail market in 2019. The segment includes devices such as RFID, Bluetooth beacon, AR and VR, and others used in the deployment of the smart retail solution. The growing demand for these devices to provide a seamless in-store shopping experience to customers is supplementing the growth of the segment. Besides, increasing technological advancement, coupled with the growing retail industry, especially the e-commerce industry across countries such as China, India, and Japan are also anticipated to attribute the hardware segment growth over the forecast period.
The software segment is estimated to expand at the highest CAGR of 28.3% over the forecast period. The growth can be attributed to the increasing adoption of predictive analytics software by retailers to understand customer behavior and their specific needs to improve the shopping experience and customer engagement. Besides, the analytics software is deployed to enhance inventory and store management and can help in making a better pricing decisions. Additionally, the use of AI in digital marketing is also anticipated to influence the demand for the software segment from 2020 to 2027.
Application Insights
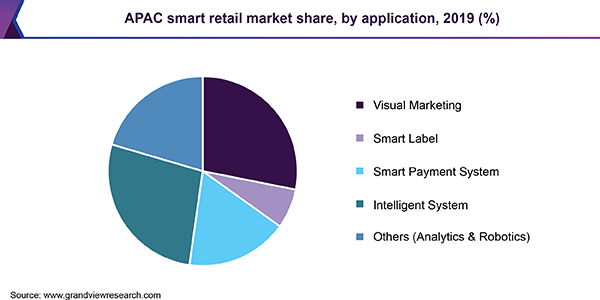
Based on application, the market is segmented into visual marketing, smart labels, smart payment systems, intelligent system, and others. The visual marketing segment held a dominant share of the overall revenue in 2019. There is a high demand for digital signage to provide a digital experience as well as an effective way to communicate with customers in brick-and-mortar stores. Digital signage is used in-store display ads, messages, or videos, which need to be conveyed to the customer for improving the shopping experience and customer engagement. Thus, the segment is expected to hold a significant share over the forecast period.

The other segment comprises analytics and robotics used in the retail industry. The segment is projected to expand at the highest CAGR from 2020 to 2027. The growth can be attributed to the increasing adoption of analytical solutions by retailers to understand their customers’ needs and to improve business operations. Besides, the likely use of robots for providing in-store customer service is expected to drive market growth over the forecast period. For instance, Pepper, developed by Softbank, is driven by AI technology. The robot can give directions and interact and chat with customers which helps improve in-store experience and customer engagement.
Country Insights
China, followed by Japan, is anticipated to hold a dominant market share over the forecast period. It is owing to the increasing deployment of smart retail solutions across the brick-and-mortar stores and supermarkets in the countries. China and Japan have already started using robots for shopping guides, reception, intelligent dressing mirrors, logistics, and goods shelf detection that work on technologies, such as machine learning, computer vision, AR/VR, and natural language processing. For instance, in January 2020, Huwaei’s SOTA Wuhan Optics Valley retail outlet is an unmanned store where robots manage inventory, storage, display, and sales.
The market in India is projected to expand at the highest CAGR over the forecast period. The growth can be attributed owing to the increasing technological advancement, coupled with the growing online and offline retail industry in the country. For instance, in September 2018, Watasale opened a fully automated cashier-free retail outlet in Kerala, India, and uses AI, cameras, sensors, and smart payment systems, among others. Moreover, the liberalization of foreign direct investment in single-brand retail and the anticipated foray of multi-brand retail have triggered momentous interest among multinational retailers to invest in the Indian market. In 2018, India invested USD 180.2 million in the retail sector. Such increasing investments in the retail industry bode well for the growth of the Indian market over the forecast period.
Asia Pacific Smart Retail Market Share Insights
The market is in its emerging stage; though, there is intense competition among existing players and new entrants. Key industry players include InvenSense, Inc.; IntelliVision; Probiz Technologies Pvt Ltd.; Robert Bosch Engineering and Business Solutions Private Limited; Cisco Systems, Inc.; Honeywell International, Inc.; IBM; Amazon.com, Inc.; Cognizant; Ingenico Group; Broadcom; Intel Corporation; VeriFone, Inc.; and Digimarc Corporation. The key players are focused on a strategic partnership to strengthen their market position. For instance, in November 2019, Ingenico Group entered into a partnership with Pundi X, a Singapore-based FinTech company. The partnership is focused on enabling crypto payments across the globe. Pundi X completed the integration of its XPOS software with the Ingenico APOS A8 devices.
The market is highly fragmented owing to the presence of several global as well as regional players. The companies are focused on research and development activities to develop innovative products with advanced technologies. For instance, in April 2019, IBM announced that they are working on a Smart Mirror technology for offline retailers. The technology is anticipated to enhance the offline shopping experience of customers through interactive fitting rooms, which can connect customers and retailers digitally.
Report Scope
Attribute
Details
Base year for estimation
2019
Actual estimates/Historical data
2016 - 2018
Forecast period
2020 - 2027
Market representation
Revenue in USD million and CAGR from 2020 to 2027
Regional scope
Asia Pacific
Country scope
China, Japan, India
Report coverage
Revenue forecast, company share, competitive landscape, growth factors and trends
15% free customization scope (equivalent to 5 analyst working days)
If you need specific information, which is not currently within the scope of the report, we will provide it to you as a part of the customization
Segments Covered in the ReportThis report forecasts revenue growth at the regional and country levels and provides an analysis of the latest industry trends in each of the sub-segments from 2016 to 2027. For the purpose of this study, Grand View Research has segmented the Asia Pacific smart retail market report on the basis of solution, application, and country:
-
Solution Outlook (Revenue, USD Million, 2016 - 2027)
-
Hardware
-
Software
-
-
Application Outlook (Revenue, USD Million, 2016 - 2027)
-
Visual Marketing
-
Smart Label
-
Smart Payment System
-
Intelligent System
-
Others (Analytics & Robotics)
-
-
Country Outlook (Revenue, USD Million, 2016 - 2027)
-
China
-
Japan
-
India
-
Frequently Asked Questions About This Report
b. The global Asia Pacific smart retail market size was estimated at USD 3.8 billion in 2019 and is expected to reach USD - billion in 2020.
b. The global Asia Pacific smart retail market is expected to grow at a compound annual growth rate of 26.4% from 2019 to 2027 to reach USD 24.27 billion by 2027.
b. China dominated the Asia pacific smart retail market in 2019. This is attributable to the increasing deployment of smart retail solutions across brick-and-mortar stores and supermarkets.
b. Some key players operating in the Asia pacific smart retail market include InvenSense, Inc.; IntelliVision; Probiz Technologies Pvt Ltd.; Robert Bosch Engineering and Business Solutions Private Limited; Cisco Systems, Inc.; Honeywell International, Inc.; IBM; Amazon.com, Inc.; Cognizant; Ingenico Group; Broadcom; Intel Corporation; VeriFone, Inc.; and Digimarc Corporation.
b. Key factors that are driving the market growth include increasing the need for a better shopping experience and customer services, increasing investment in the retail industry, coupled with the declining cost of electric and electronic components.
Share this report with your colleague or friend.
![gvr icn]()
NEED A CUSTOM REPORT?
We can customize every report - free of charge - including purchasing stand-alone sections or country-level reports, as well as offer affordable discounts for start-ups & universities. Contact us now
![Certified Icon]()
We are GDPR and CCPA compliant! Your transaction & personal information is safe and secure. For more details, please read our privacy policy.
We are committed towards customer satisfaction, and quality service.
"The quality of research they have done for us has been excellent."


